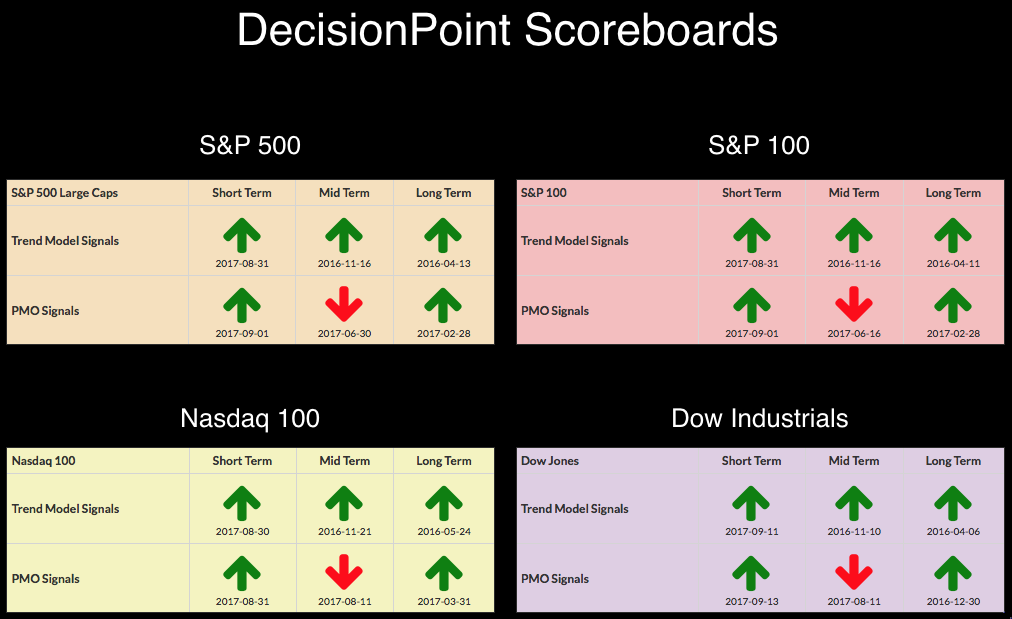
A day passed with no signal changes for the DP Scoreboards, but also for the SPDRs and their equal-weight counterparts that DecisionPoint follows. The market is taking a short pause. I suspect with options expiration tomorrow, we will see more flat trading though with higher volume.
The purpose of the DecisionPoint Alert Daily Update is to quickly review the day's action, internal condition, and Trend Model status of the broad market (S&P 500), the nine SPDR Sectors, the U.S. Dollar, Gold, Crude Oil, and Bonds. To ensure that using this daily reference will be quick and painless, we are as brief as possible, and sometimes we let a chart speak for itself.
SIGNALS: Here we include charts of any important signal changes triggered today by our Intermediate-Term Trend Model.
NO NEW SIGNALS TO REPORT.
NOTE: Mechanical trading model signals define the implied bias of the price index based upon moving average relationships, but they do not necessarily call for a specific action. They are information flags that should prompt chart review. Further, they do not call for continuous buying or selling during the life of the signal. For example, a BUY signal will probably return the best results if action is taken soon after the signal is generated. Additional opportunities for buying may be found as price zigzags higher, but the trader must look for optimum entry points. Conversely, exit points to preserve gains (or minimize losses) may be evident before the model mechanically closes the signal.
STOCKS
IT Trend Model: BUY as of 11/15/2016
LT Trend Model: BUY as of 4/1/2016
The consolidation zone of the past three days is clear.
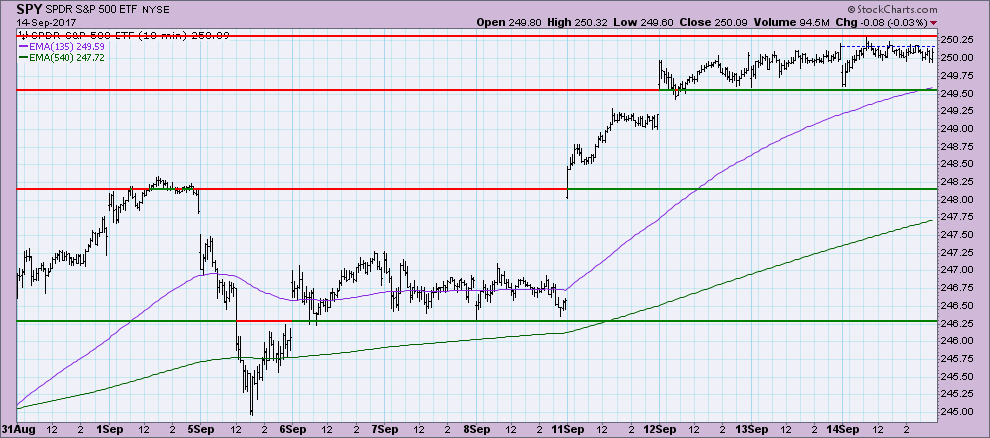
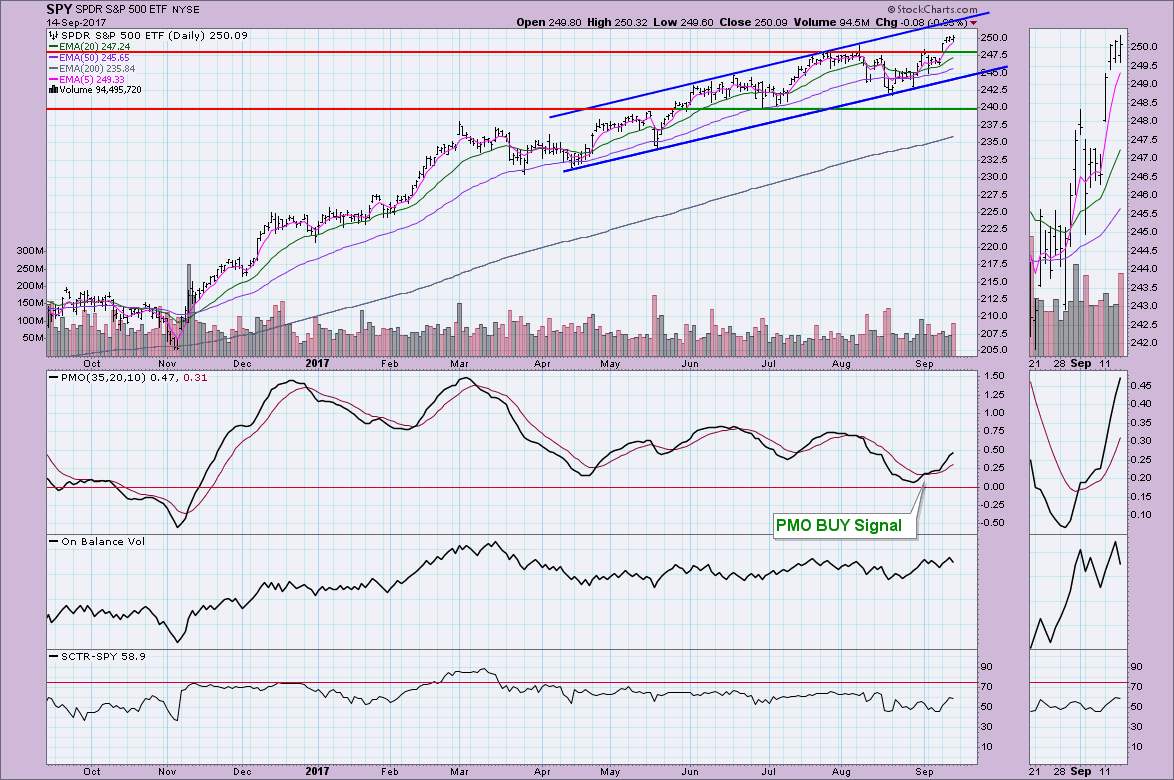
After reaching all-time highs, the SPY is closing right along that resistance. I've constructed a rising trend channel and we see that there is room for the market to move higher. However, there is also room for it to move lower toward the bottom of the trend channel. Given the strong PMO, rising OBV and steady SCTR, I wouldn't expect the bottom of the channel to be tested. More than likely a pullback to $247.50 and then a resumption of the rally.
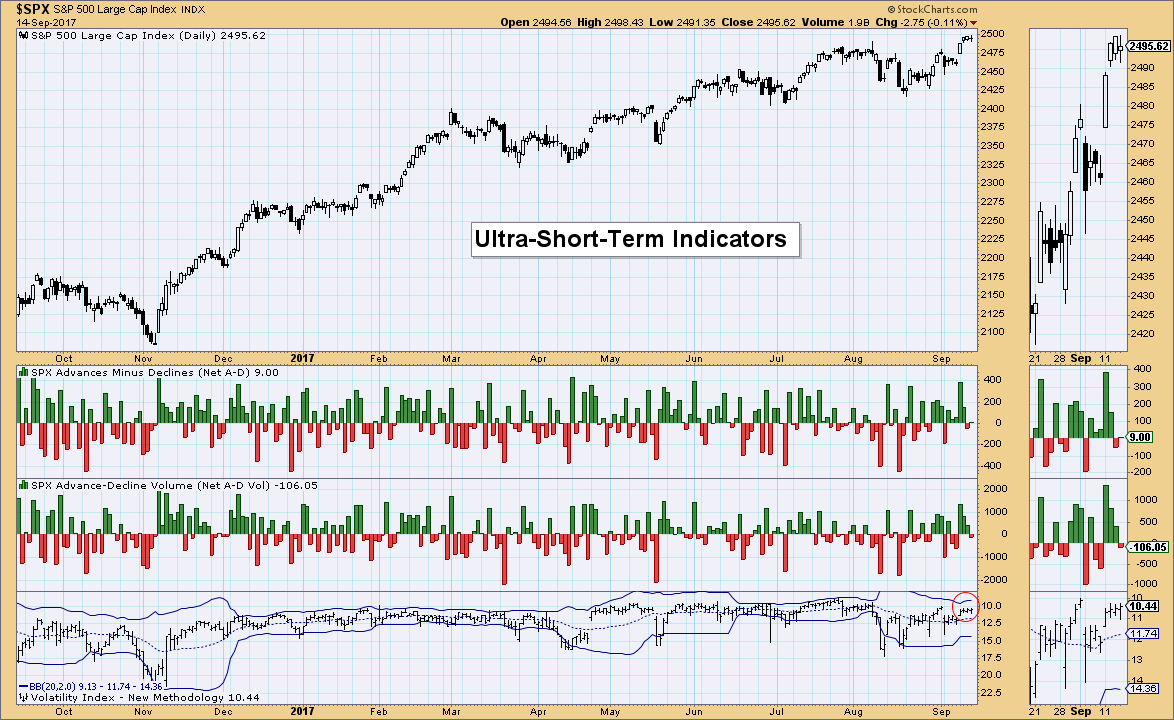
Ultra-Short-Term Indicators: The VIX Bollinger Bands are beginning to shrink again and with readings right around the moving average, there is no climactic activity to review. Breadth was mostly flat.
Short-Term Indicators: These indicators are getting very overbought, but it is hard to ignore the strong rising trend they have been in since bottoming mid-August. The good news is that these indicators can easily unwind without a correction. Note after extremely overbought tops, the market has freed these indicators with sideways consolidation or somewhat painless pullbacks as we saw the last time.
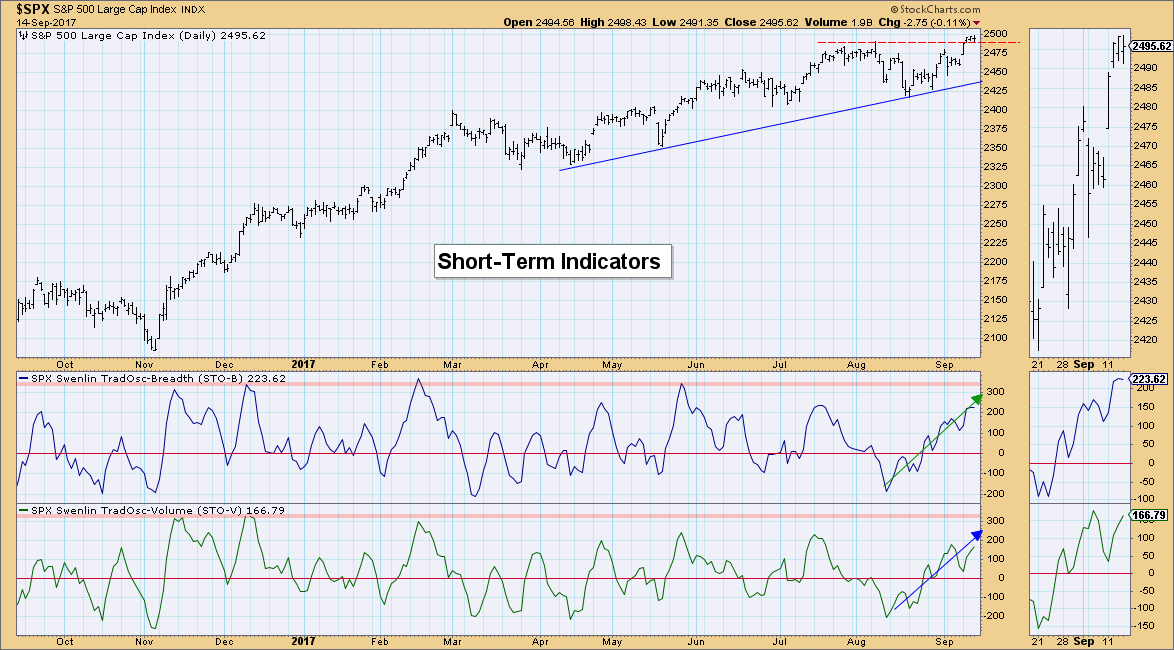
Intermediate-Term Indicators: These indicators look fantastic. They are rising confidently and are just leaving neutral territory.
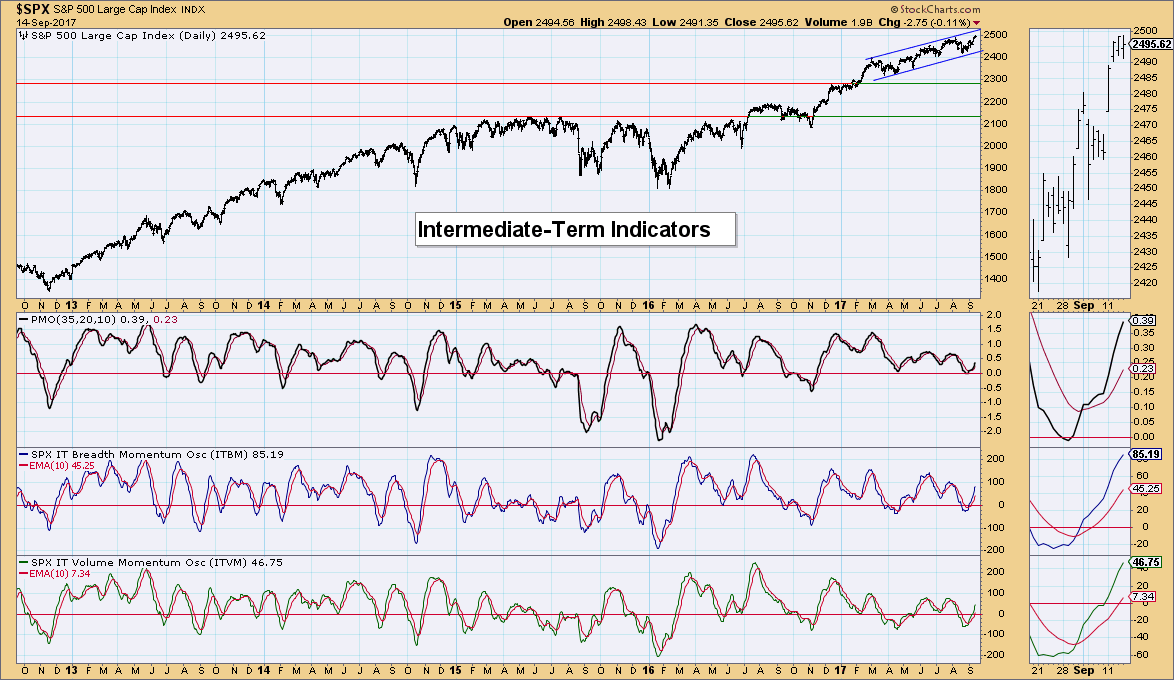
Conclusion: Given the overbought short-term indicators and the logging of new all-time highs this week, I am expecting to see some consolidation underneath or just above current all-time highs. If we are to get a short-term pullback, I would look at worst for a pullback to close the price gaps down to support at about $247 for the SPY. Don't miss tomorrow's DP Weekly Wrap by Carl Swenlin, he tailors the DP Alert to longer-term coverage.
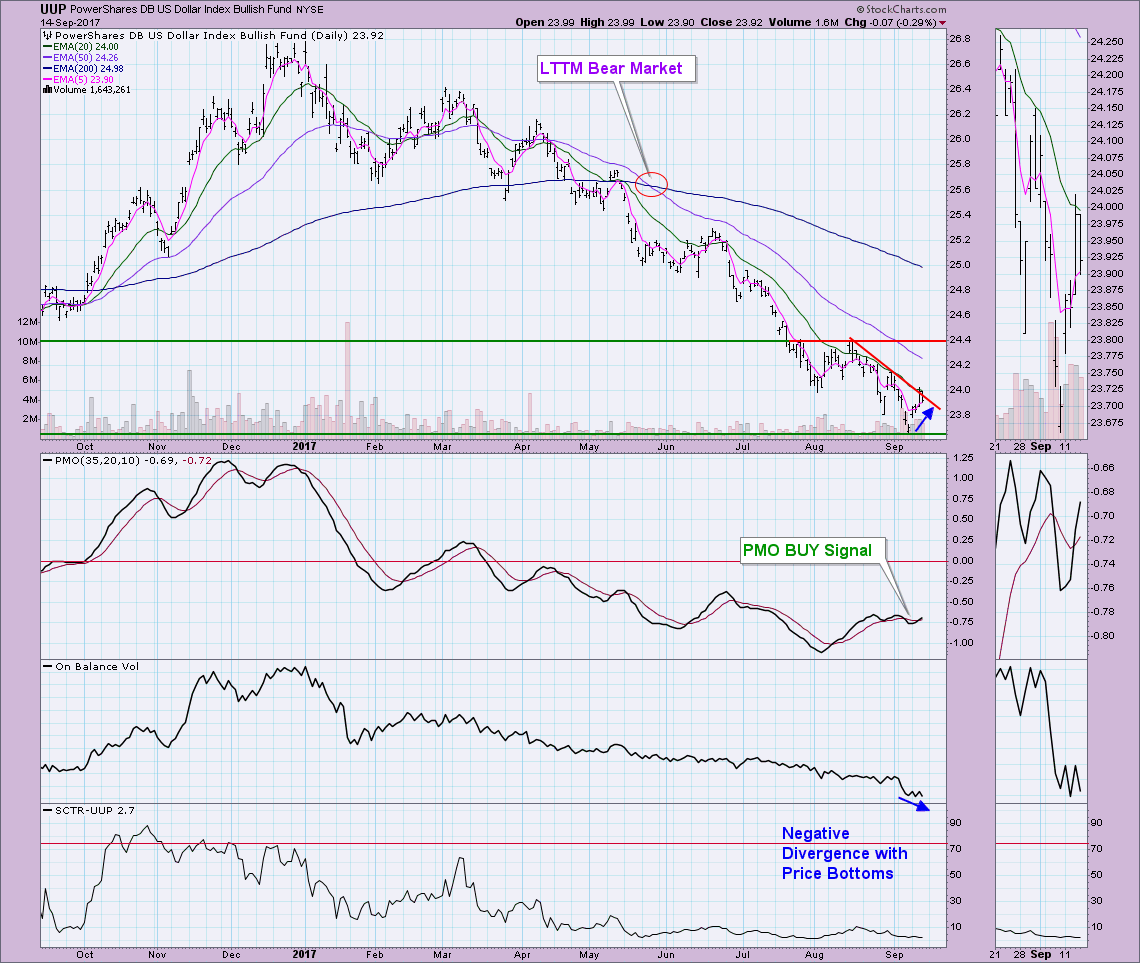
DOLLAR
IT Trend Model: NEUTRAL as of 3/21/2016
LT Trend Model: SELL as of 05/24/2017
UUP was unable to penetrate declining tops line resistance. Granted we have a newish PMO BUY signal, but I'd like to see the reading reach past the previous PMO tops. The 5-EMA hasn't even come close to a positive crossover with the 20-EMA. That crossover would provide a ST Trend Model BUY signal. So at this point, the only bullish characteristic on this chart is the PMO BUY signal of which we can't apply too much weight.
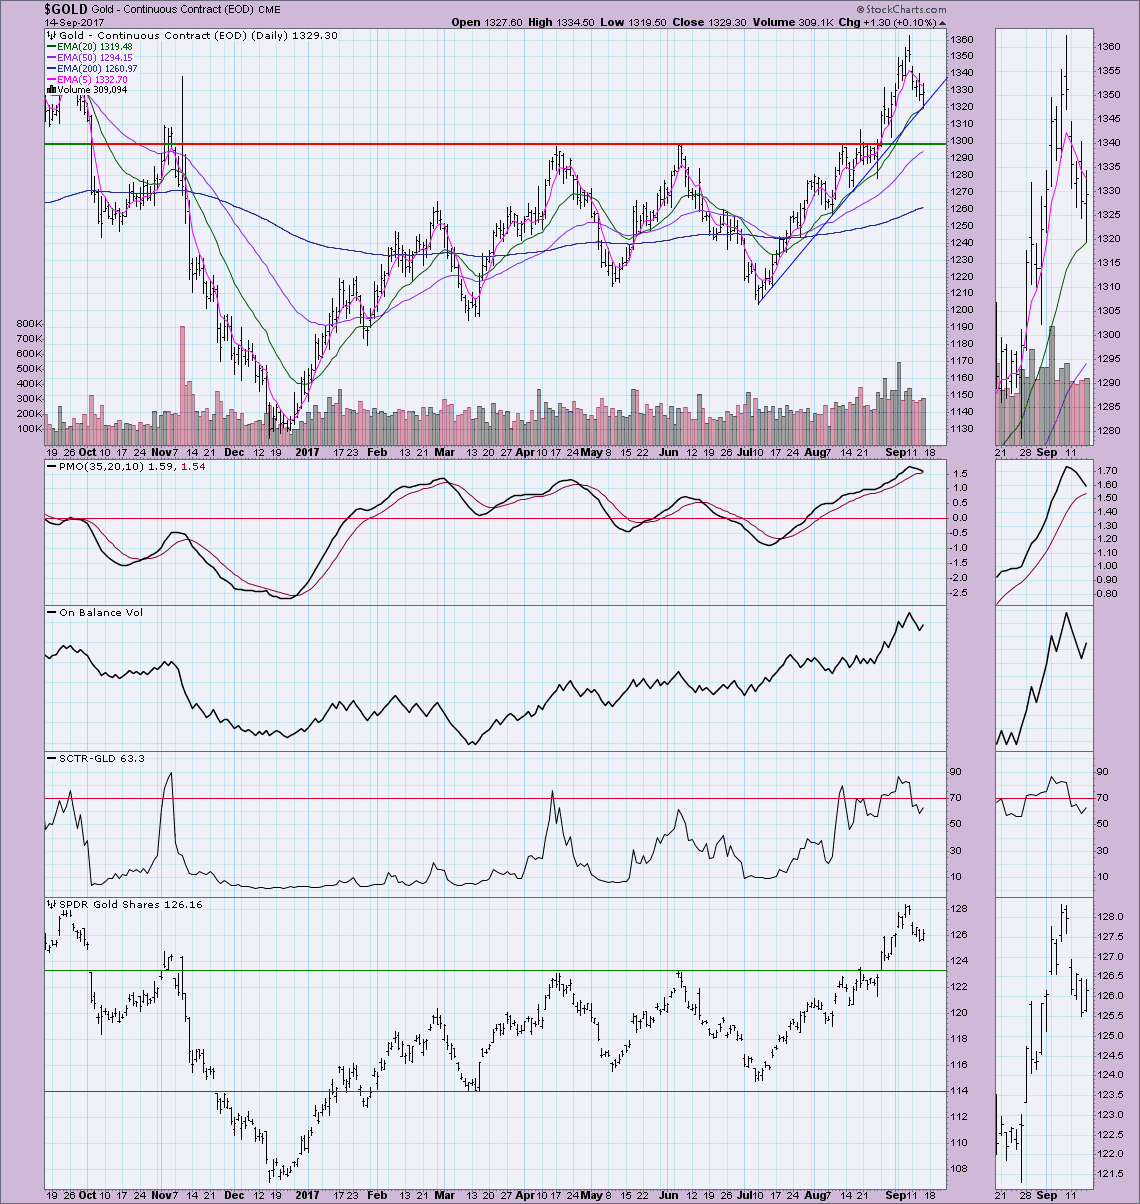
GOLD
IT Trend Model: BUY as of 7/31/2017
LT Trend Model: BUY as of 4/12/2017
We now have a pullback to the rising bottoms trendline. This is a very steep ascent, I suspect it will fall away to a less steep trendline. A pullback to 1300 makes the most sense, especially given the pending PMO SELL Signal.
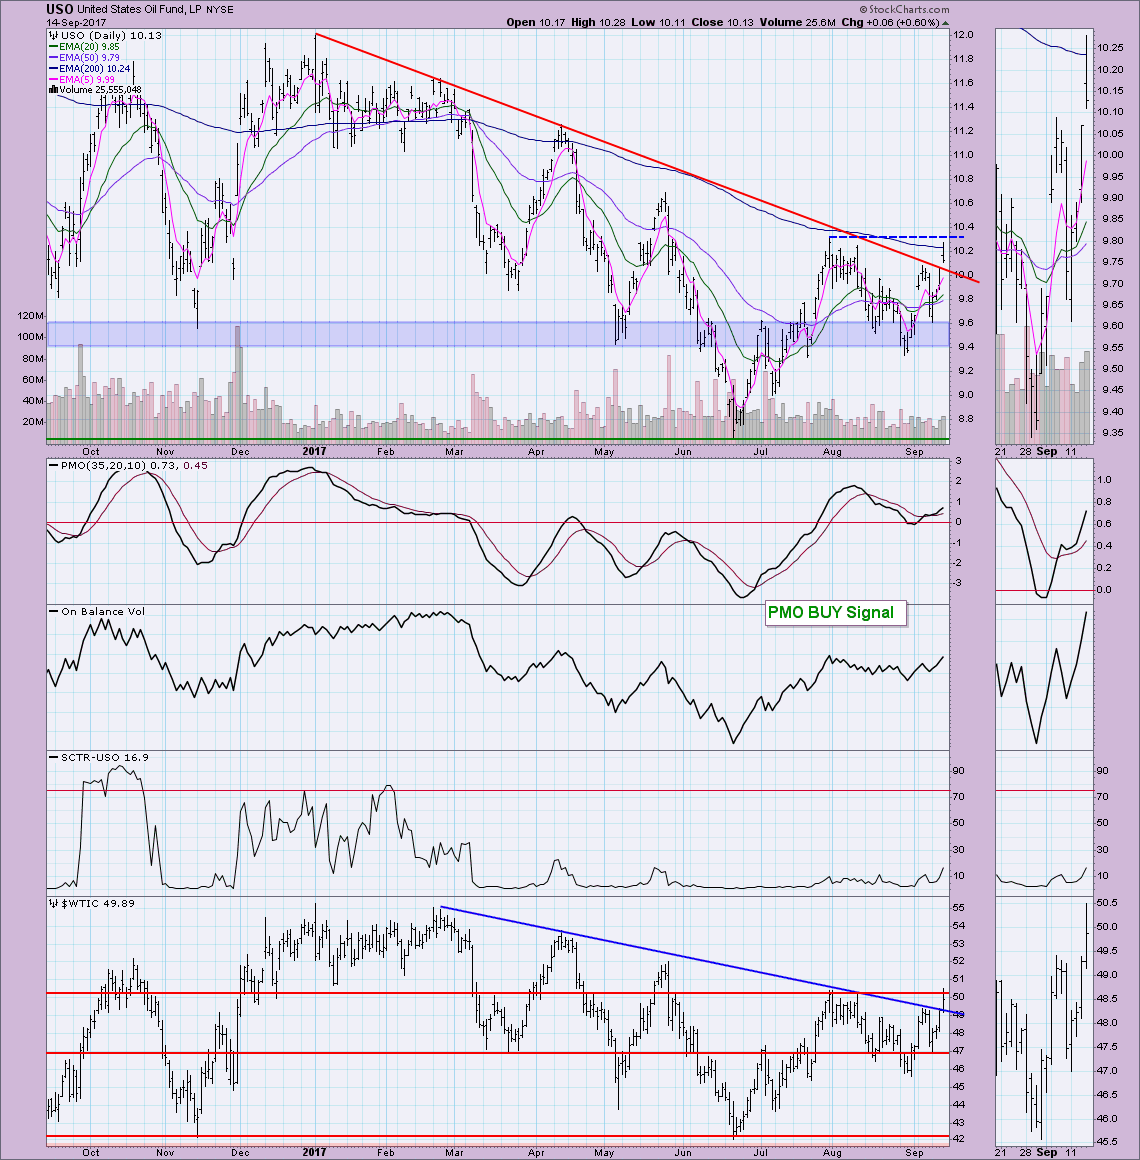
CRUDE OIL (USO)
IT Trend Model: SELL as of 8/29/2017
LT Trend Model: SELL as of 3/9/2017
I still have misgivings about USO and Oil. Oil has now reached the $50/barrel level which has proved strong resistance. USO reached overhead resistance at the late July close and then deflated. The SCTR is coming back to life somewhat and the OBV is encouraging.
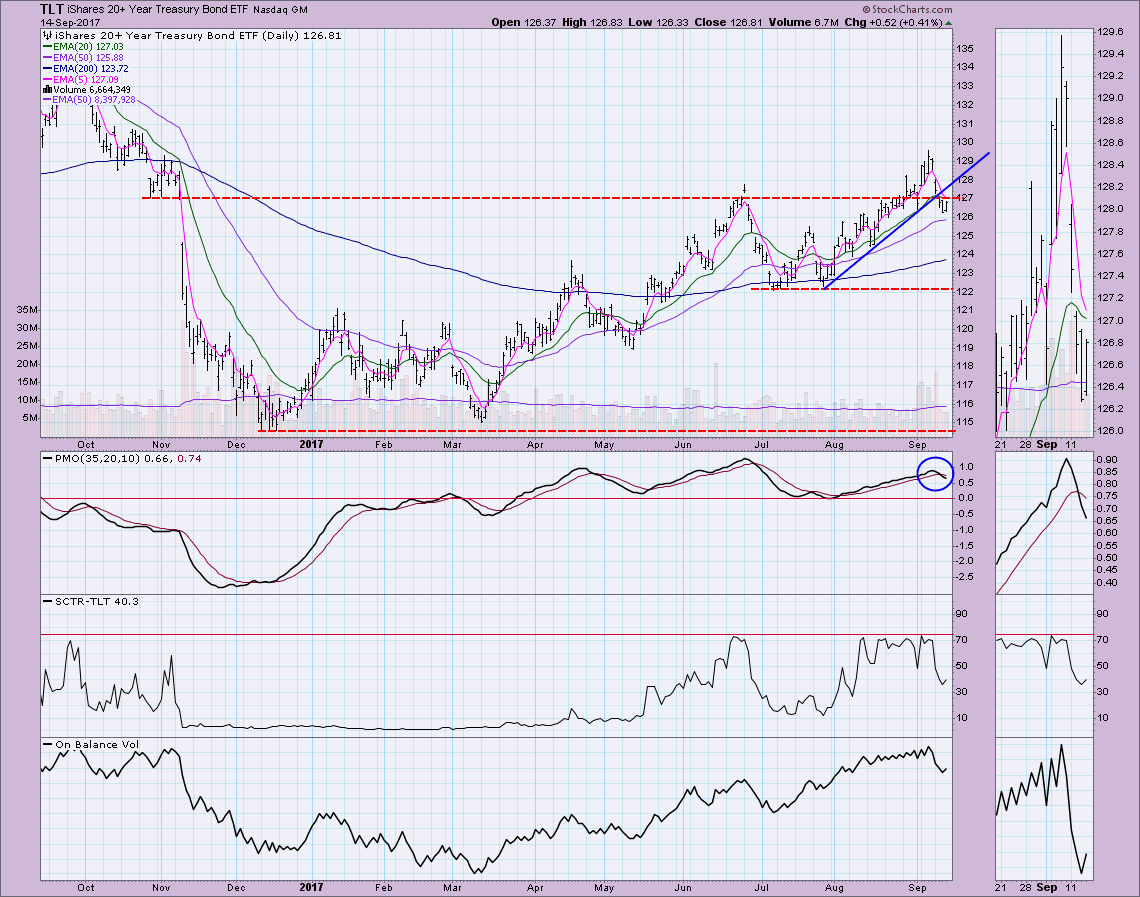
BONDS (TLT)
IT Trend Model: BUY as of 3/31/2017
LT Trend Model: BUY as of 6/16/2017
TLT staunched the bleeding with an inside OHLC bar. I do not see the $126 level holding at all given the overbought PMO SELL signal and clear deterioration of the SCTR and OBV. This could be a very deep correction.
Helpful DecisionPoint Links:
DecisionPoint Shared ChartList and DecisionPoint Chart Gallery
Price Momentum Oscillator (PMO)
Swenlin Trading Oscillators (STO-B and STO-V)
Technical Analysis is a windsock, not a crystal ball.
Happy Charting!
- Erin
**Don't miss DecisionPoint Commentary! Add your email below to be notified of new updates"**