
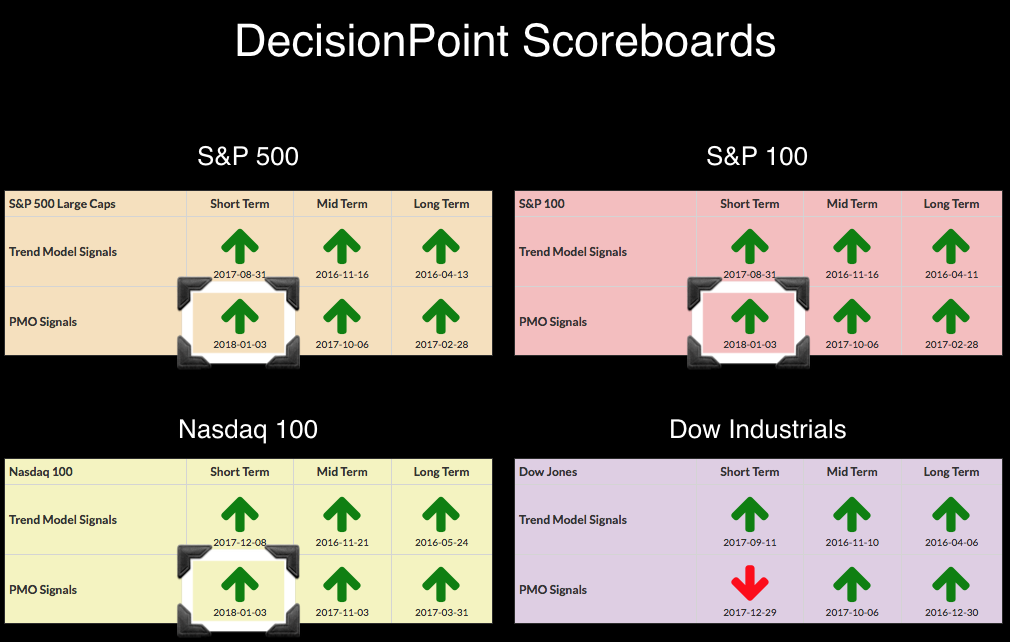
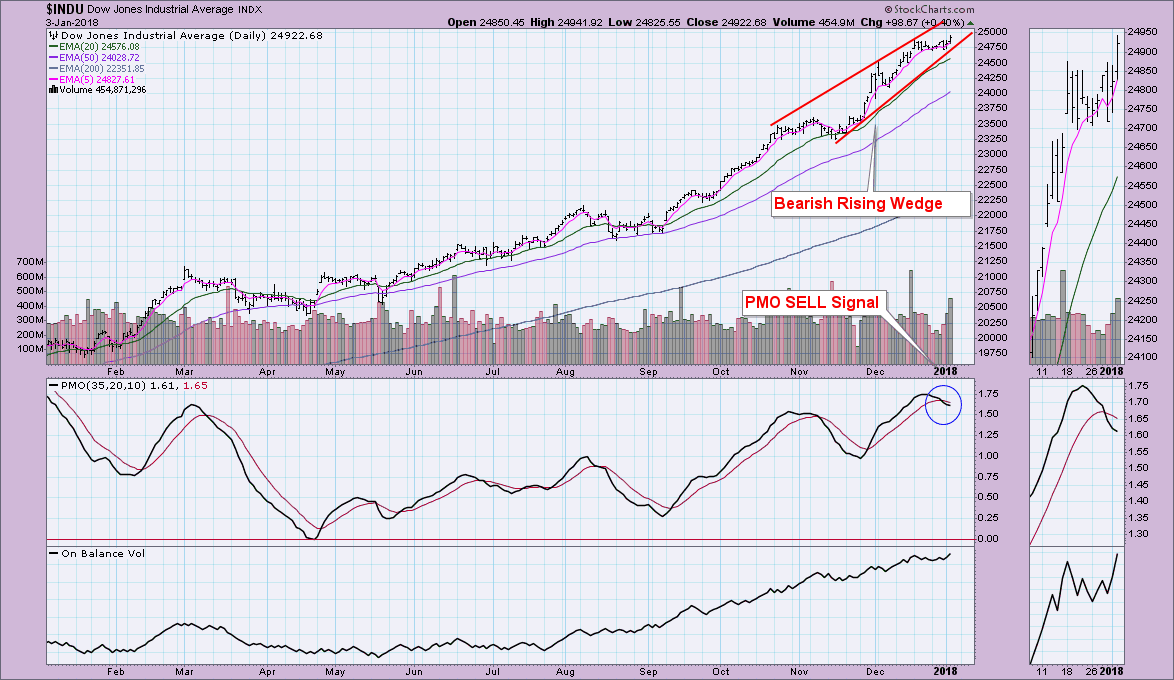
I had a bad feeling about the array of PMO SELL signals that appeared Friday and Tuesday. It wasn't worry about an upcoming decline, more the concern we'd see a whipsaw right back to BUY signals, which we did. Interestingly, the Dow was left out and remains on a PMO SELL signal as it struggles just to turn back up. You'll note under the "arrows" the date the signal generated.
The purpose of the DecisionPoint Alert Daily Update is to quickly review the day's action, internal condition, and Trend Model status of the broad market (S&P 500), the nine SPDR Sectors, the U.S. Dollar, Gold, Crude Oil, and Bonds. To ensure that using this daily reference will be quick and painless, we are as brief as possible, and sometimes we let a chart speak for itself.
STOCKS
IT Trend Model: BUY as of 11/15/2016
LT Trend Model: BUY as of 4/1/2016
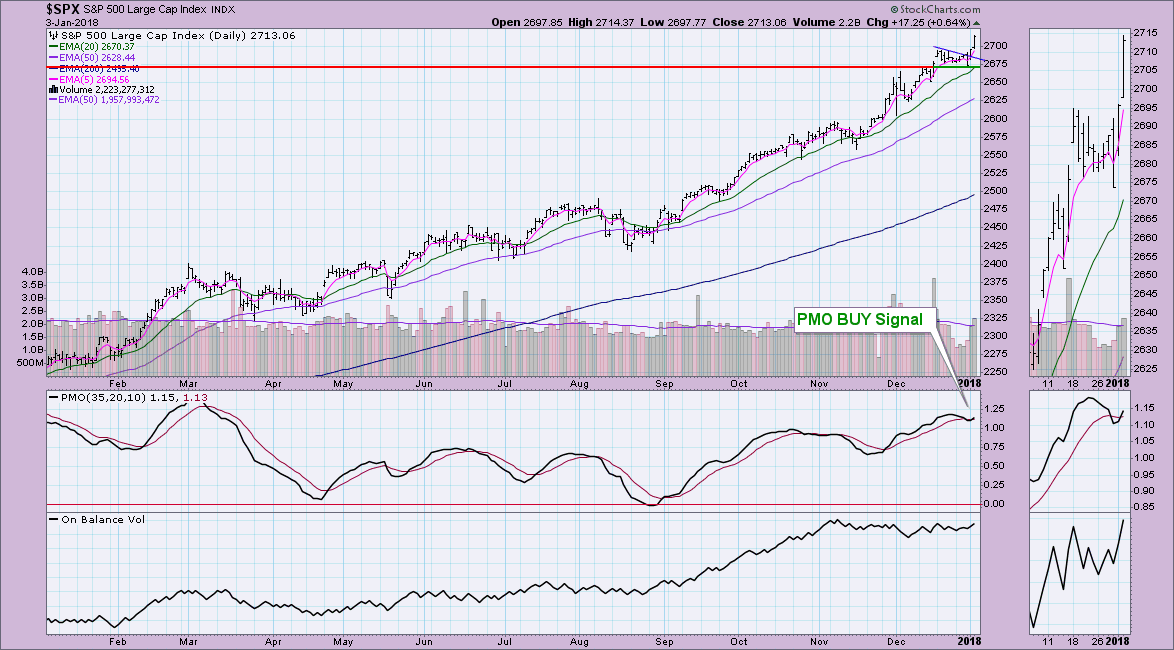
Today's rally was impressive as far as a follow-on. After pausing most of yesterday afternoon, the SPX leapt higher today will very little movement to the downside.
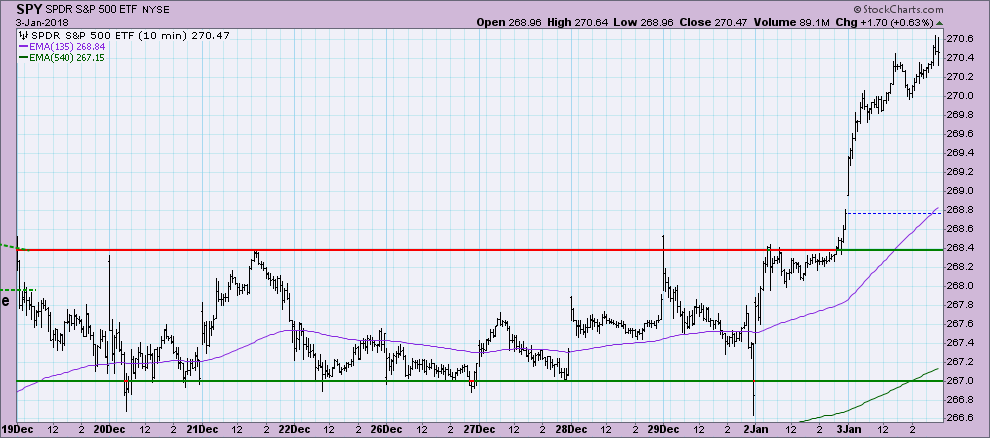
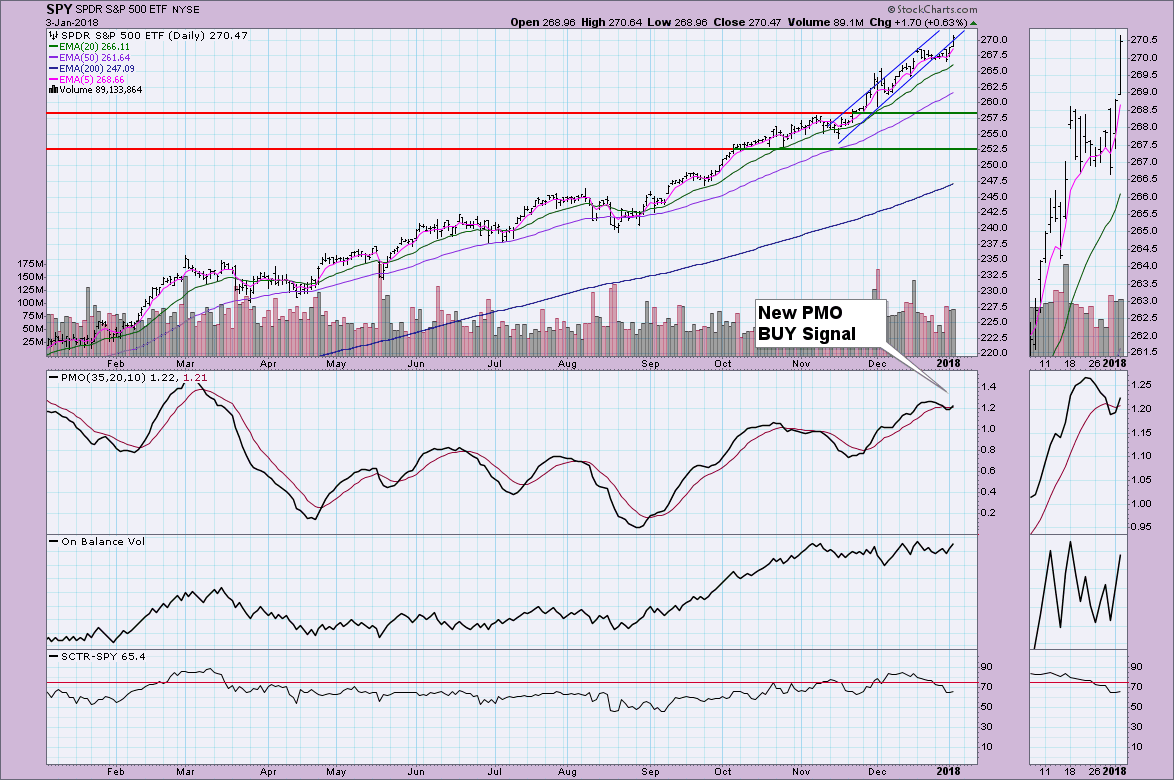
It appeared the market was working on lowering its angle of ascent, but price has now popped back up into that steep rising trend channel. The SPY of course logged its own PMO BUY signal.
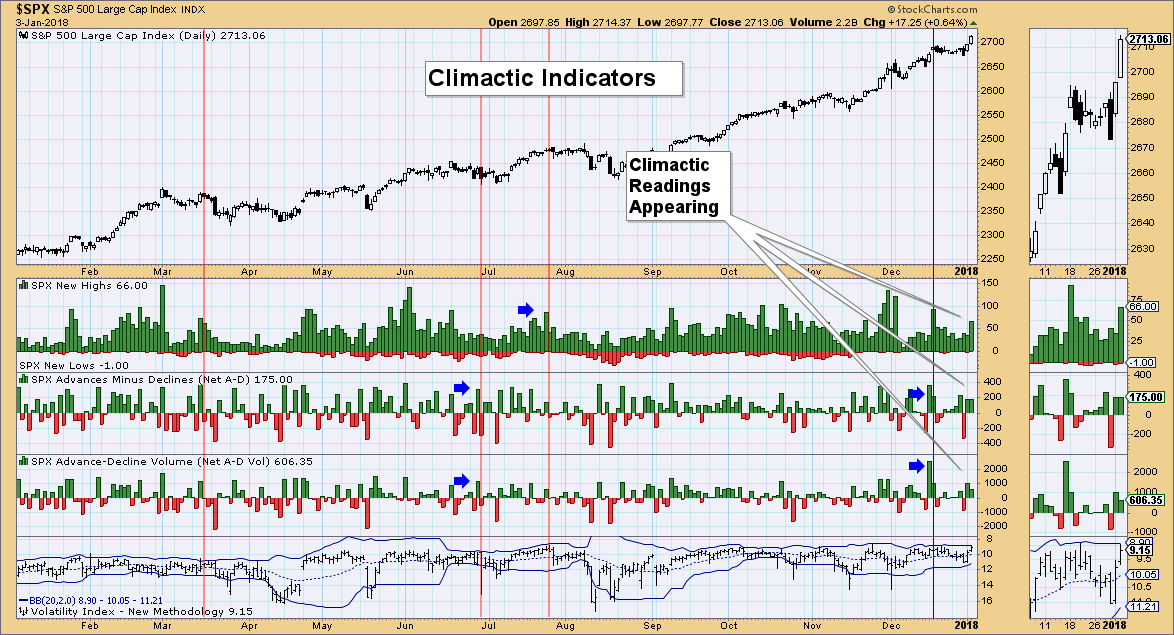
Climactic Indicators: This chart tells me that we won't likely see much follow-through into the end of the week. We're seeing climactic positive readings appearing in our breadth indicators. However, the tell-tale sign to me is the near puncture of the top Bollinger Band on the VIX. I've annotated when tops on VIX were accompanied by climactic indicator readings.
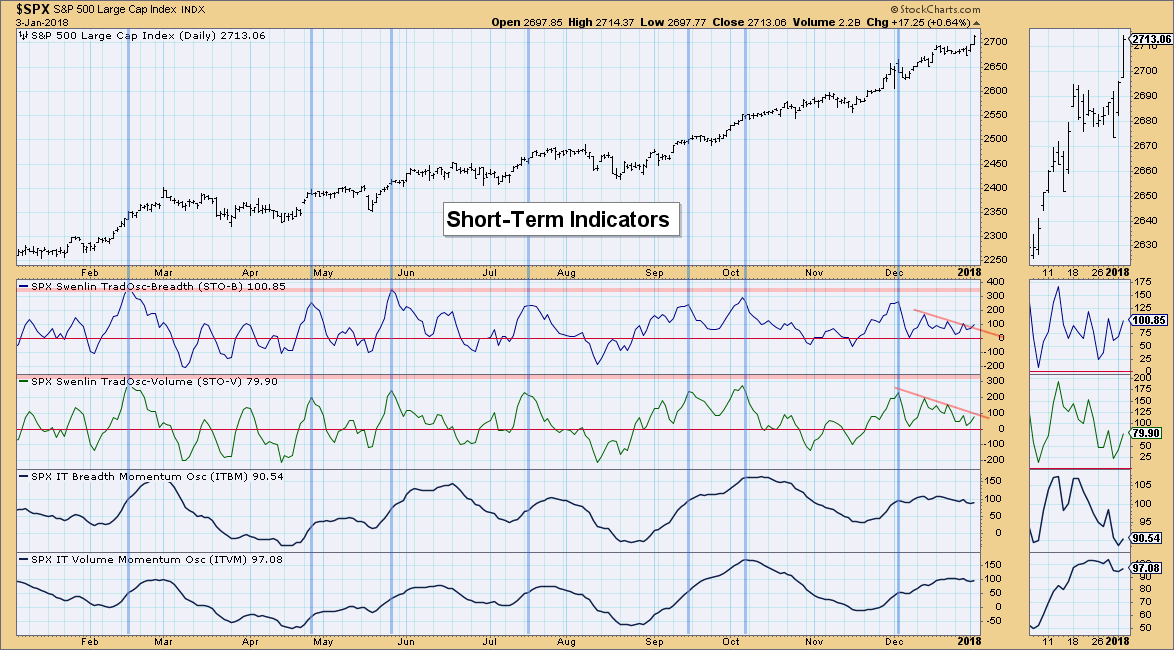
Short-Term Indicators: Good news and bad news on this chart... Let's start with the good news. We are seeing these indicators continue to oscillate above the zero line and that indicates internal strength. However, they are showing lower and lower tops, technically trending lower. I'd like to see those declining tops trendlines broken.
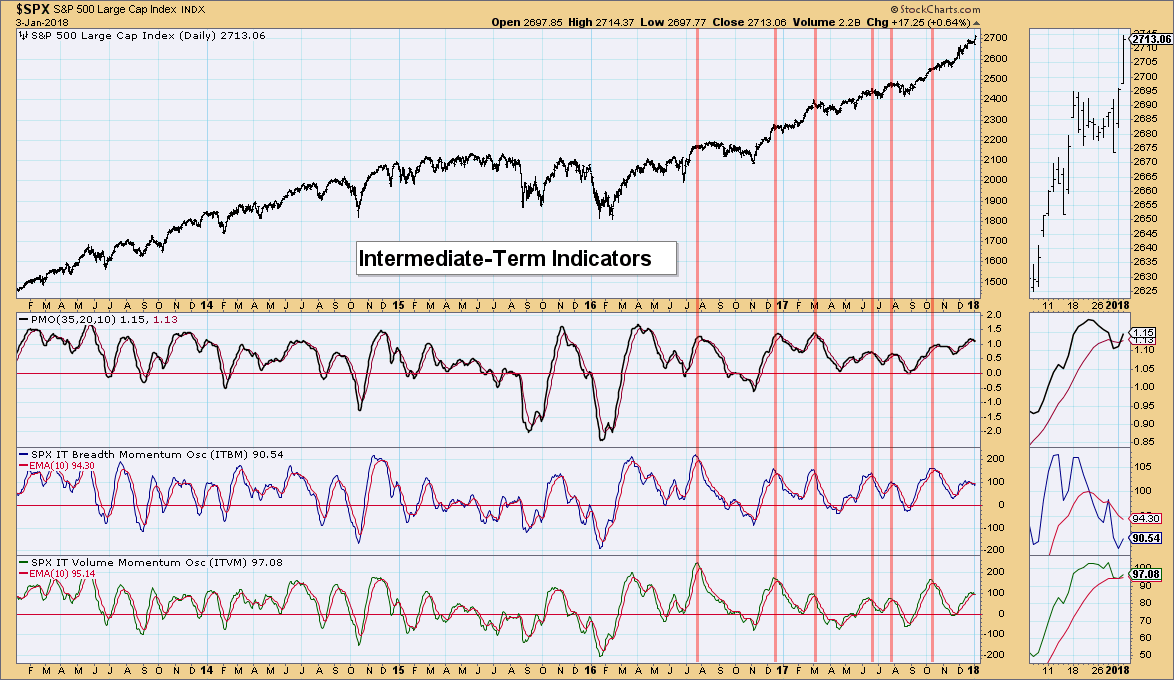
Intermediate-Term Indicators: We're seeing a lot of indecision on these indicators but they are rising for the moment. We need to see the ITBM have a positive crossover. As far as seeing these indicators tick up today...As Shania Twain sang, "That Don't Impress Me Much".
Conclusion: Indicators are not confirming this breakout to new all-time highs just yet. The PMO BUY signals and positively configured EMAs proclaim the SPX is in a strong bull market so expecting particularly bearish conclusions right now makes little sense. I was expecting the market to stay mostly flat this week and after this big rally, it likely will take a pause -- Climactic Indicators support this.
DOLLAR
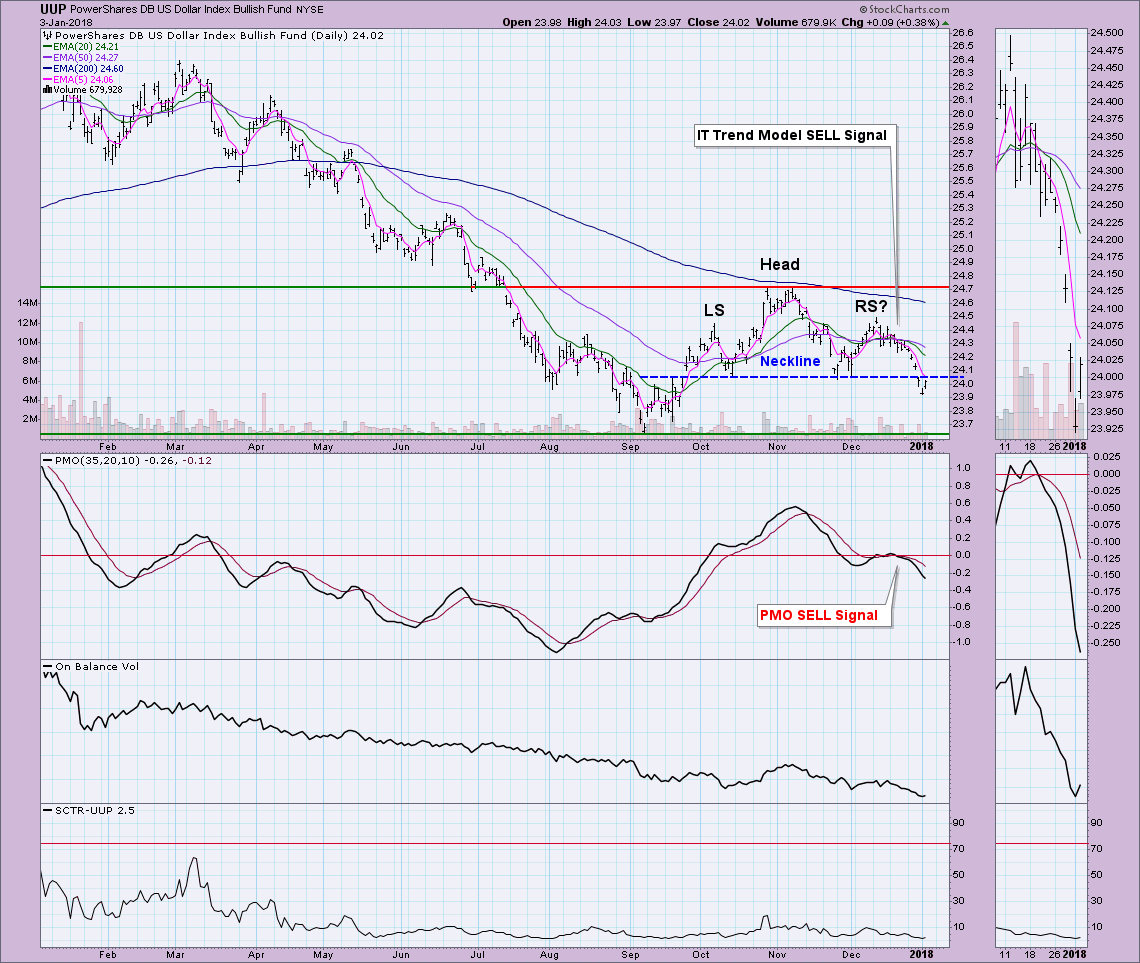
IT Trend Model: SELL as of 12/21/2017
LT Trend Model: SELL as of 05/24/2017
The head and shoulders has executed with the move below the neckline. Today saw a rally to that breakdown point, but I don't expect it to go much higher. Today was likely a reactionary bounce after the original breakdown last week.
GOLD
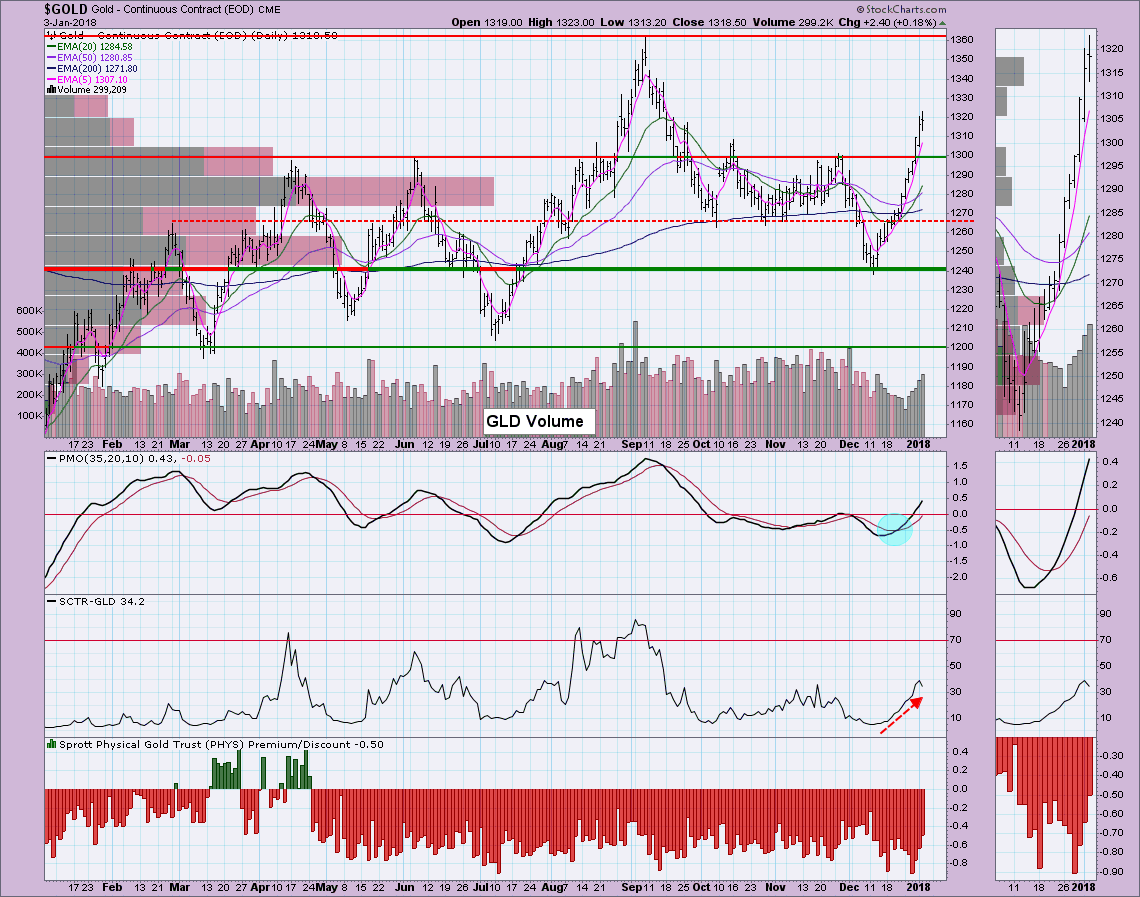
IT Trend Model: BUY as of 1/2/2018
LT Trend Model: BUY as of 4/12/2017
Yesterday's new IT Trend Model BUY signal confirmed the new nearly vertical rally should hold up. My expectation given the parabolic shape of this rally, is a drop toward support around 1300. The slight drop of the SCTR for GLD and the lessening of discounts could be hinting at that pullback to come.
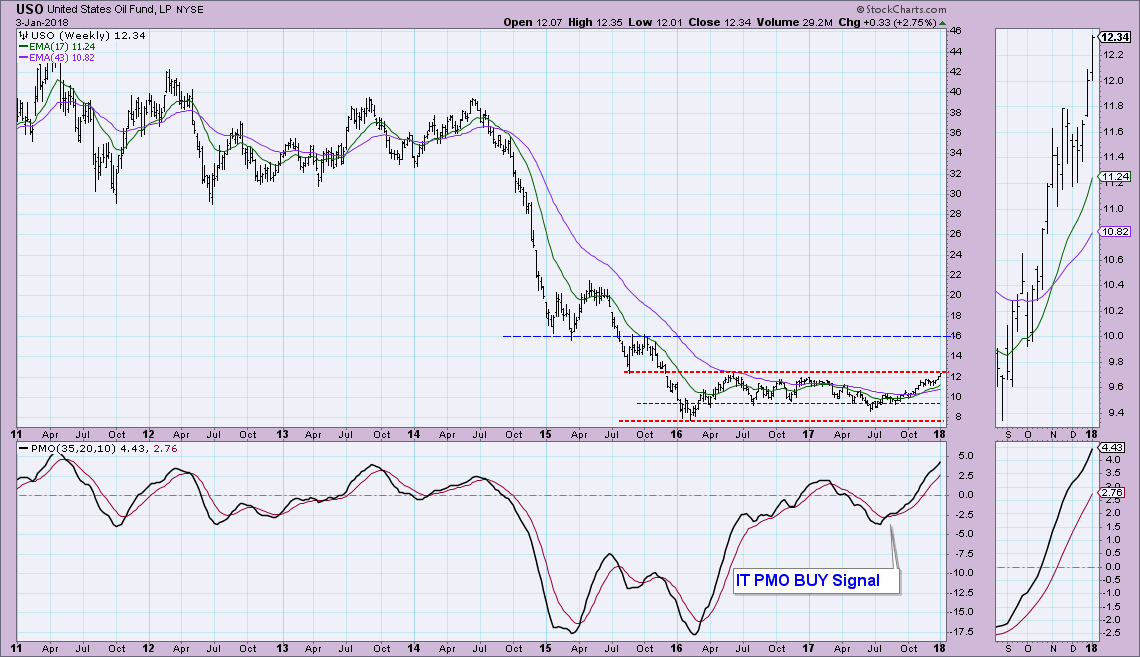
CRUDE OIL (USO)
IT Trend Model: BUY as of 11/2/2017
LT Trend Model: BUY as of 9/7/2017
I think the weekly chart best describes what is going on in Oil. The slow and steady rally that began mid-year for USO has now reached long-term overhead resistance. The "normal" range for the weekly PMO is 5 to -5, so technically the PMO is overbought. However, as 2015 and 2016 showed, the PMO can stretch out in unusual price moves. USO has managed one week of a close above $12 and this week is shaping up for more of the same. Also notice this is the first time we've seen the 17-week EMA sustain above the 43-week EMA. I think this is finally the time this trading range will be broken.
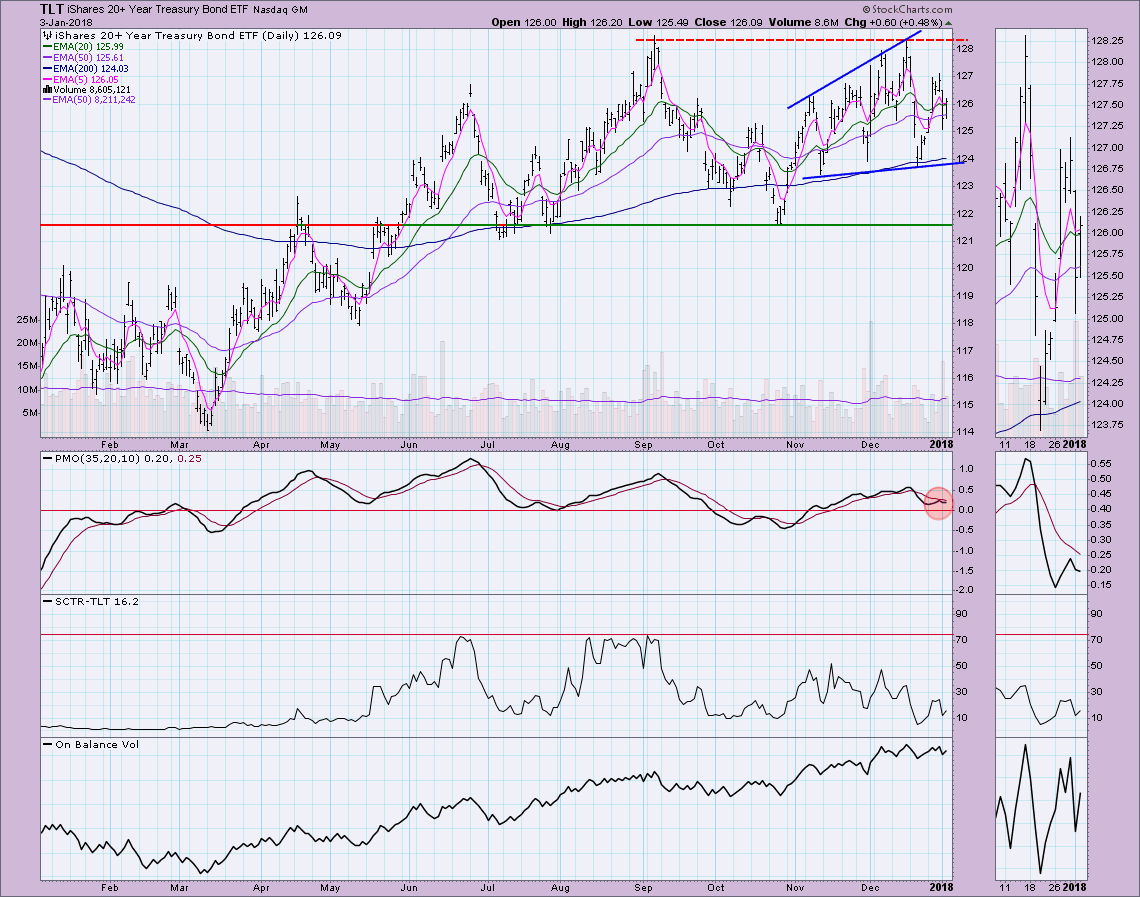
BONDS (TLT)
IT Trend Model: BUY as of 11/8/2017
LT Trend Model: BUY as of 6/16/2017
Nothing new to report. This broadening formation is bearish. The PMO topping below its signal line is especially bearish.
Helpful DecisionPoint Links:
DecisionPoint Shared ChartList and DecisionPoint Chart Gallery
Price Momentum Oscillator (PMO)
Swenlin Trading Oscillators (STO-B and STO-V)
Technical Analysis is a windsock, not a crystal ball.
Happy Charting!
- Erin
**Don't miss DecisionPoint Commentary! Add your email below to be notified of new updates"**