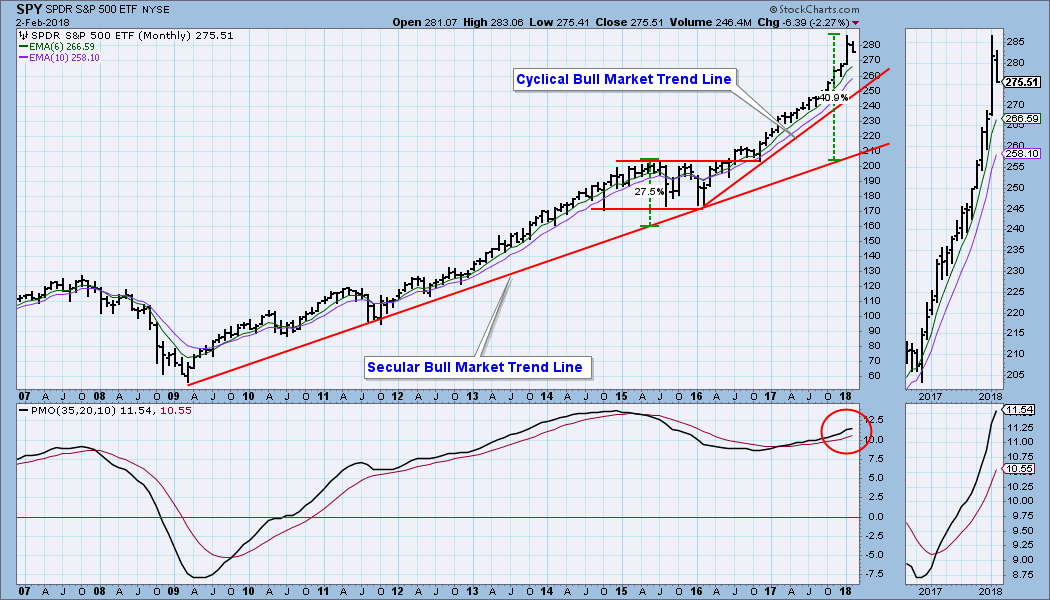
Because the DP Weekly Wrap is a recap of the week just ended, I normally lead with a daily chart; however, since there is so much agony being expressed about this week's correction, I am leading with a monthly chart to try to put things in proper perspective. Note that in 2015 price departed from the secular bull market rising trend line by +27%. To correct that excess the market moved sideways into the 2016 low, and then the cyclical bull market began. By the end of last month price had departed from the secular bull market trend line by +40%, which is certainly a good definition of excess. A significant amount of correction will be needed to set that right.
The DecisionPoint Weekly Wrap presents an end-of-week assessment of the trend and condition of the stock market (S&P 500), the U.S. Dollar, Gold, Crude Oil, and Bonds.
STOCKS
IT Trend Model: BUY as of 11/15/2016
LT Trend Model: BUY as of 4/1/2016
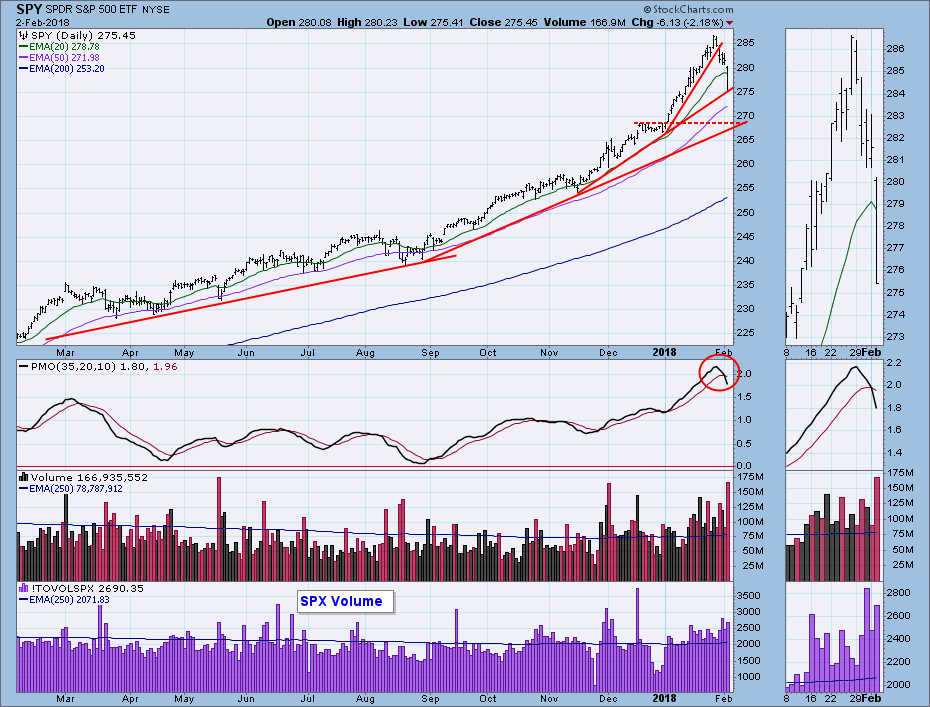
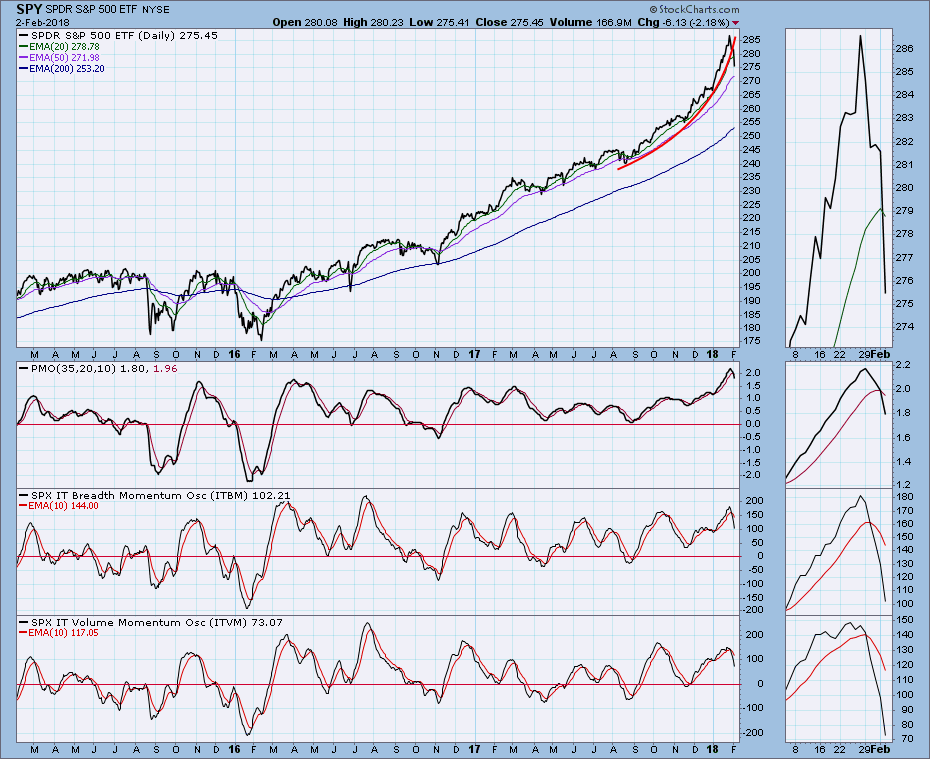
Daily Chart: For the last year, the market has been advancing on ever-steepening rising trend lines. In January the angle of ascent became ridiculously steep, and I commented more than once that it was unsustainable. This week price finally broke down through the trend line, and miracle of miracles, the market did not immediately recover. Rather it consolidated below the recently failed support line for two days, then extended the decline on Friday. Note that the recent daily PMO top was prescient, and the PMO crossed down through the signal line. I extended the previous rising trend line, and coincidentally the market found support on that line. The next support is the horizontal line drawn across the top of the December consolidation, which coincides with the next trend line extension.
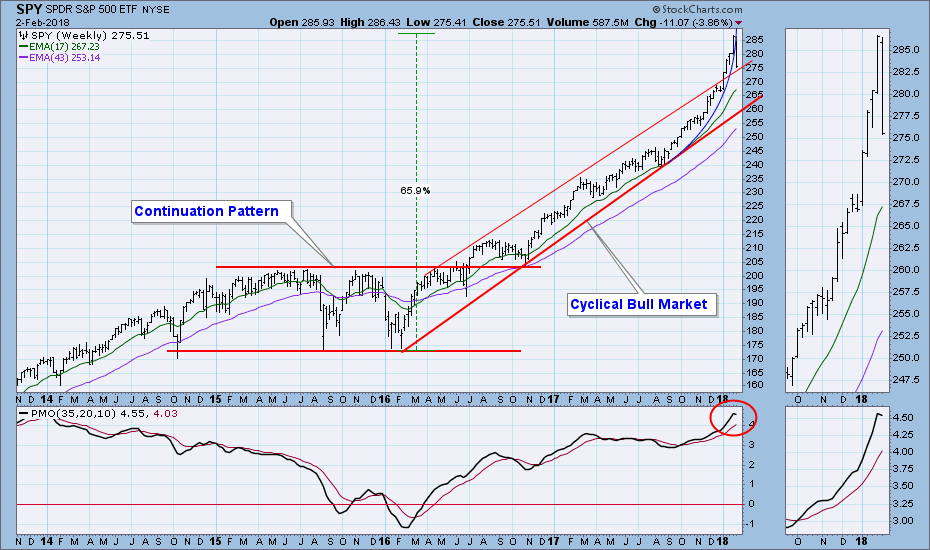
Weekly Chart: The cyclical bull market, while aggressive, was contained within a rising trend channel until last month, when it arced up through the top of the rising trend channel. This week price broke down through the parabolic arc, and the next obvious support is the top of the channel. The the very overbought weekly PMO topped on Friday.
Short-Term Market Indicators: The market is very oversold in this time frame, and these low readings could generate a bounce next week.
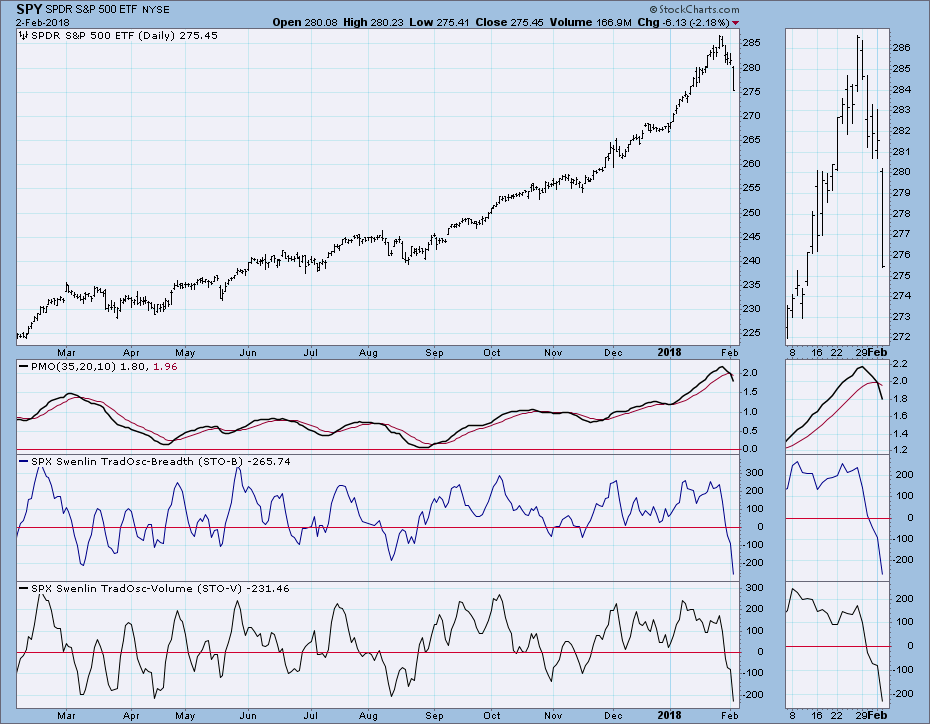
Intermediate-Term Market Indicators: There is plenty of room and technical justification here to expect much lower prices before the indicators are oversold.
Conclusion: The title of this article is Inadequate Correction, which may sound a bit out-of-touch considering a that the Dow was down -2.5% today, and SPY was down -4% for the week. But the lead chart above shows that the market was +40% above the secular bull market rising trend line, and this week's damage was inadequate in regard to correcting that excess. It would take a decline of -30% from the all-time high to get the market back on the secular trend line. I'm not predicting that outcome, but it does sound like a reasonable size for a cyclical bear market. Again, not predicting that, but it is one possible outcome.
The main point I would like to make is that the character of the market changed this week. For more than a year a one- or two-day decline was considered an opportunity to "buy the dip." This week buyers failed to materialize even after a -4% decline. That doesn't mean that market character has changed from bull to bear, but at the very least it has changed from super bullish to normal bullish.
On the basis of the daily PMO forming a top, my expectation is that the market will continue to correct for another month or so. The horizontal support line on the daily chart would be a good downside target for starters -- about 2700 for the S&P 500. That doesn't seem very far down, does it? It isn't if price goes straight down, but it could take several weeks for a volatile or meandering decline to get there.
DOLLAR (UUP)
IT Trend Model: SELL as of 12/21/2017
LT Trend Model: SELL as of 5/24/2017
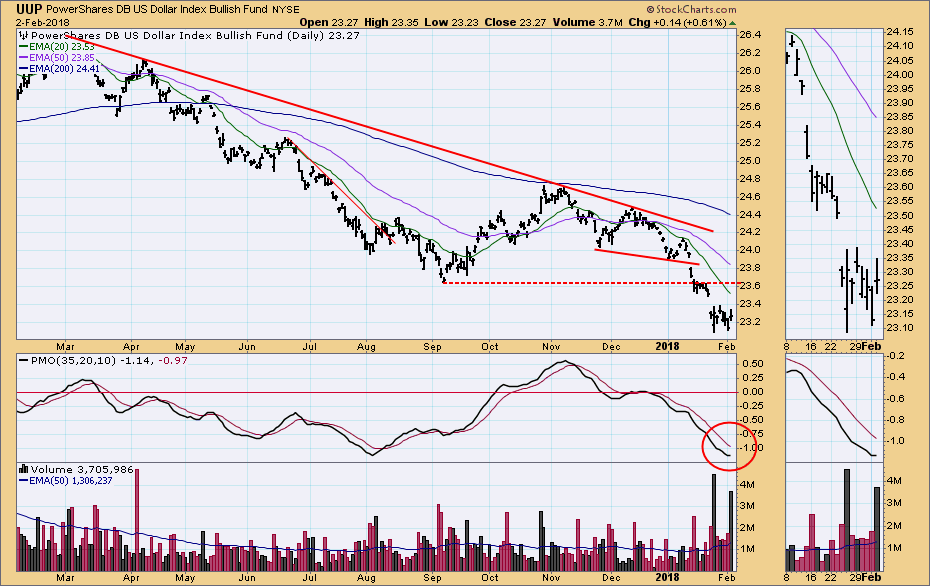
Daily Chart: UUP has formed a short-term double bottom, and the oversold daily PMO has bottomed. The double bottom upside projection suggests a possible return to the point of breakdown.
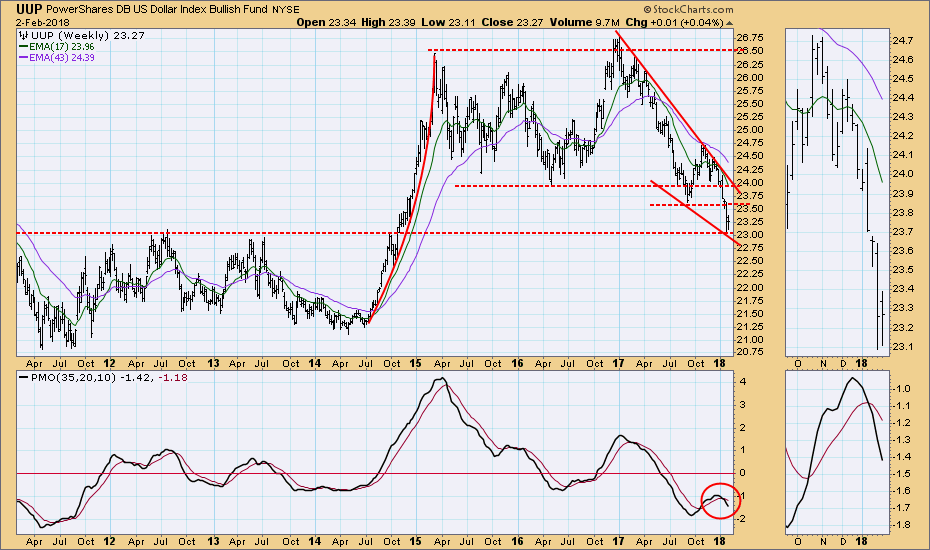
Weekly Chart: In this time frame UUP has bounced off long-term horizontal support, and a large falling wedge has formed. These are bullish signs on a bearish chart.
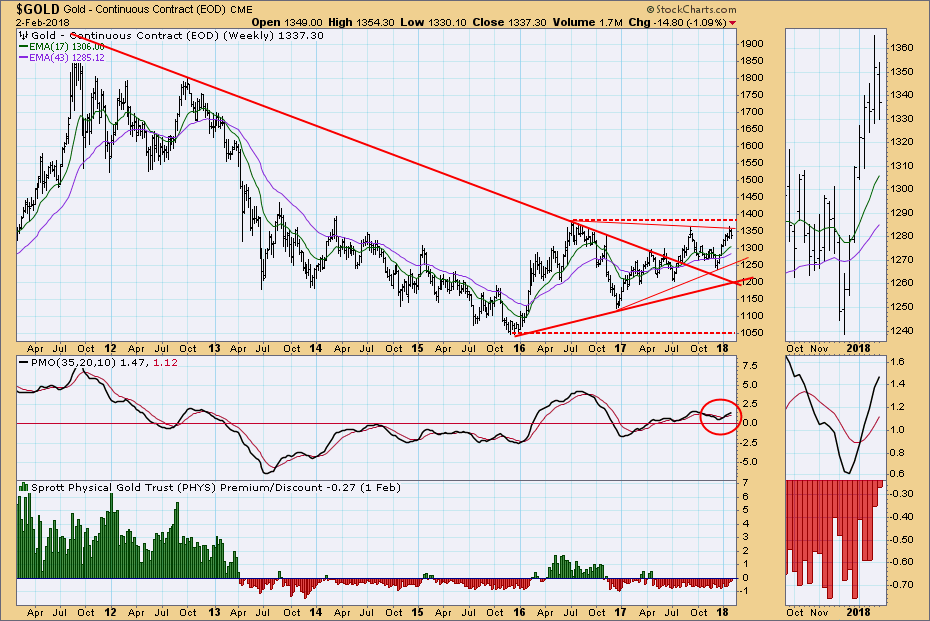
GOLD
IT Trend Model: BUY as of 1/2/2018
LT Trend Model: BUY as of 4/12/2017
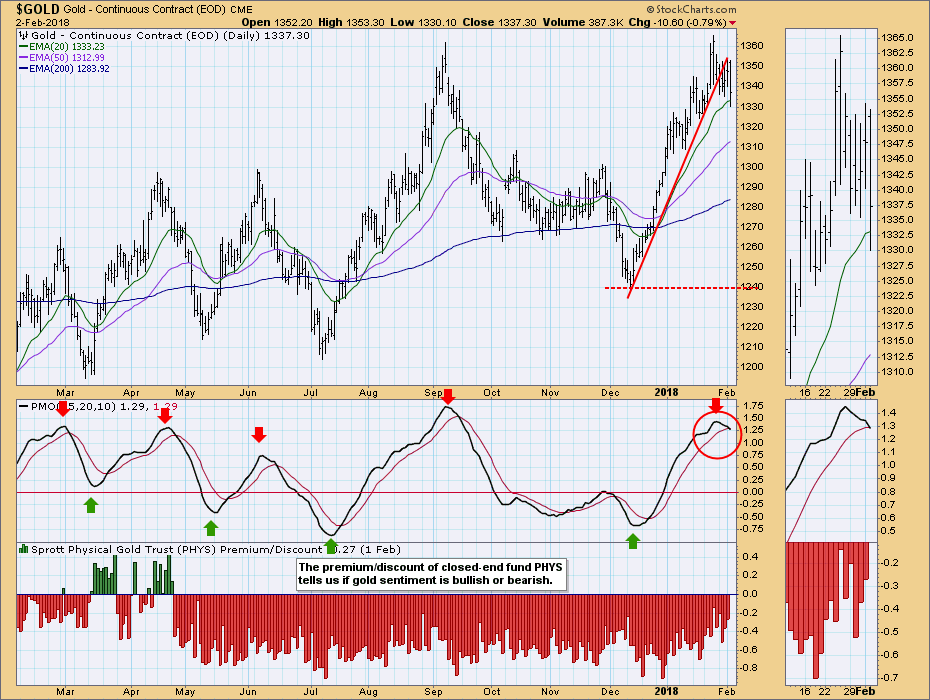
Daily Chart: Last week the overbought daily PMO topped, and I assumed that we would see another pullback in gold. This week gold broke the rising trend line and continued to roll over. It looks as if 1240 would make a reasonable downside target. We should note that gold is struggling in spite of weakness in the dollar. That is not good news.
Weekly Chart: Since the 2016 bear market low, gold has been moving sideways to slightly higher. It is bullish, but not robustly so.
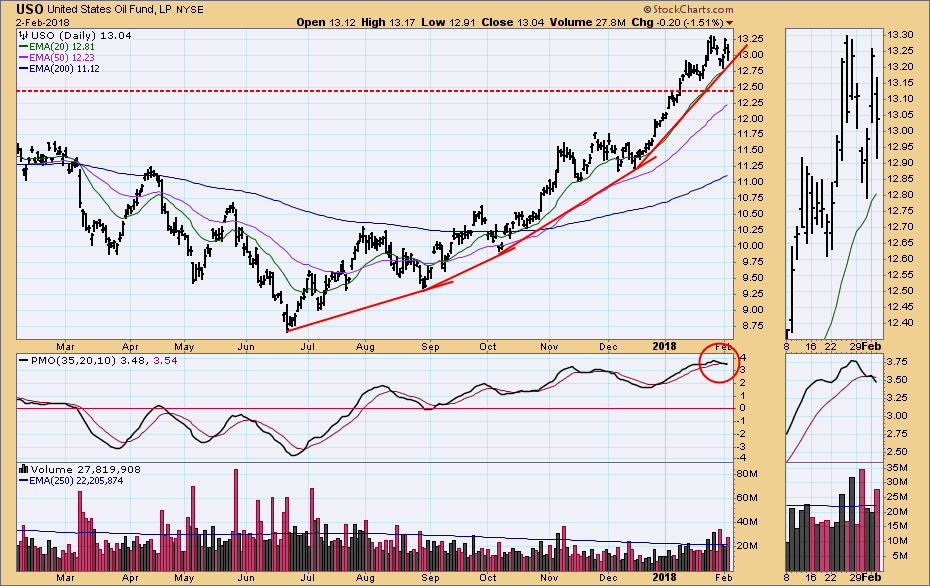
CRUDE OIL (USO)
IT Trend Model: BUY as of 9/6/2017
LT Trend Model: BUY as of 11/2/2017
Daily Chart: USO has begun to move sideways, and the daily PMO has topped and crossed down through the signal line. A retest of the support at 12.50 is possible.
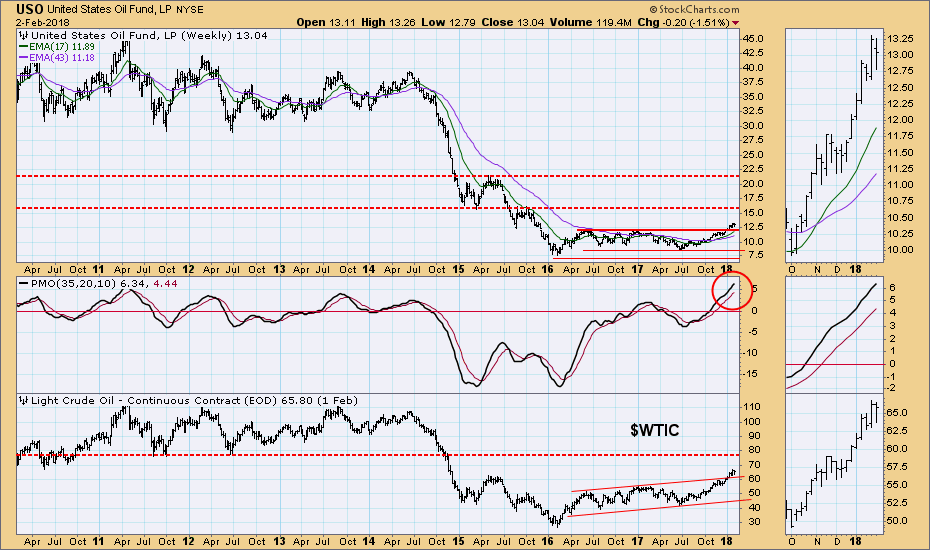
Weekly Chart: The next resistance for $WTIC appears to be about 77.00, and the comparable resistance for USO is at about 15.50. The weekly PMO is becoming overbought.
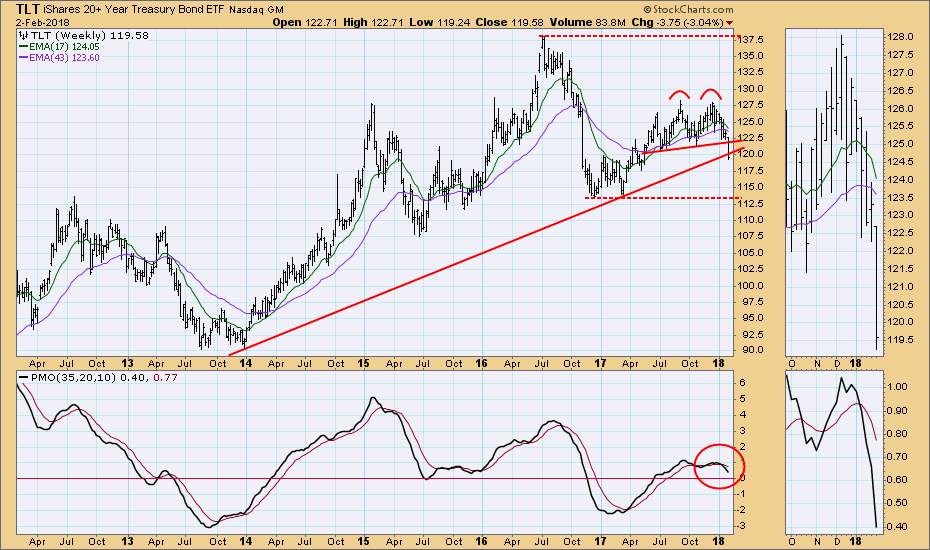
BONDS (TLT)
IT Trend Model: NEUTRAL as of 1/11/2018
LT Trend Model: BUY as of 6/16/2017
Daily Chart: This week TLT broke down through the double top confirmation line. I have marked the minimum downside target, projected as the distance from the double top to the confirmation line. We need to look at the weekly chart to see where support might actually come into play.
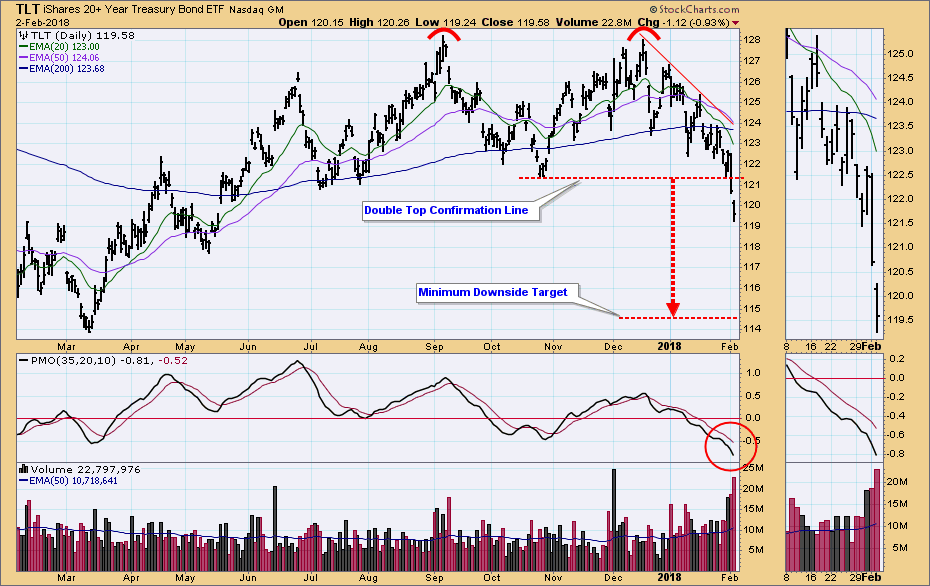
Weekly Chart: In this time frame we can see that a four-year rising trend line has been violated, and the weekly PMO is accelerating downward. The next obvious support is at around 113.00.
**Don't miss any of the DecisionPoint commentaries! Go to the "Notify Me" box toward the end of this blog page to be notified as soon as they are published.**
Technical Analysis is a windsock, not a crystal ball.
Happy Charting!
- Carl
NOTE: The signal status reported herein is based upon mechanical trading model signals, specifically, the DecisionPoint Trend Model. They define the implied bias of the price index based upon moving average relationships, but they do not necessarily call for a specific action. They are information flags that should prompt chart review. Further, they do not call for continuous buying or selling during the life of the signal. For example, a BUY signal will probably (but not necessarily) return the best results if action is taken soon after the signal is generated. Additional opportunities for buying may be found as price zigzags higher, but the trader must look for optimum entry points. Conversely, exit points to preserve gains (or minimize losses) may be evident before the model mechanically closes the signal.
Helpful DecisionPoint Links:
DecisionPoint Shared ChartList and DecisionPoint Chart Gallery
Price Momentum Oscillator (PMO)
Swenlin Trading Oscillators (STO-B and STO-V)