Last week I asserted that the character of the market had changed from super bullish to normal bullish, by which I meant that we should start to see more normal bull market corrections. On Monday I quickly revised that opinion and told Erin that I thought we may have entered a bear market. It is, of course, too early to have long-term technical confirmation of a bear market, but it is not too early to anticipate that bearish outcomes will be a lot more likely than we have seen in the prior two years. The last two weeks have provided plenty of evidence in this regard.
The DecisionPoint Weekly Wrap presents an end-of-week assessment of the trend and condition of the stock market (S&P 500), the U.S. Dollar, Gold, Crude Oil, and Bonds.
STOCKS
IT Trend Model: BUY as of 11/15/2016
LT Trend Model: BUY as of 4/1/2016
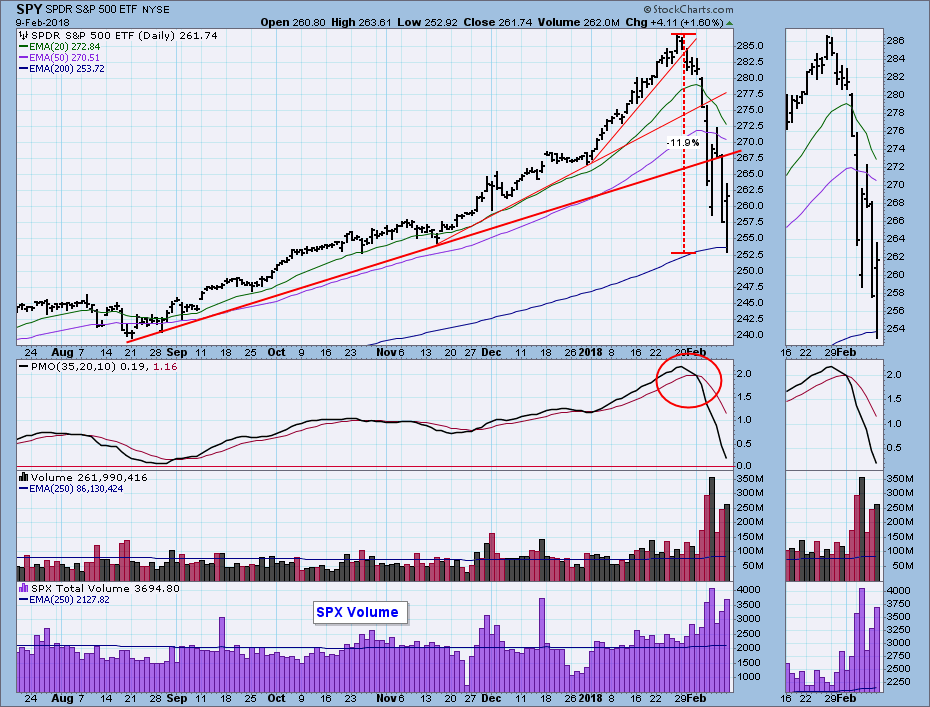
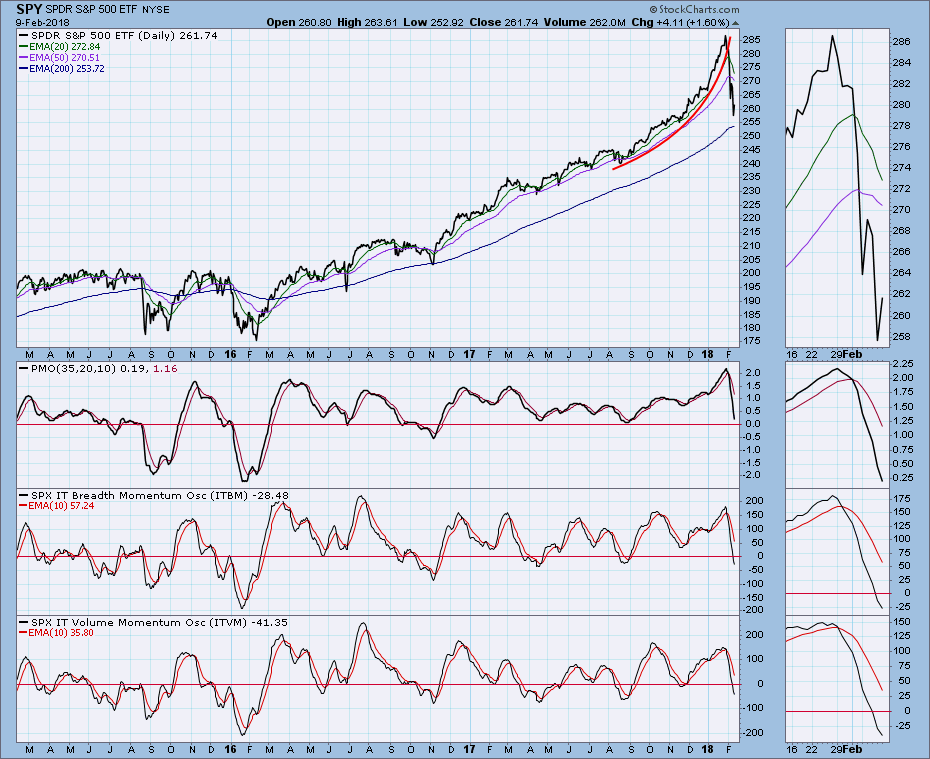
Daily Chart: Major market tops are typically rounded and gradual, which is the kind of top the Trend Models are designed to expect; however, after an extended and very steep advance, the EMAs that drive our Trend Models become unusually widely spread apart, and the sharp decline left the Models standing flat-footed. Specifically, we consider that a bear market begins when the 50EMA crosses down through the 200EMA, but with the current configuration of EMAs, it is going to be a long time before that crossover takes place. While the Trend Models have us officially on BUY signals, it is my opinion that a bear market has begun.
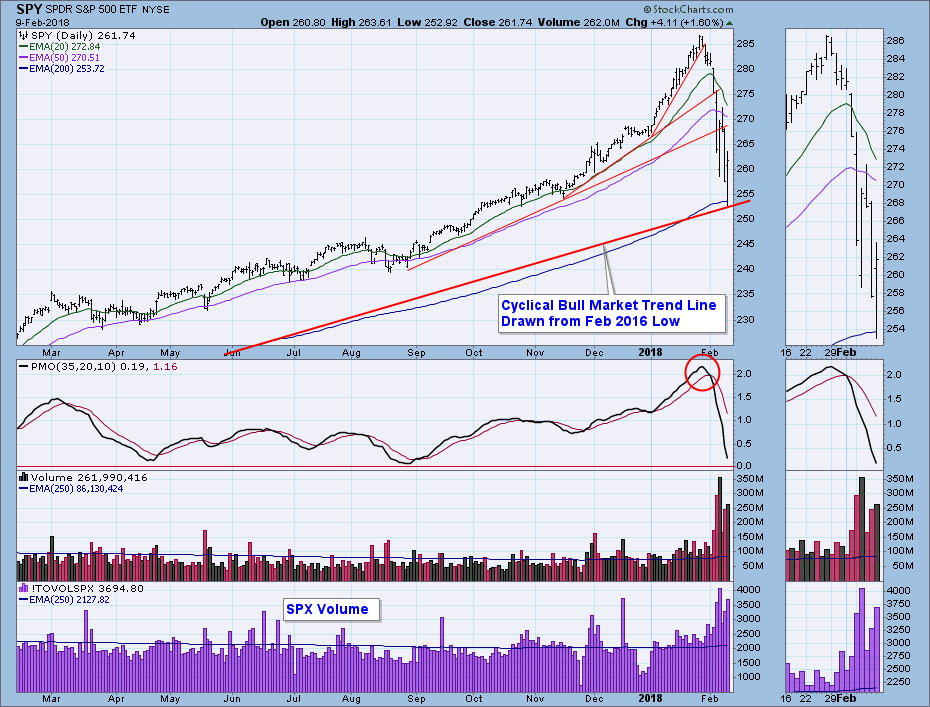
That being said, the correction has brought price all the way back to the cyclical bull market rising trend line. Assuming that we have a short-term bottom in place, I'm thinking of two possible scenarios (although there many, many more possible):
(1) One scenario is that the market will rally off a "V" bottom, trying to reach previous highs. But people will be selling into that rally, and it will fail before making new highs. The time frame for making the top is a few weeks.
(2) A better outcome would be a "W" bottom where the market rallies modestly, then rolls over for a successful retest of today's lows. It would be best for this process to take place over, say, four to six weeks, and maybe the excesses get worked out and the bull market resumes.
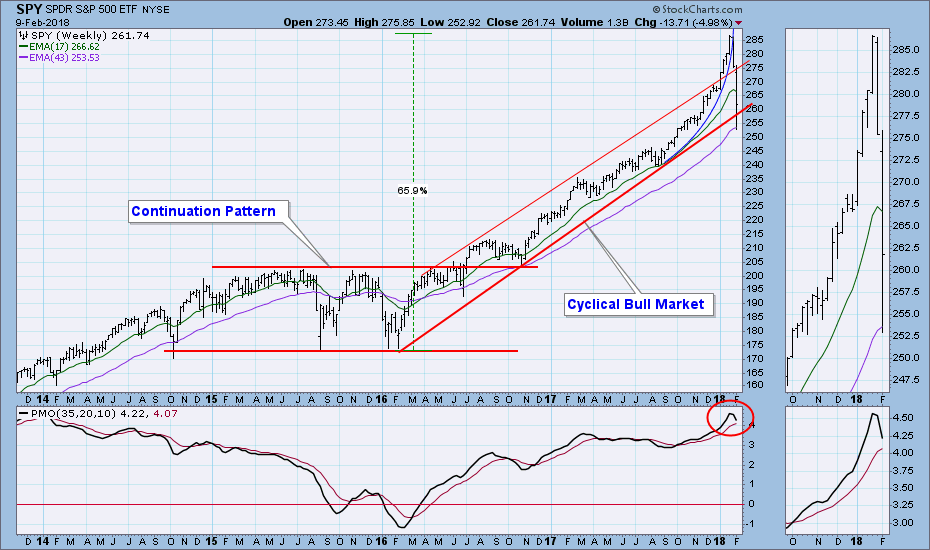
Weekly Chart: This chart provides a good example of how trend line angles can differ in different time frames. While trend line support shows on the daily chart, we can see that the trend line was violated in the weekly time frame. The weekly PMO is bearish, having topped at very overbought levels.
Short-Term Market Indicators: At -400 these indicators look very oversold, but the bottom of their range long-term is around -600.
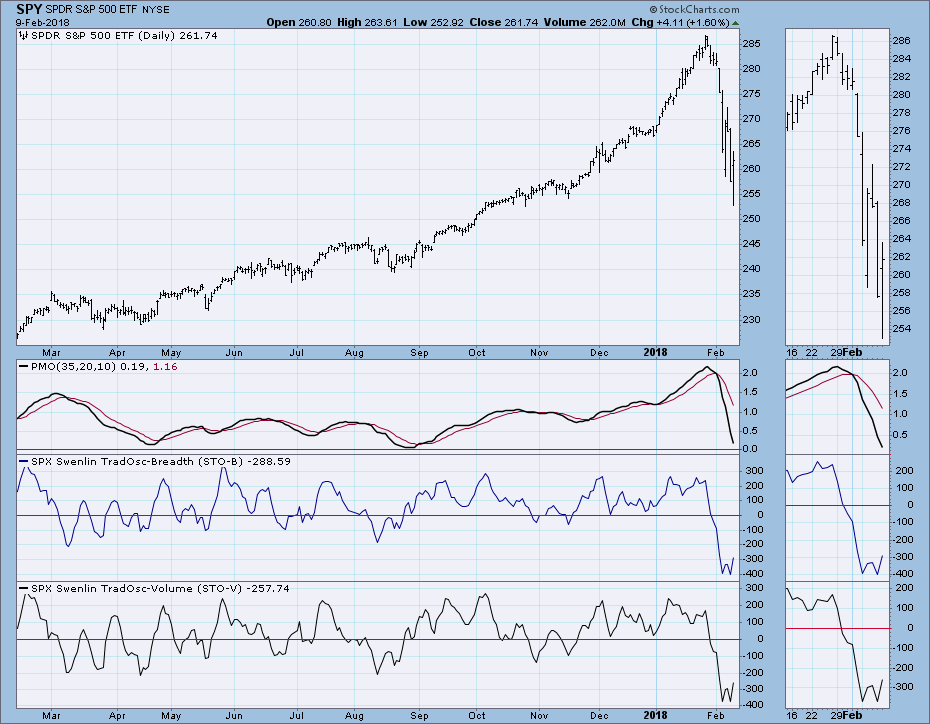
Intermediate-Term Market Indicators: They have reached bull market oversold levels. If we're in a bear market, I expect these indicators go much lower.
Conclusion: I could be wrong about us being in a bear market, but that is not important because I'm prepared to change my mind as the evidence appears. What is important is that we should consider applying some bearish bias to our analysis -- start approaching the market with the assumption that bear market rules now apply. Yes, our Models are on BUY signals, but they are wind socks. They are mechanical. So, while the wind socks show wind that is steady and straight down the runway, our brains can observe thunder storms near the airport, and can be aware that the wind may soon become dangerously gusty and variable.
Today the market found support on a long-term trend line and the 200EMA, and it appears that the selloff has abated for now. Our short-term indicators are very oversold and support the idea of a short-term bounce; however, intermediate-term indicators are not oversold enough to make me think this leg down is completed.
DOLLAR (UUP)
IT Trend Model: SELL as of 12/21/2017
LT Trend Model: SELL as of 5/24/2017
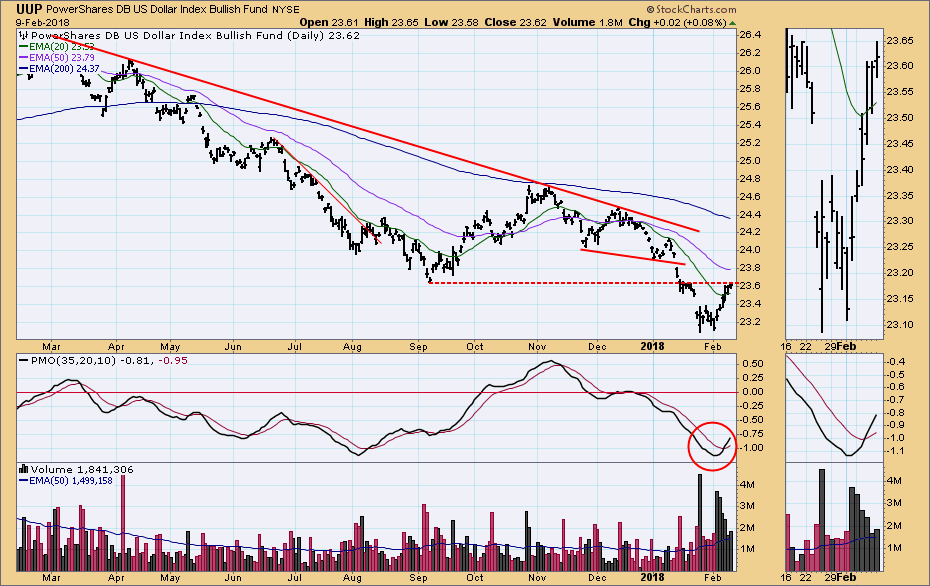
Daily Chart: The advance off a short-term double bottom has met its target right at overhead resistance. The PMO bottom normally implies that price will continue to advance, but look at the puny bounce that resulted from the PMO bottom in August of last year.
Weekly Chart: The dominant pattern in this time frame is the large falling wedge, which is bullish. Let's see if price can make it back to the top of the wedge, or if it will be stopped at the current line of resistance.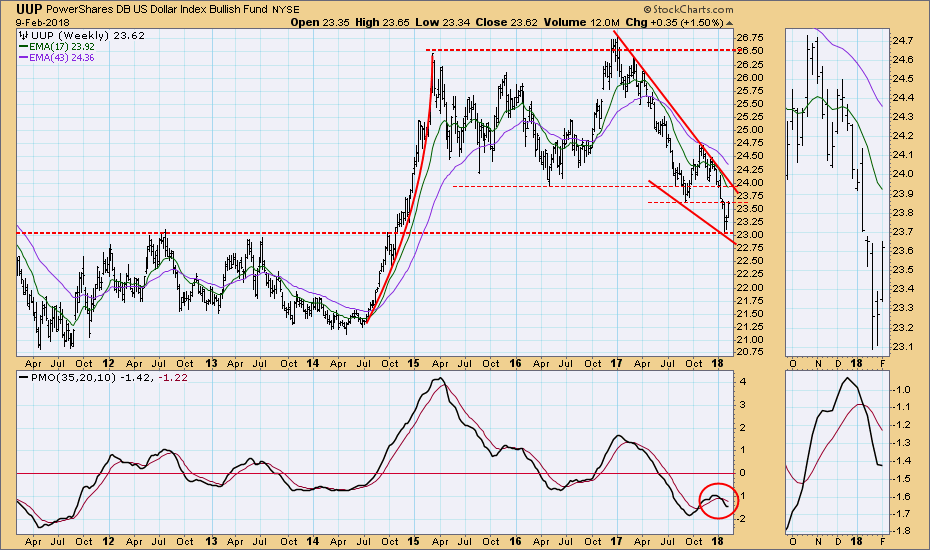
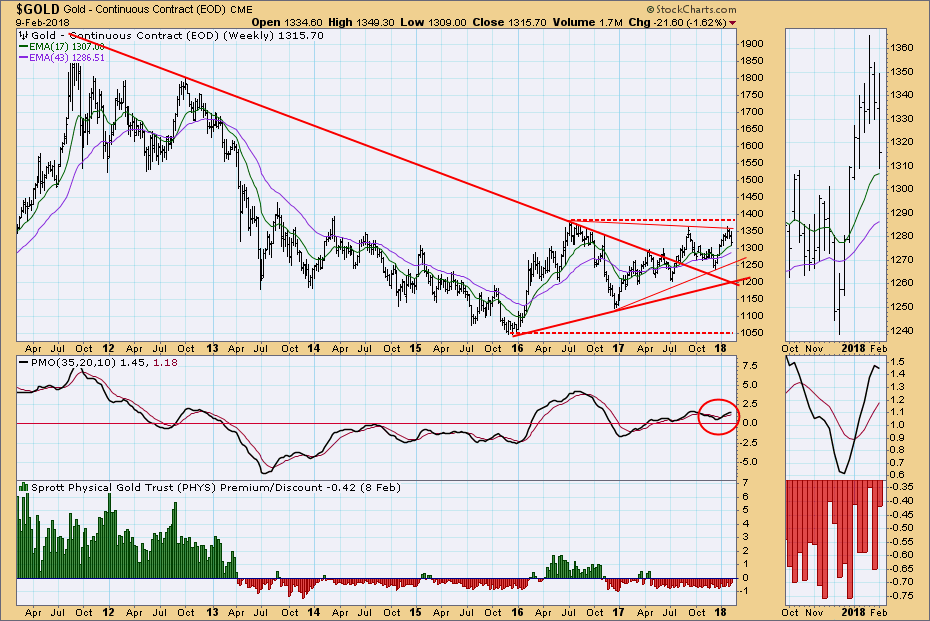
GOLD
IT Trend Model: BUY as of 1/2/2018
LT Trend Model: BUY as of 4/12/2017
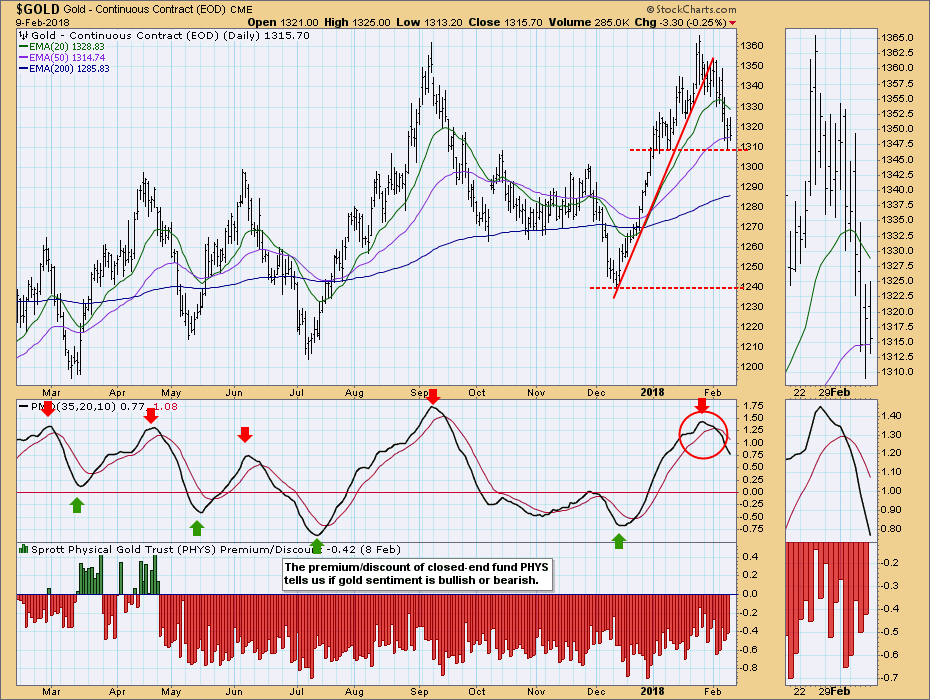
Daily Chart: Gold has found support at about 1309, and the the daily PMO is bearish. I expect price to continue downward.
Weekly Chart: The weekly PMO topped this week, but the picture remains slightly bullish.
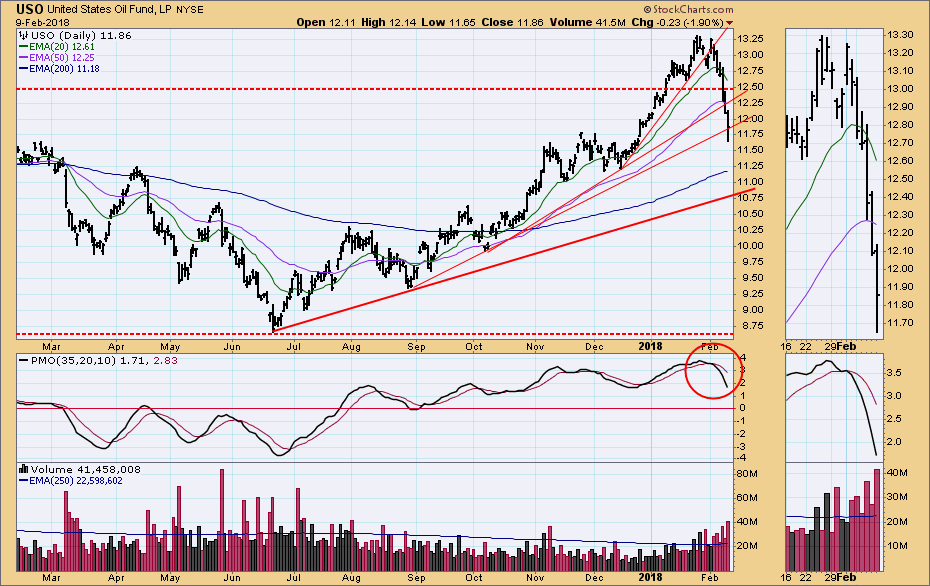
CRUDE OIL (USO)
IT Trend Model: BUY as of 9/6/2017
LT Trend Model: BUY as of 11/2/2017
Daily Chart: From the June 2017 low, USO had advanced on an ever-steepening series of rising trend lines -- a parabolic advance. The parabolic began to collapse two weeks ago, and the subsequent decline has taken out three of those trend lines. I expect the decline to continue to the bottom of the trading range.
Weekly Chart: The weekly PMO topped as the support line failed, making the picture bearish in this time frame.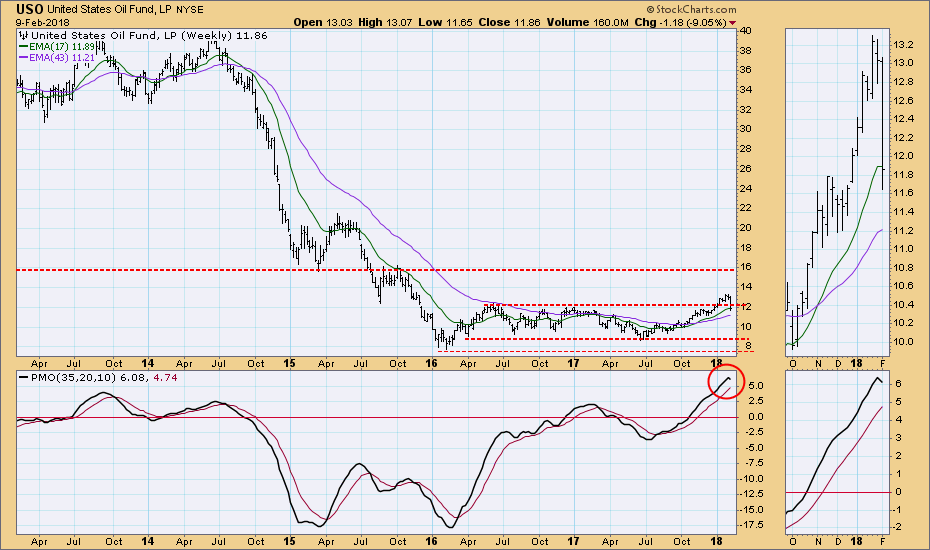
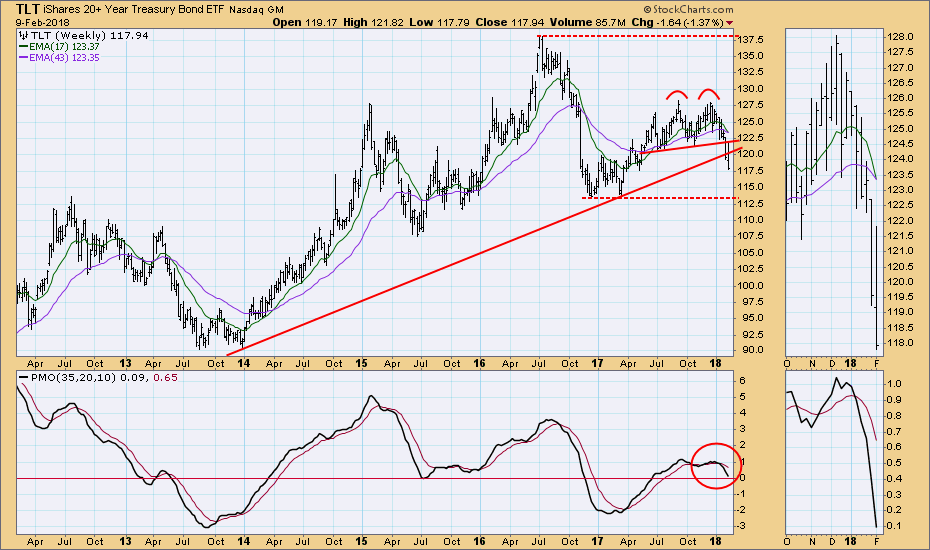
BONDS (TLT)
IT Trend Model: NEUTRAL as of 1/11/2018
LT Trend Model: SELL as of 2/8/2018
Daily Chart: This week the TLT 50EMA crossed down through the 200EMA, generating an LT Trend Model SELL signal. On the daily chart the double top breakdown continues to fulfill expectations. The horizontal support drawn across the March low is probably more realistic support than the minimum downside target.
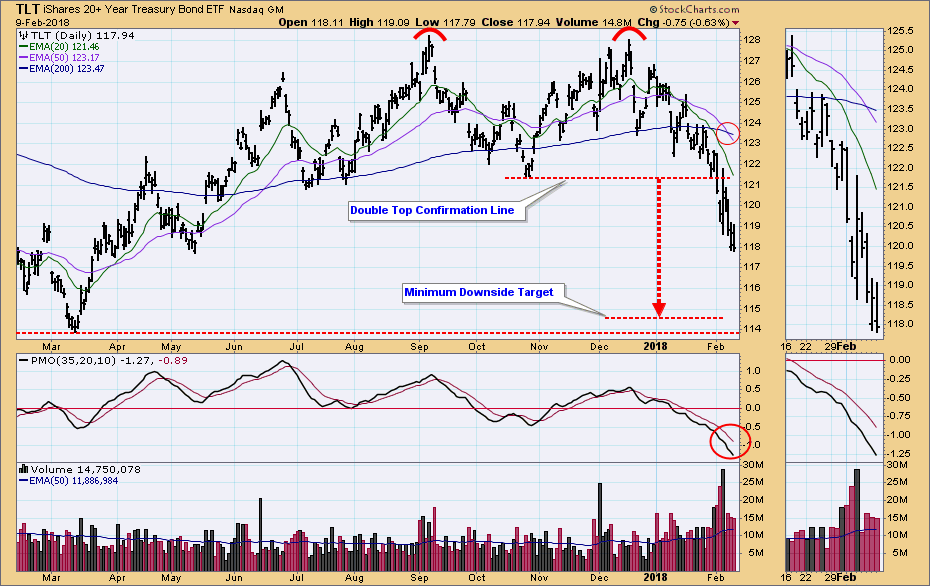
Weekly Chart: Zooming out to the longer-term, we can see that the March low is the second low in a double bottom formation, so that will be important support if the decline persists.
**Don't miss any of the DecisionPoint commentaries! Go to the "Notify Me" box toward the end of this blog page to be notified as soon as they are published.**
Technical Analysis is a windsock, not a crystal ball.
Happy Charting!
- Carl
NOTE: The signal status reported herein is based upon mechanical trading model signals, specifically, the DecisionPoint Trend Model. They define the implied bias of the price index based upon moving average relationships, but they do not necessarily call for a specific action. They are information flags that should prompt chart review. Further, they do not call for continuous buying or selling during the life of the signal. For example, a BUY signal will probably (but not necessarily) return the best results if action is taken soon after the signal is generated. Additional opportunities for buying may be found as price zigzags higher, but the trader must look for optimum entry points. Conversely, exit points to preserve gains (or minimize losses) may be evident before the model mechanically closes the signal.
Helpful DecisionPoint Links:
DecisionPoint Shared ChartList and DecisionPoint Chart Gallery
Price Momentum Oscillator (PMO)
Swenlin Trading Oscillators (STO-B and STO-V)