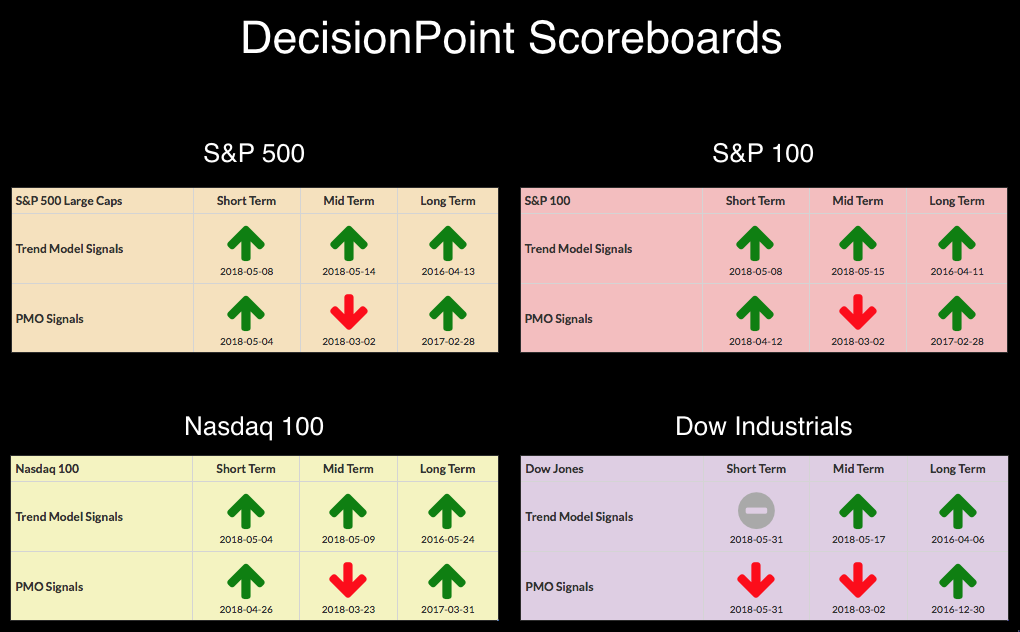
With today's close, all of the monthly charts have 'gone final'. This means that any signals that appear on monthly charts are the final signals for the month. While we don't have any new monthly/long-term signals, it is always instructional to look at these going into the next month. Below are the current DP Scoreboards. As noted, the monthly (long-term) PMOs remain on BUY signals; however, not all headings are positive. The Long-Term Trend Model signals are derived from the daily chart using the 50/200-EMA crossovers so there is no need to wait for those signals to "go final".
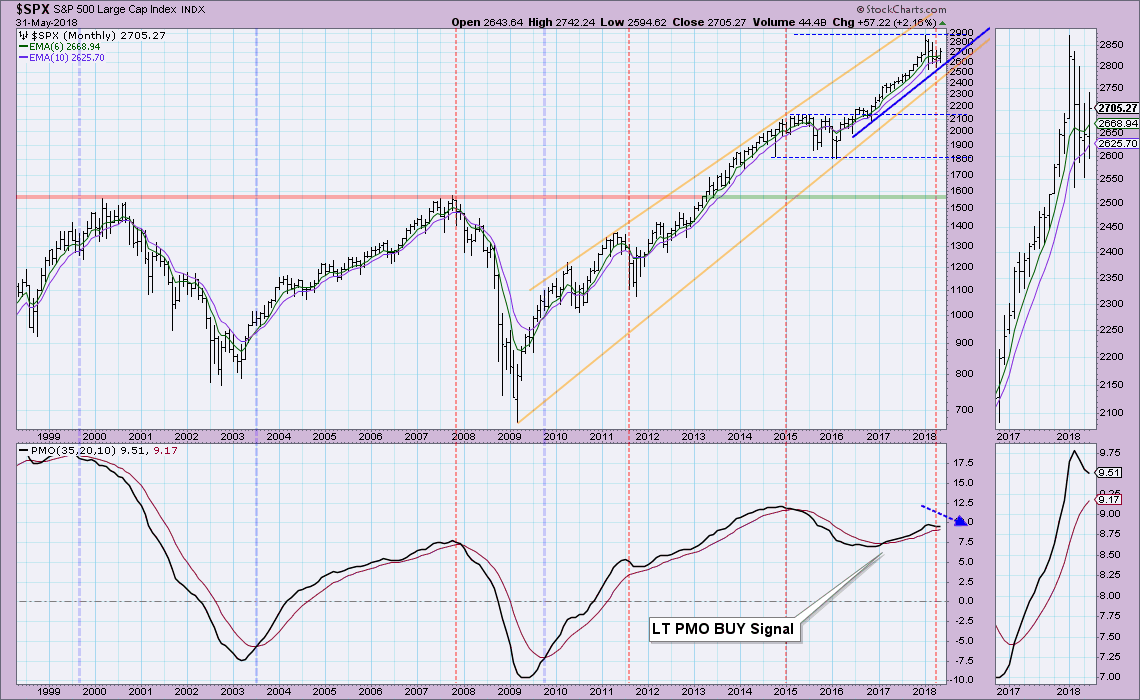
While we can still see very long-term rising wedges, I believe looking at the rising trend since 2016 is more descriptive. It's been a rough year (since February), but rising bottoms support remains intact. The monthly PMO is heading lower but it is decelerating. So while this picture may not be completely bright, if the SPX can hold that rising trend, it should be able to dig out from this year's decline.
 I decided to annotate rising trend channels on many of these monthly charts as I feel they are more revealing.On a monthly basis, the Dow is near the top of the channel. I don't like it because there is plenty of room for it to drop before the rising trend is lost. This makes the Dow vulnerable. The declining PMO is concerning.
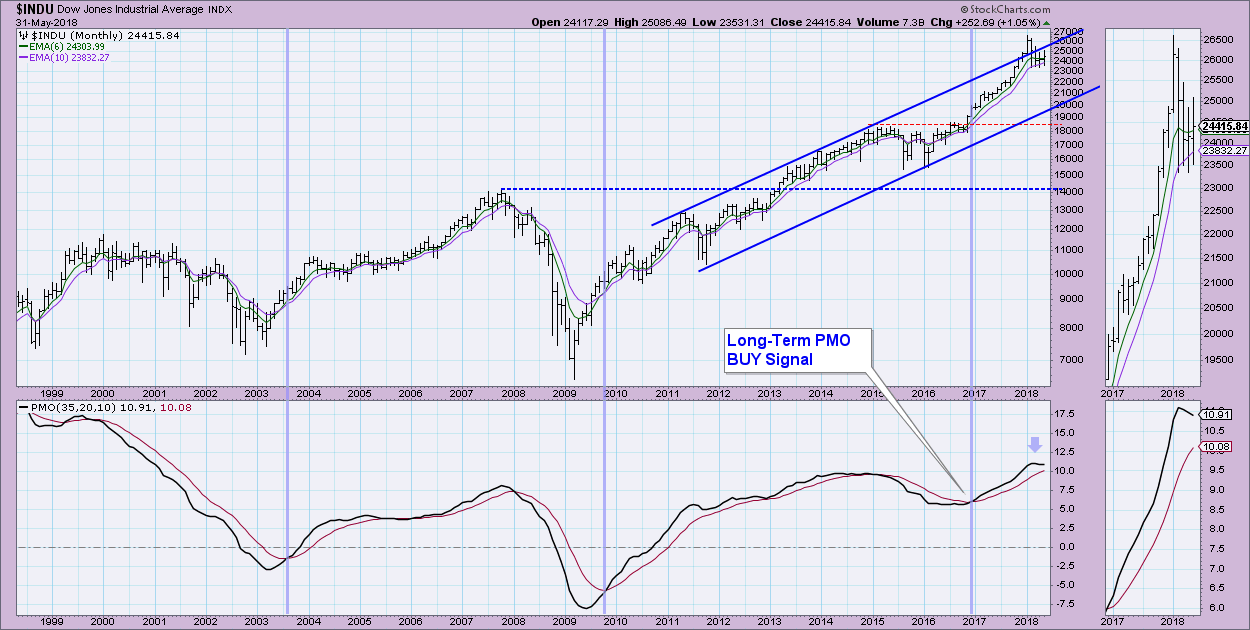 The NDX has a similar chart in that it's a long way down to the bottom of this long-term rising trend channel. The big difference is the renewed PMO which is now managing to reach above its previous top. While it is still vulnerable to a drop, the momentum shift is bullish.
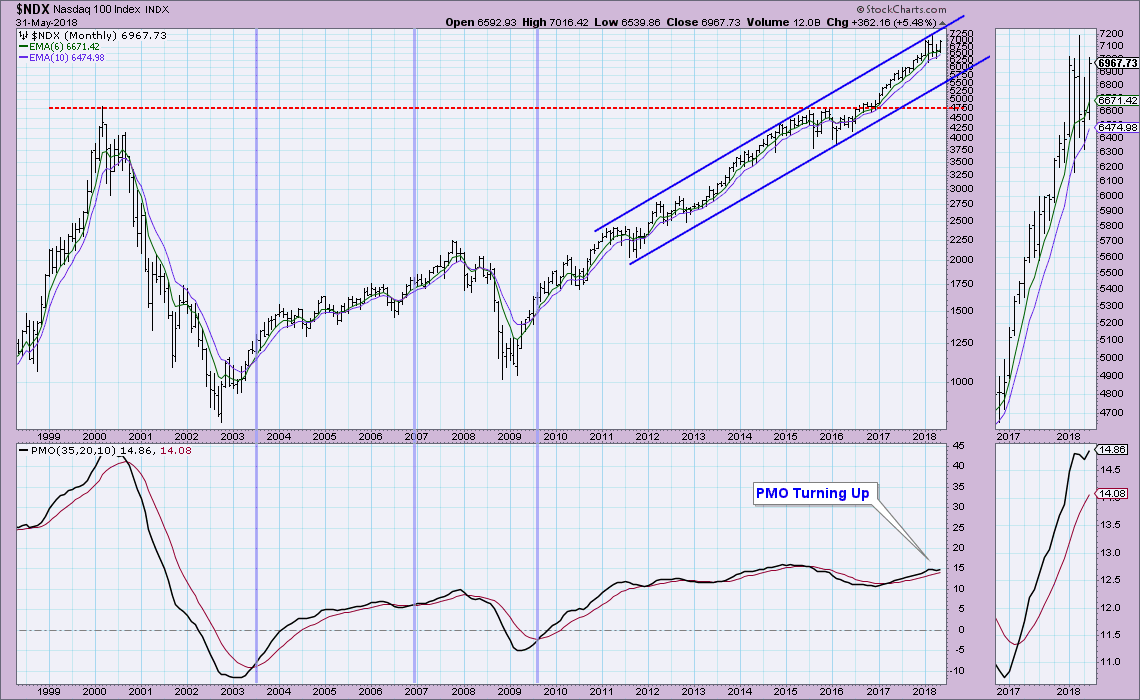 We have another rising trend channel on the OEX. In this case it is about midway inside the channel. Support is holding at 1120 and while the PMO is in decline it is also decelerating.
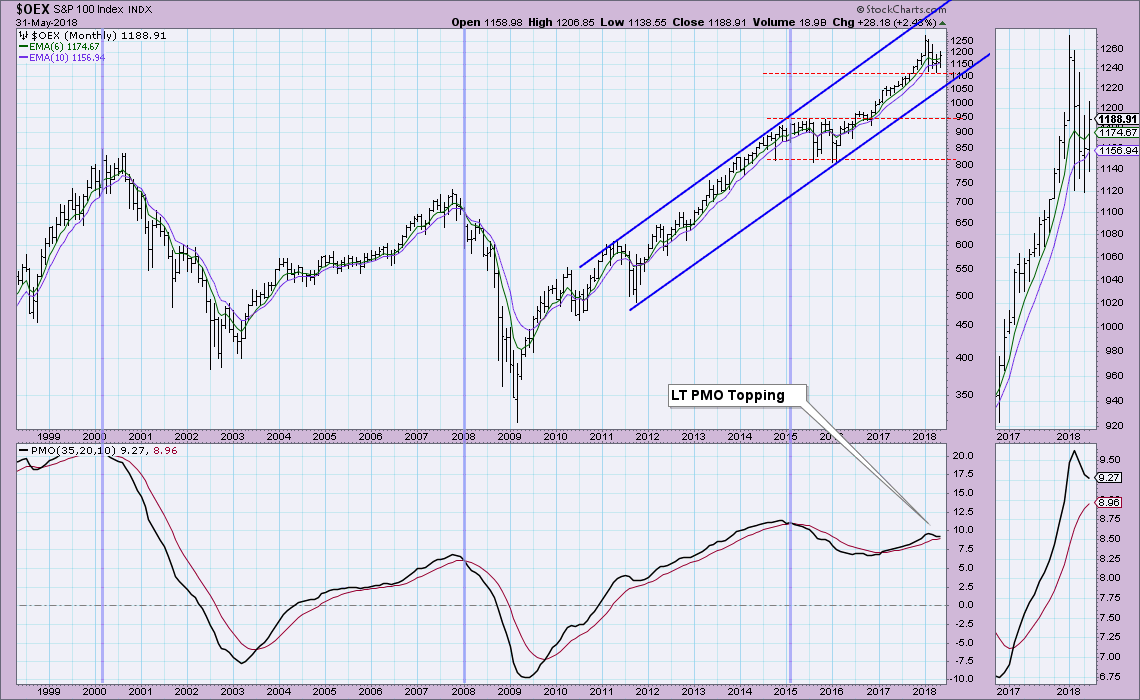 The SP400 ETF, IJH also shows a rising trend channel. The PMO is turning up, but unlike the NDX, it hasn't climbed above its previous high.
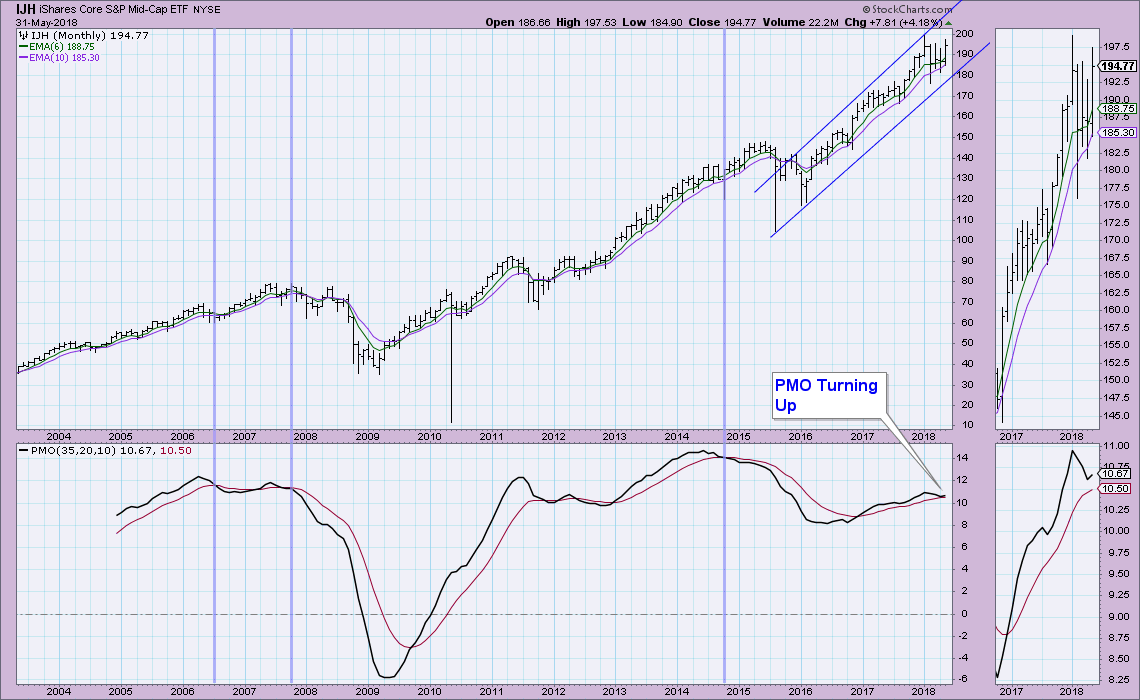 Small-caps have definitely been leading the pack. Looking at the SP600 ETF, IJR, we see a rising trend channel. But more importantly, note in the thumbnail that overhead resistance at about $80.50 was broken this month and new all-time highs were recorded. Note that the PMO has also reached above its previous top.
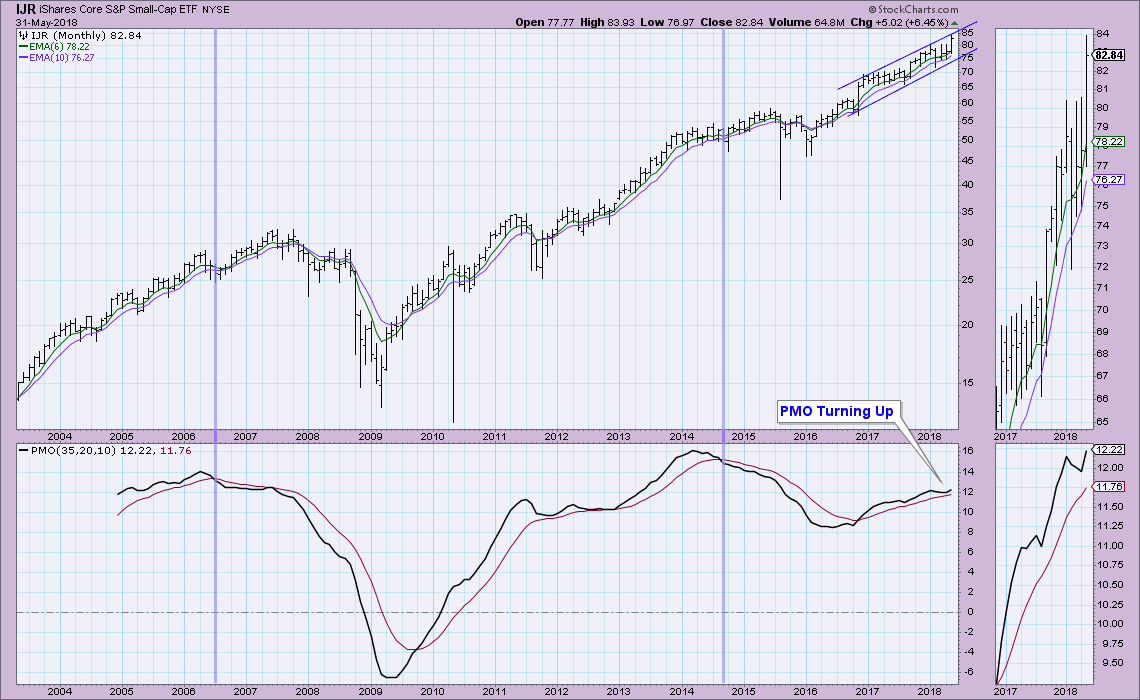 Conclusion: As far as the major markets go, the strength of the small-cap indexes is impressive. With small-cap indexes looking this good, it is hard to imagine a collapse of the large-cap indexes into a bear market, but they will likely continue to struggle against the strong winds of a rising Dollar. Overall I'm seeing positive action on the monthly PMOs, either rising or decelerating. While monthly charts aren't quite bullish enough to look for new all-time highs in the large-cap indexes in June, they are looking more healthy than last month.
Let's take a look at the "Big Four": Dollar, Gold, Oil and Bonds.
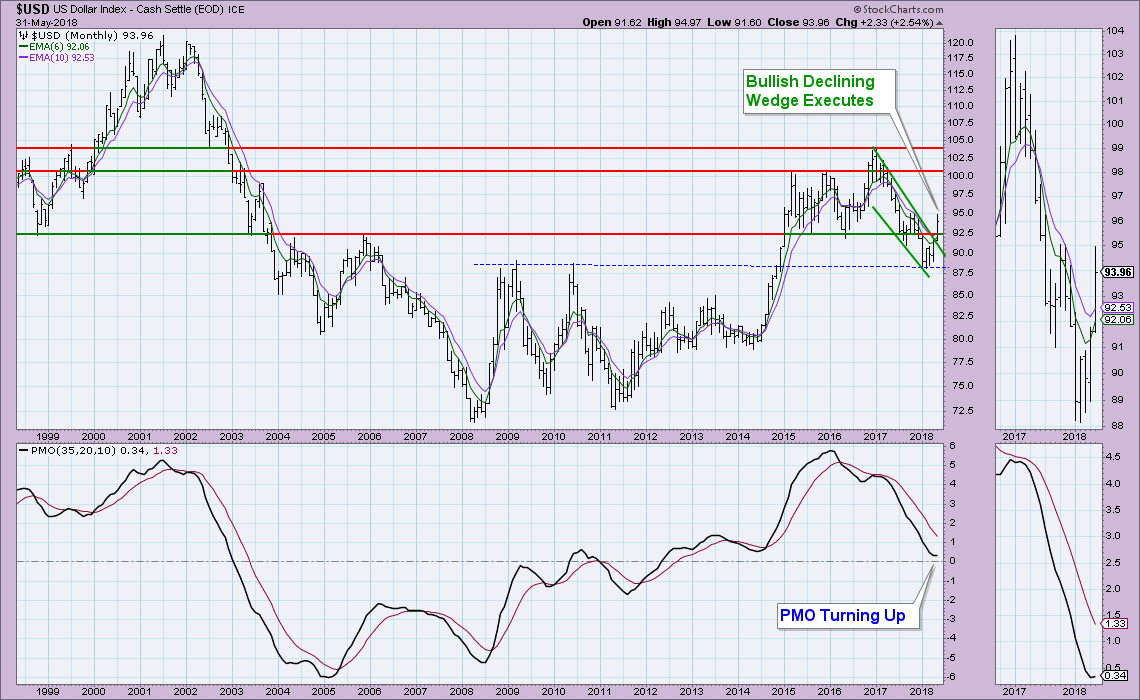
The Dollar finally exploded this month, ripping its way out of the bullish declining wedge and leap-frogging overhead resistance at 92.50. The PMO is turning up above the zero line which is bullish. This chart looks great, I'm expecting the Dollar to make its way to 100.50 in the next few months. Might see a pullback first toward the breakout point at 92.50.
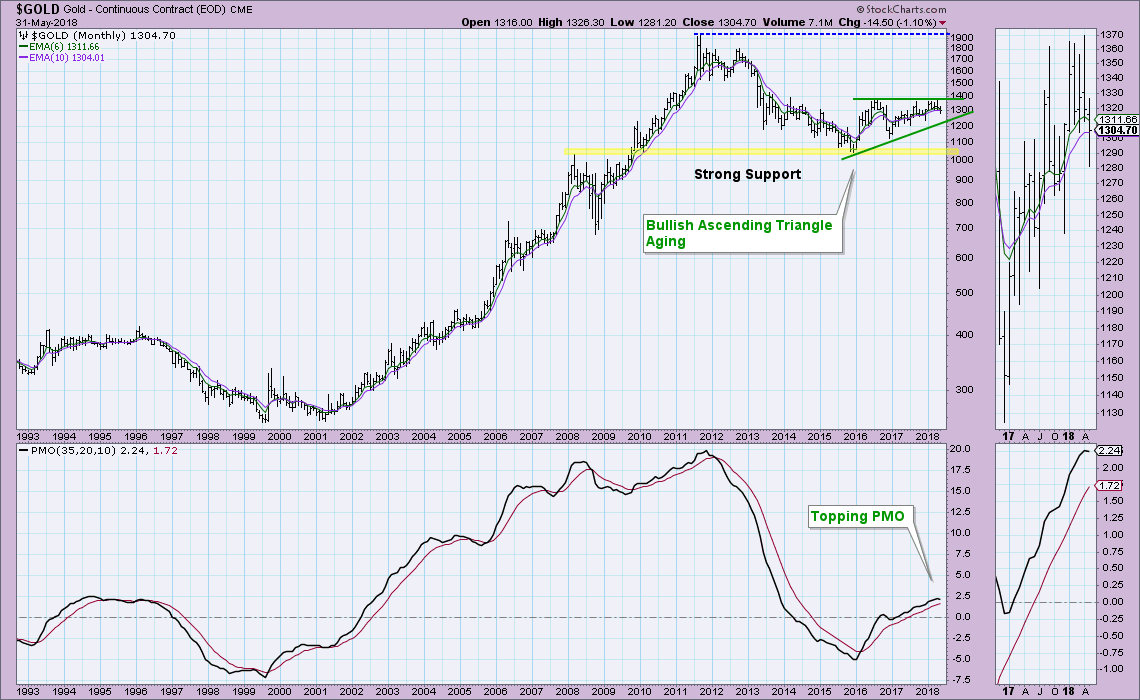
 The bullish ascending triangle is still the dominant formation on the monthly chart, but it is getting long in the tooth. Prices are getting too close to the apex, meaning they will eventually 'drift' out of the pattern which wouldn't give us a definitive signal. With the Dollar looking so bullish, I simply can't get bullish on Gold right now. I've been watching the 1310 area closely on the daily chart, as well as the correlation to the Dollar. Gold is decoupling somewhat from its correlation with the Dollar which could give Gold a chance to breakout despite a rising Dollar. However, I'm not optimistic given the new top on the PMO.
 Oil has been on a tear since the middle of 2017, leaping above resistance at $55 and heading straight for the next area of resistance at $75. The PMO is healthy and not overbought. Notice in the thumbnail that Oil closed above the highs from January - March. This may be all the pullback that is needed to push Oil up to $75 this coming month.
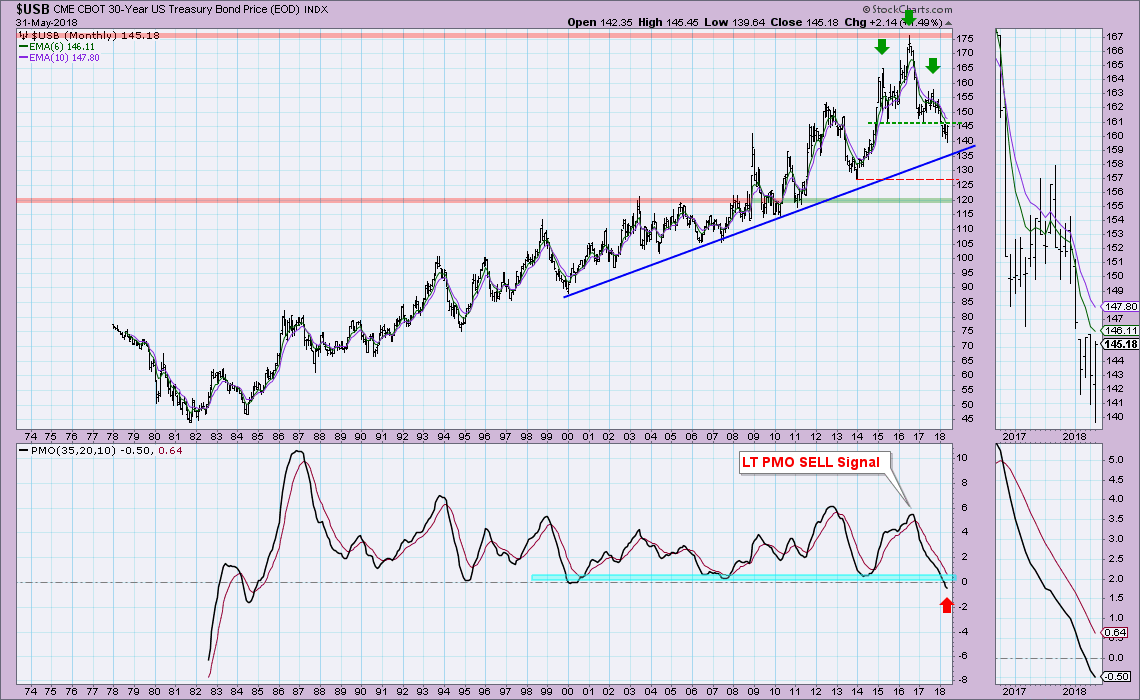
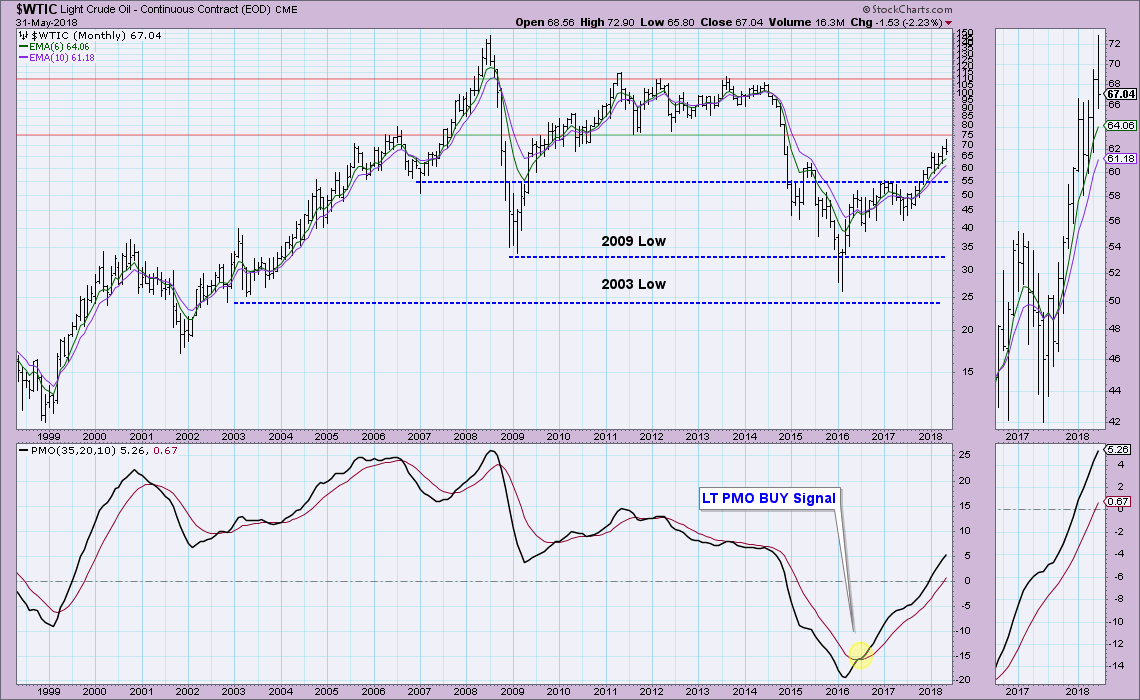 Bonds have now executed a long-term head and shoulders pattern. While they could find support along the rising bottoms trendline, ultimately the pattern calls for a minimum downside target that is the height of the pattern. That coincidently brings price down to support at $120 (the '03 and '05 tops). For now, I expect bonds to continue lower to at least challenge that rising bottoms trendline.
Technical Analysis is a windsock, not a crystal ball.
Happy Charting!
- Erin
Helpful DecisionPoint Links:
DecisionPoint Shared ChartList and DecisionPoint Chart Gallery
Price Momentum Oscillator (PMO)
Swenlin Trading Oscillators (STO-B and STO-V)
**Don't miss DecisionPoint Commentary! Add your email below to be notified of new updates"**