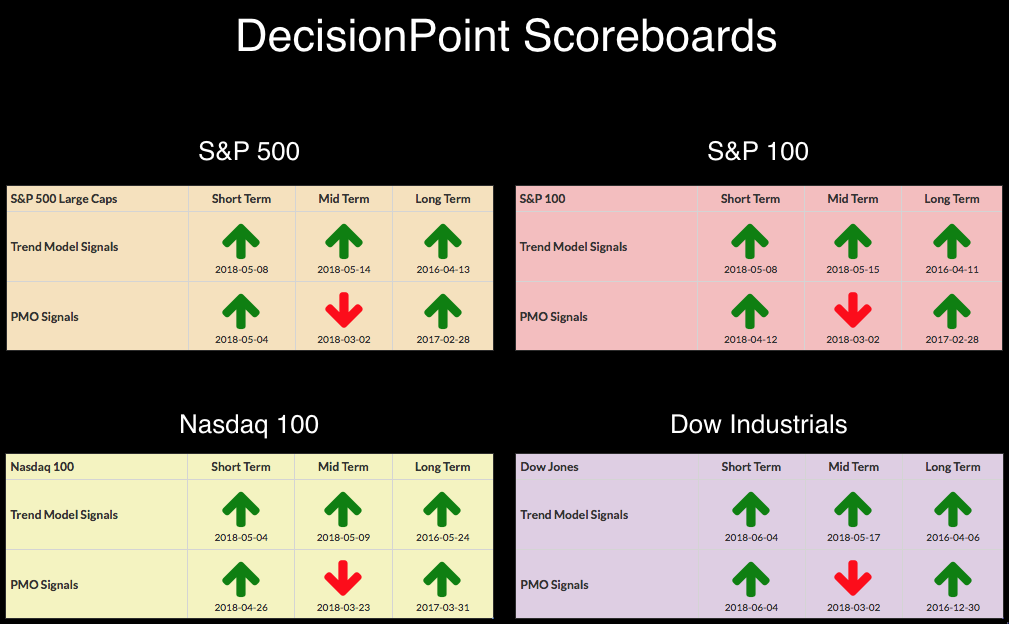
So far this week, we had only two signal changes. The Dow moved from ST Trend Model Neutral and ST PMO SELL back to BUY signals after only a few days. The only area of concern for these Scoreboards is the IT PMO SELL signals which are found on the weekly chart. The good news is that on all four, the weekly PMOs are rising. And, in the case of the NDX, there is a pending IT PMO BUY signal. If that weekly PMO crossover on the NDX remains after the close on Friday, we will be clearing at least one of the IT PMO SELL signals.
The DecisionPoint Weekly Wrap presents an end-of-week assessment of the trend and condition of the stock market (S&P 500), the U.S. Dollar, Gold, Crude Oil, and Bonds.
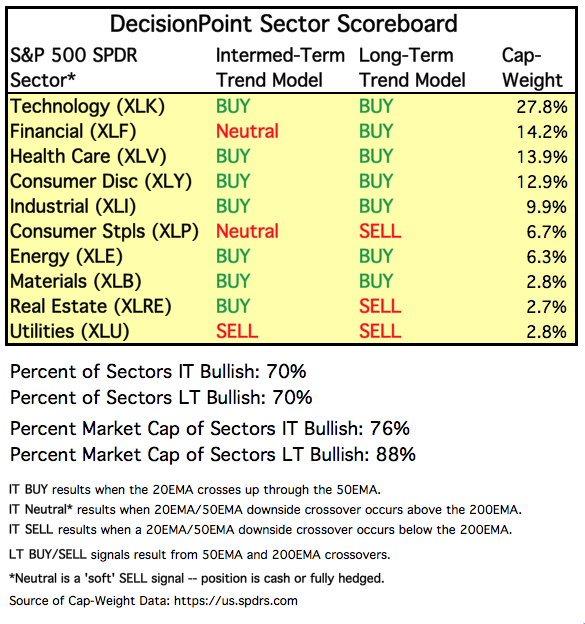
SECTORS
Each S&P 500 Index component stock is assigned to one, and only one, of 10 major sectors. This is a snapshot of the Intermediate-Term and Long-Term Trend Model signal status for those sectors.
STOCKS
IT Trend Model: BUY as of 5/11/2018
LT Trend Model: BUY as of 4/1/2016
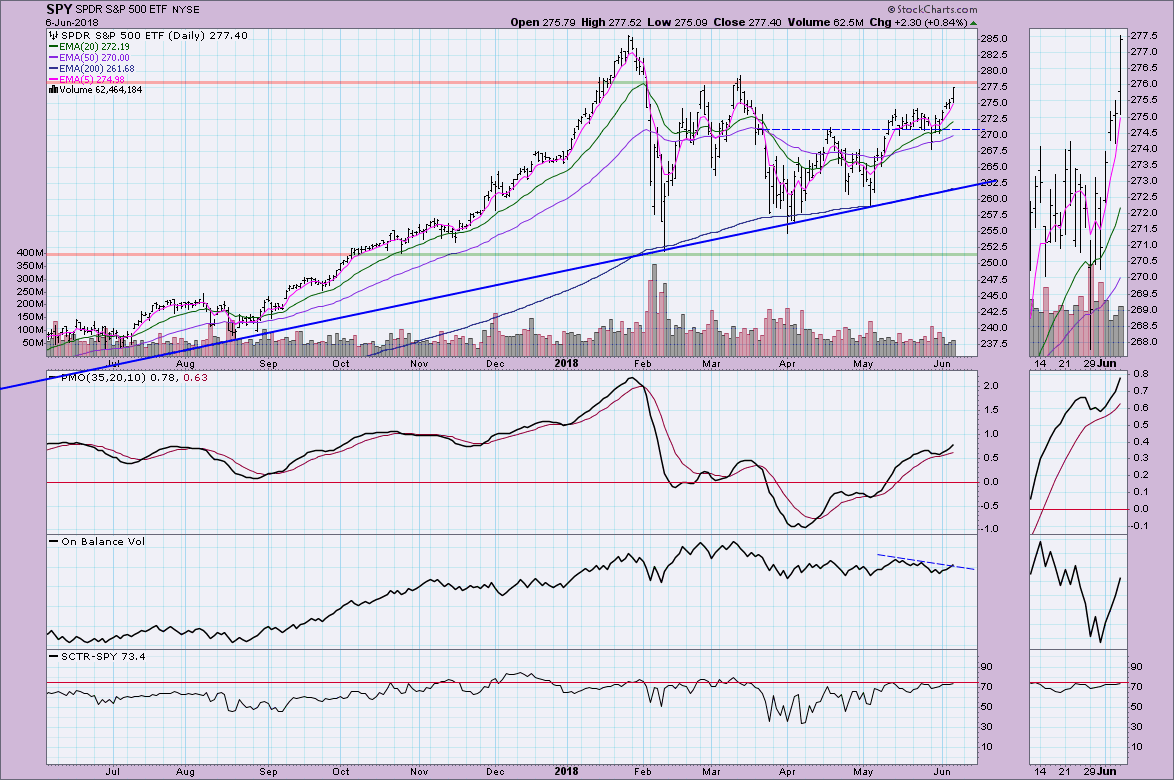
SPY Daily Chart: Last week was fairly uncomfortable to the market, but this week saw a very bullish breakout and rally continuation today. Price is now reaching very important overhead resistance at the February and March tops. The PMO looks great and the declining trend on the OBV has nearly been broken. With the Russell 2000 reaching new all-time highs, I don't think the SPY/SPX will be far behind.
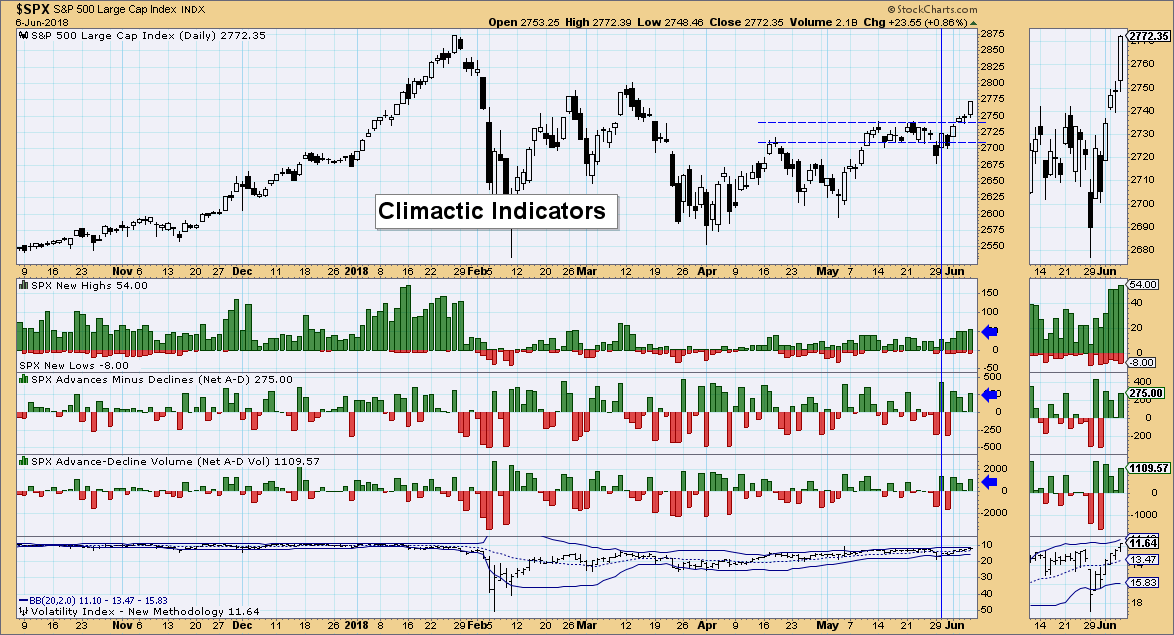
Climactic Market Indicators: These are the indicators that are implying a buying exhaustion is coming. We are beginning to see some climactic readings on breadth and the VIX is getting awfully close to puncturing the upper Bollinger Band. Remember these indicators are best considered in the very short term. We are seeing the VIX moving lower and lower which implies more and more complacency or bullishness. I view this indicator as a sentiment value. Sentiment being contrarian, I would look for a buying exhaustion off these climactic readings. A pullback to the breakout area would make sense after the strength of this rally.
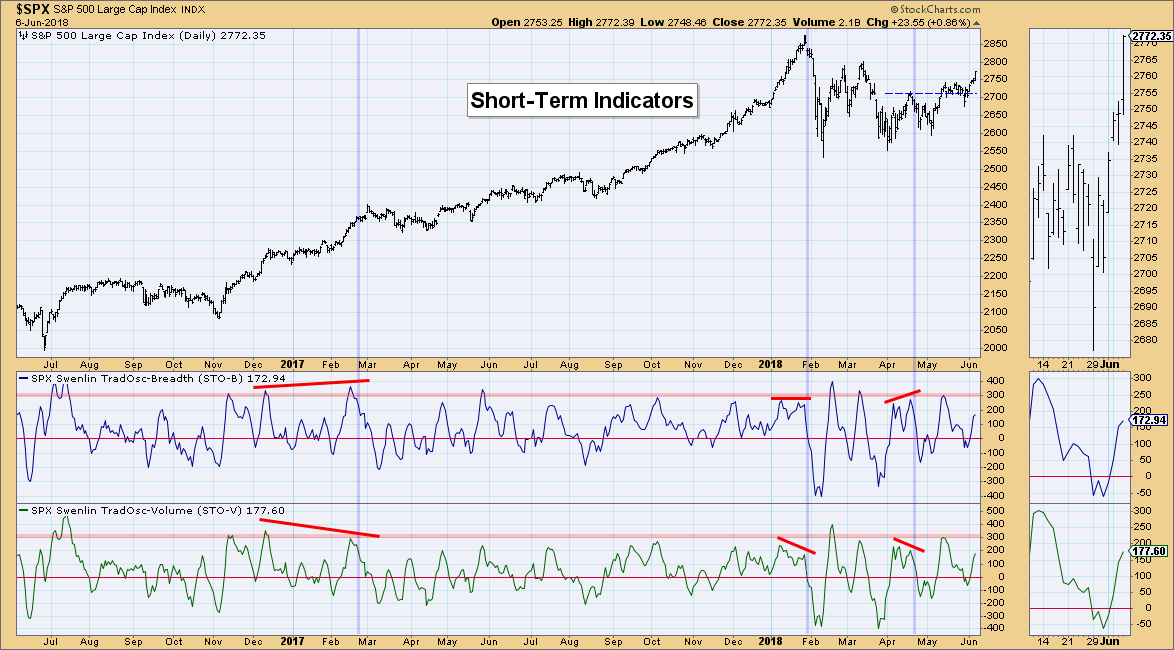
Short-Term Market Indicators: They are decelerating somewhat, but are rising. They are nearing overbought territory which might also suggest a short-term buying exhaustion in the making.
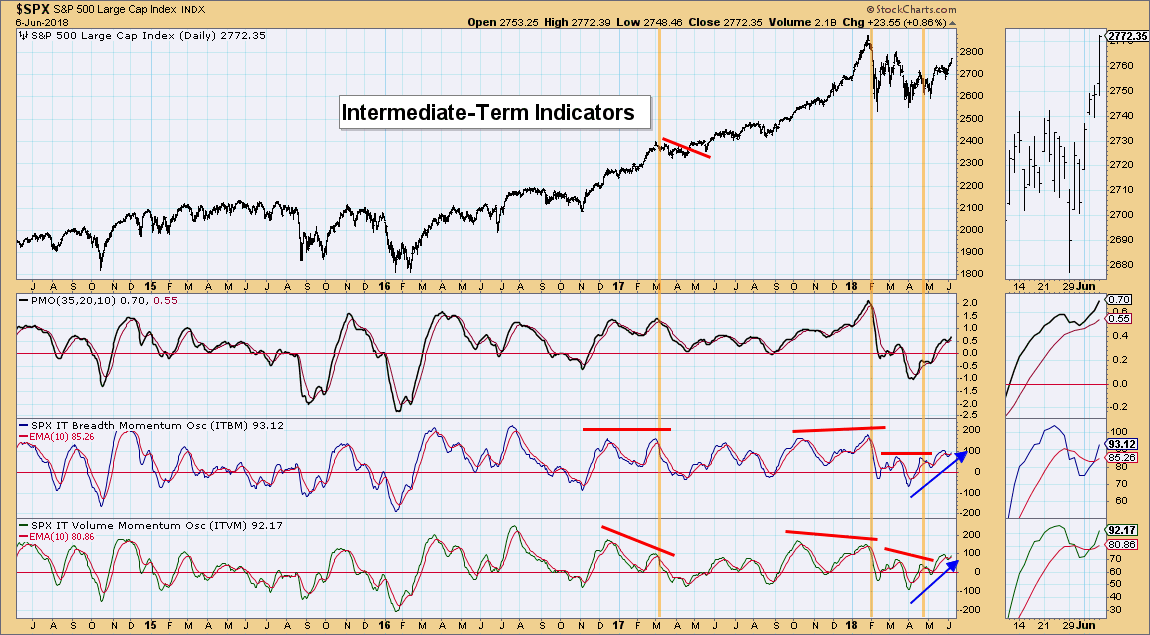
Intermediate-Term Market Indicators: I was glad to see the positive crossovers on the ITBM/ITVM. I'm not seeing any negative divergences so I'd consider the intermediate term bullish.
Conclusion: I suspect the market will continue higher, but we are likely to see a pause or stumble next week within the context of this short-term rally. Our market indicators are still very bullish so I'm not looking for a correction; more likely we will see some consolidation or swift pullback right before this rally continues on its way higher.
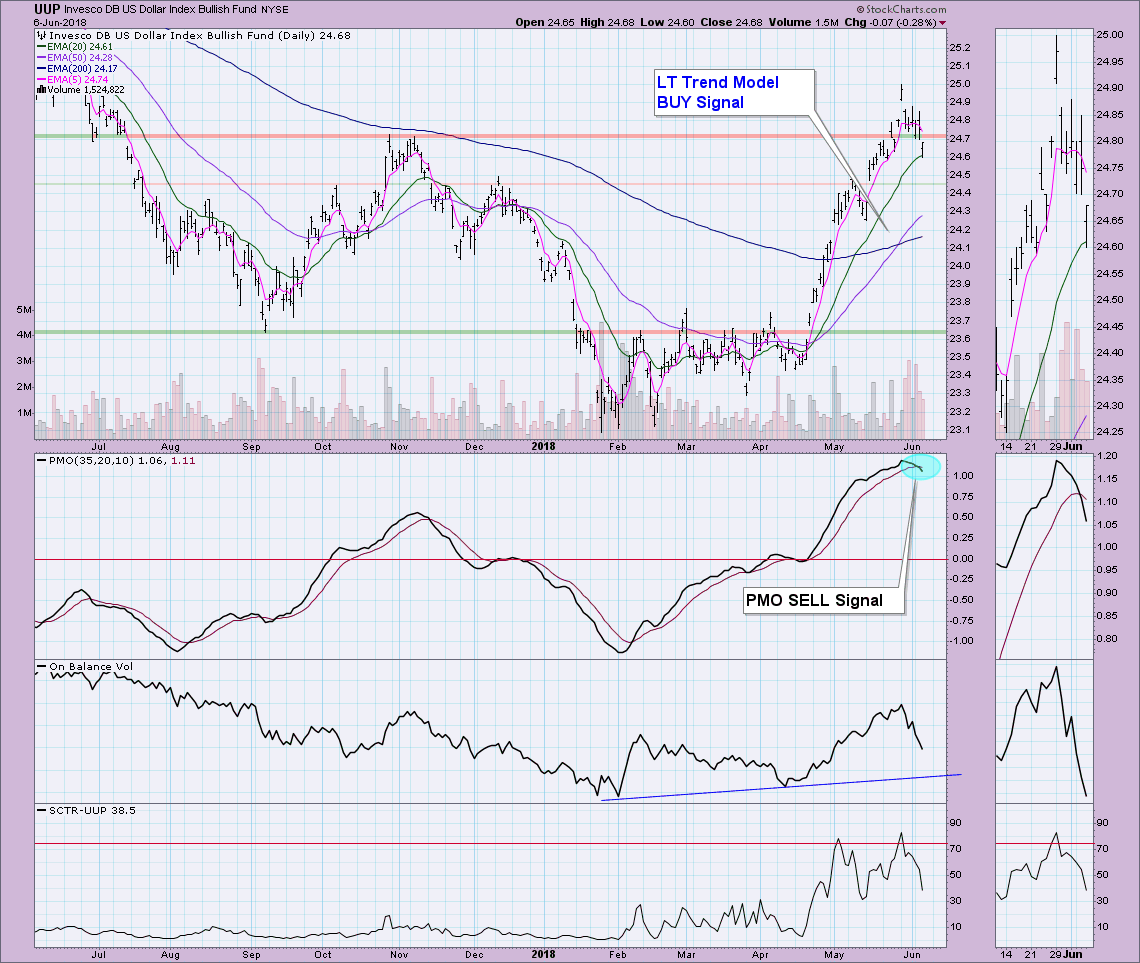
DOLLAR (UUP)
IT Trend Model: BUY as of 4/24/2018
LT Trend Model: BUY as of 5/25/2018
UUP Daily Chart: The Dollar broke down below support at the November high. The next area of support is at $24.45. While I do see a PMO SELL signal, I'm not expecting the Dollar to take a dive. I'm still in the consolidation and small pullback camp. The PMO needs an opportunity to unwind out of extremely overbought territory.
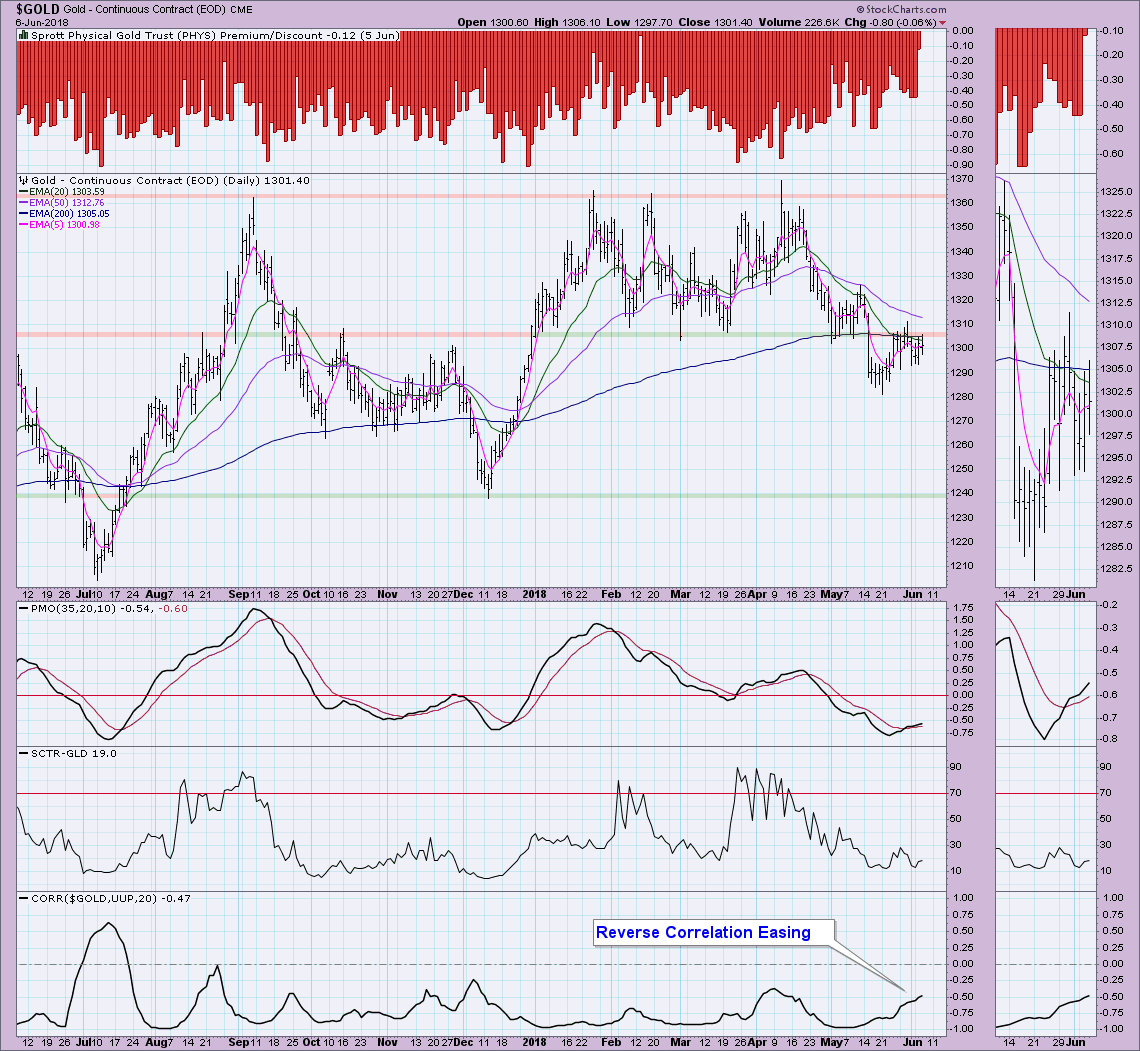
GOLD
IT Trend Model: Neutral as of 5/2/2018
LT Trend Model: BUY as of 4/12/2017
GOLD Daily Chart: I'm lukewarm on Gold. Overhead resistance has held for quite some time. Normally, if the Dollar pulls back, Gold will rise due to the near perfect reverse correlation between the two. However, note that Gold is beginning to decouple from the Dollar. This can be a good news, bad news situation. I suspect a pullback or consolidation on the Dollar is ahead. Gold should still benefit from this, though not as much if it decouples from the Dollar too much. If the Dollar turns around and rallies, a low reverse correlation offers Gold the opportunity to rally somewhat as well. I note that the Gold discount pulled way back. This should be considered bullish sentiment which would be bearish for Gold. The chart looks good with the PMO BUY signal, but with price struggling below the 20/50/200-EMAs--we can't get too bullish.
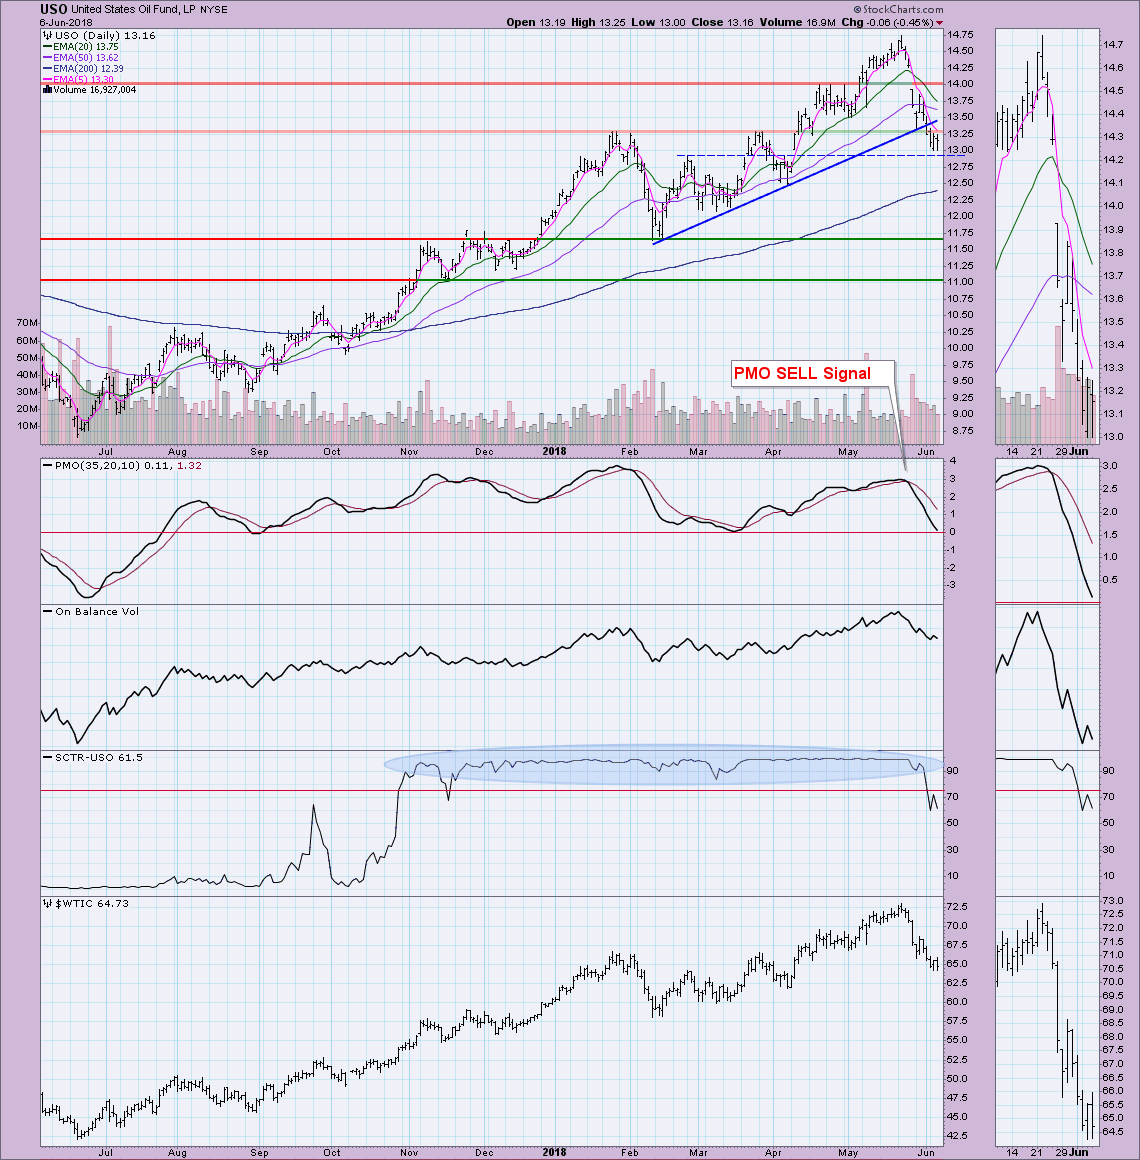
CRUDE OIL (USO)
IT Trend Model: BUY as of 9/6/2017
LT Trend Model: BUY as of 11/2/2017
USO Daily Chart: The decline in USO after the PMO topped and tumbled has been quick and painful, but it appears support may have been reached. I thought that horizontal support and the rising bottoms trendline would offer the best opportunity for USO to stem the bleeding, but that broke this week. It looks like $13 may provide the support needed to right the ship. A PMO drop below the signal line would concern me as that would suggest that we have more destruction ahead. Additionally, an IT Trend Model Neutral signal is brewing as the 20-EMA hurries to catch and cross the 50-EMA. Support needs to hold here.
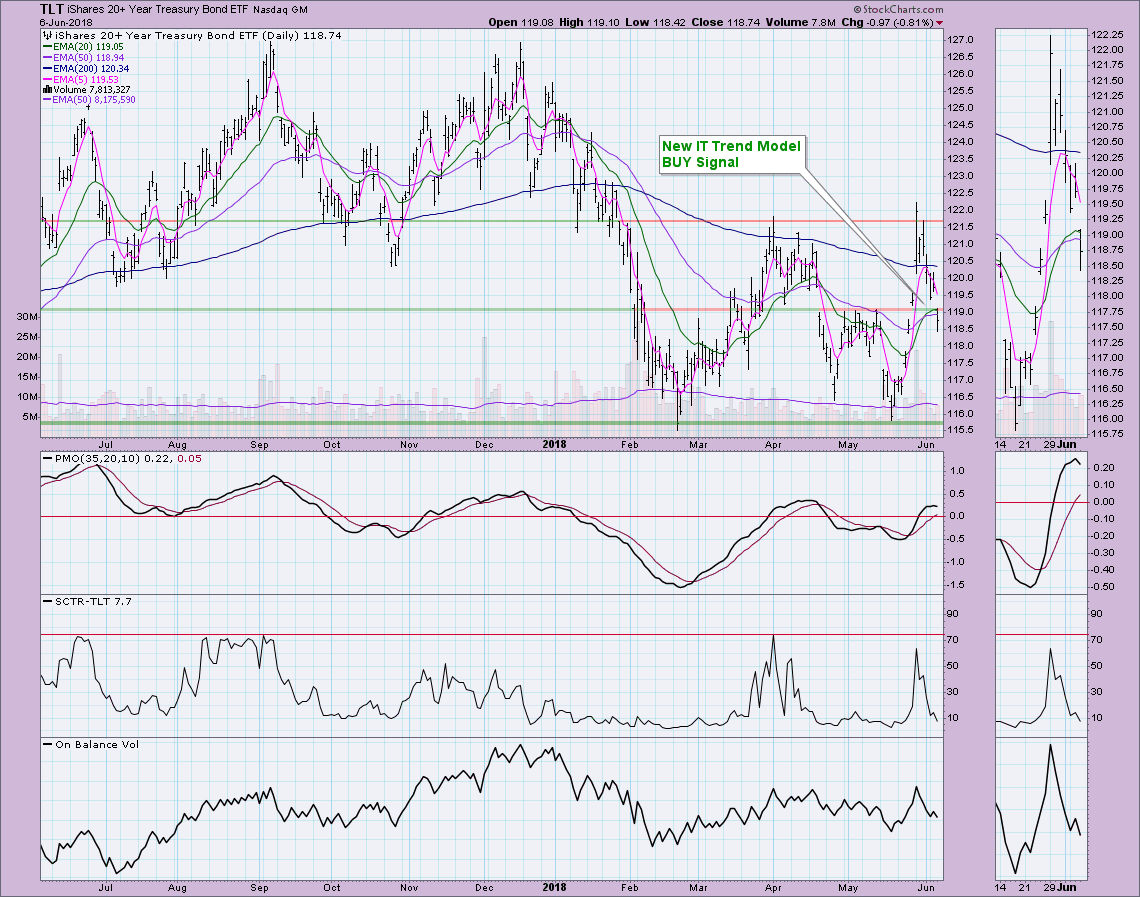
BONDS (TLT)
IT Trend Model: SELL as of 4/20/2018
LT Trend Model: SELL as of 2/8/2018
TLT Daily Chart: As I wrote in last weekend's ChartWatchers article, the IT Trend Model BUY signal arrived late to the party. Everyone was leaving or had left. The PMO has topped and price has dropped below support at $119. I continue to look for price to drop to the $115 level. As a market timer who is tracked by Timer Digest, it truly pained me to have to turn in this mechanical BUY signal when I knew that price was destined to fall hard and fast.
Technical Analysis is a windsock, not a crystal ball.
Happy Charting!
- Erin
**Don't miss any of the DecisionPoint commentaries! Go to the "Notify Me" box toward the end of this blog page to be notified as soon as they are published.**
NOTE: The signal status reported herein is based upon mechanical trading model signals, specifically, the DecisionPoint Trend Model. They define the implied bias of the price index based upon moving average relationships, but they do not necessarily call for a specific action. They are information flags that should prompt chart review. Further, they do not call for continuous buying or selling during the life of the signal. For example, a BUY signal will probably (but not necessarily) return the best results if action is taken soon after the signal is generated. Additional opportunities for buying may be found as price zigzags higher, but the trader must look for optimum entry points. Conversely, exit points to preserve gains (or minimize losses) may be evident before the model mechanically closes the signal.
Helpful DecisionPoint Links:
DecisionPoint Shared ChartList and DecisionPoint Chart Gallery
Price Momentum Oscillator (PMO)
Swenlin Trading Oscillators (STO-B and STO-V)