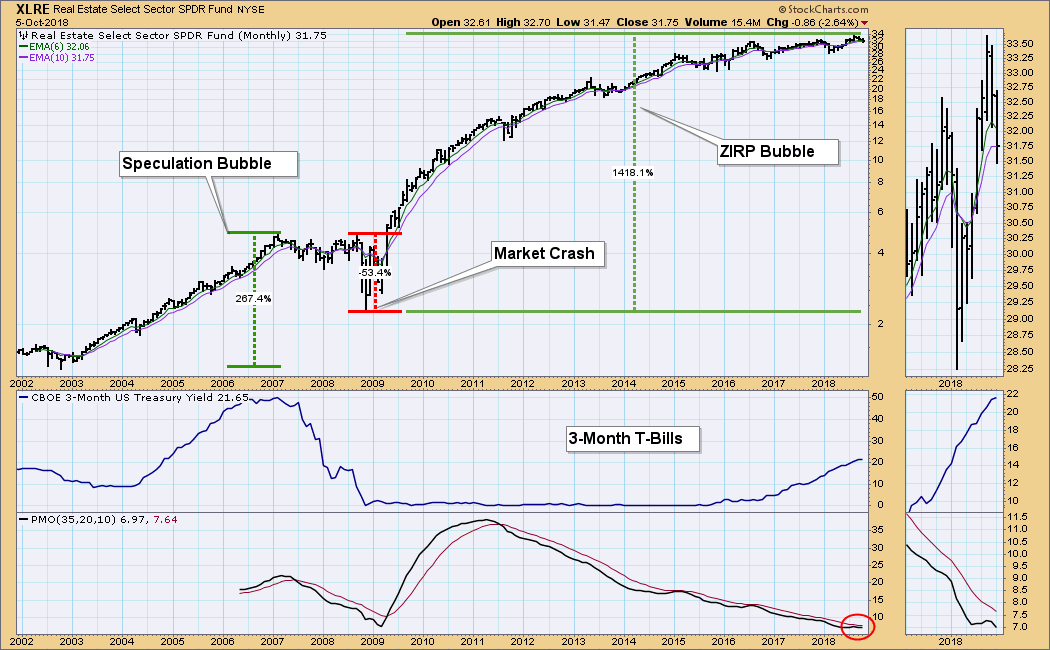
The root cause of the Financial Crisis was real estate speculation combined with Wall Street's perennial, casual disregard for other people's money. After the real estate market crashed, the zero interest rate policy (ZIRP) was put forth in order to see that real estate speculators were made whole again. Thanks to this generous, artificial stimulus, real estate prices have recovered, and a new bubble has been created. With interest rates headed back to more normal levels, we are beginning to see pressure on real estate prices.
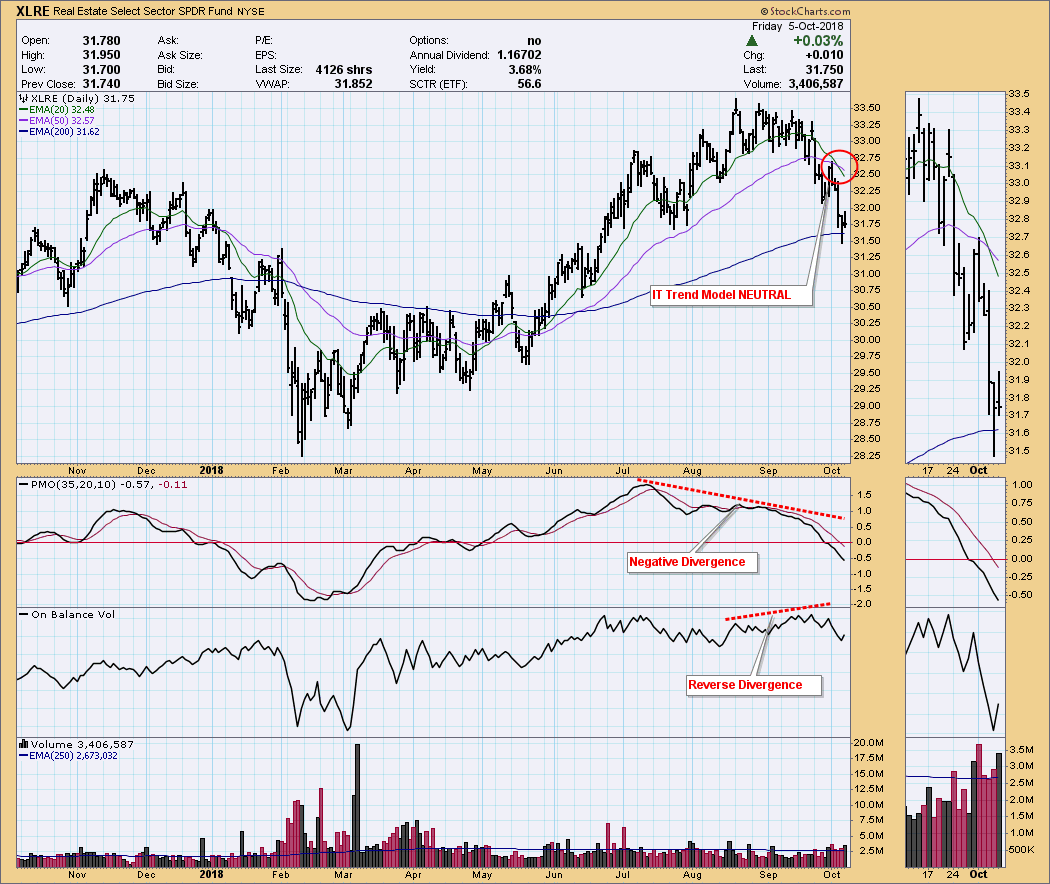
Looking at the daily chart below, we can see that the Real Estate sector (XLRE) topped in August, and has recently seen a lot of selling pressure. The 20EMA has crossed down through the 50EMA, changing the IT Trend Model to NEUTRAL. Of course, I can't say for sure if this is a long-term top, but the fundamentals are dead against a positive outcome, and the technical divergences second that conclusion.
Whether or not real estate will kill the financial markets again, remains to be seen. For one thing, it really is different this time. Last time the crash was brought on by rampant speculation; whereas, this time government stimulus has returned prices to previously unrealistic levels, but without the attendant frenzy of the last bubble. Nevertheless, a huge dislocation has been created, and it will eventually need to be corrected.
The DecisionPoint Weekly Wrap presents an end-of-week assessment of the trend and condition of the stock market (S&P 500), the U.S. Dollar, Gold, Crude Oil, and Bonds.
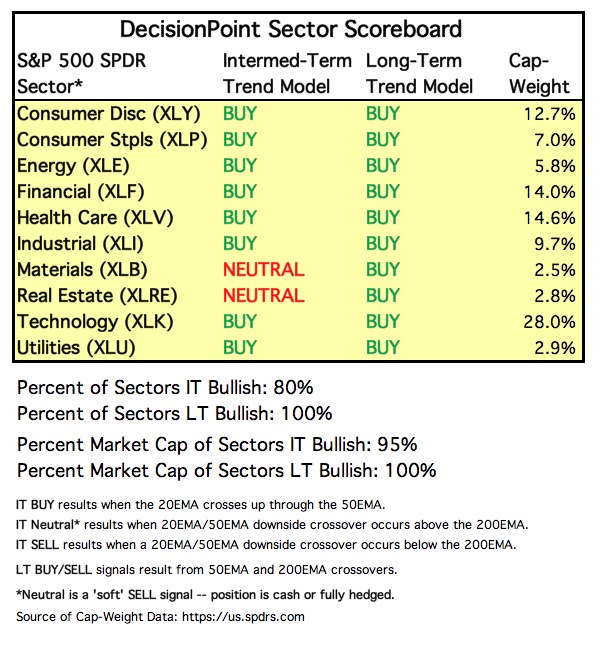
SECTORS
Each S&P 500 Index component stock is assigned to one, and only one, of 10 major sectors. This is a snapshot of the Intermediate-Term and Long-Term Trend Model signal status for those sectors.
STOCKS
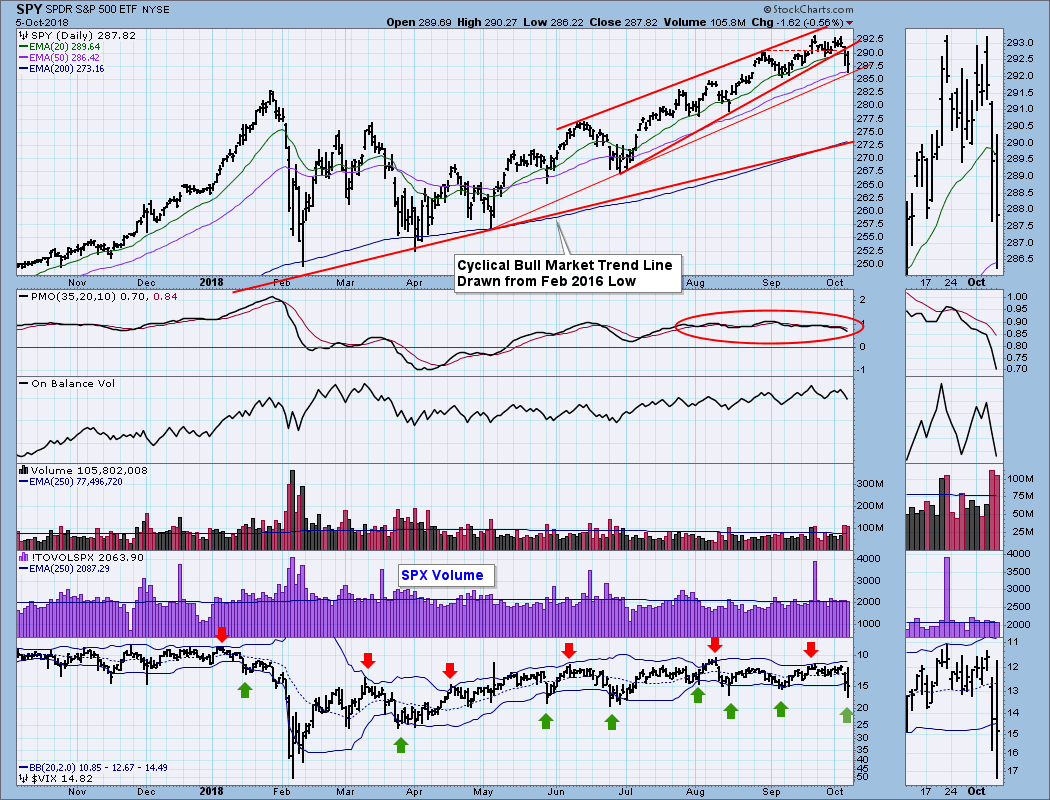
IT Trend Model: BUY as of 5/11/2018
LT Trend Model: BUY as of 4/1/2016
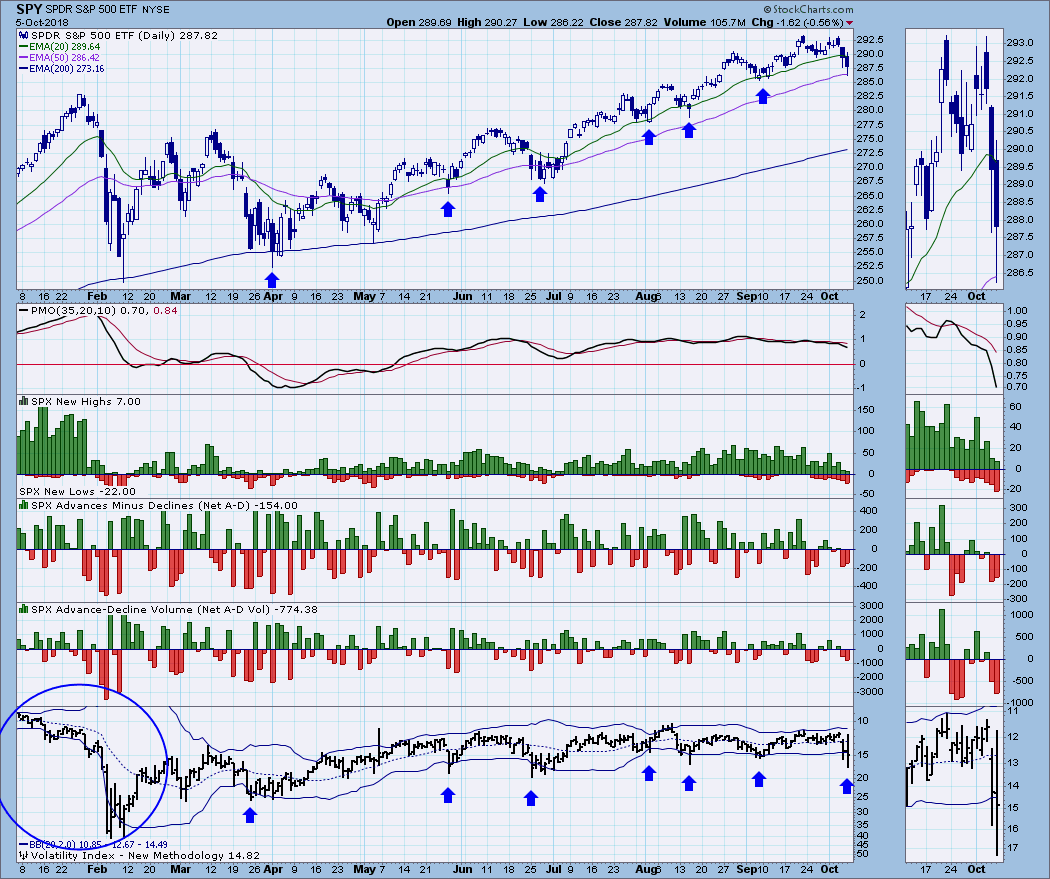
SPY Daily Chart: The rising wedge formation resolved downward, as expected. Note that the VIX has dropped through the lower Bollinger Band, which for several months has been a signal to look for a short-term bottom. Also of note, SPX total volume was merely average today. I find that to be important because it tells us that Friday's selling was not climactic, meaning that the selling may not be over. Finally, SPY has reached support on the 200EMA, as well as the rising trend line drawn from the May low.
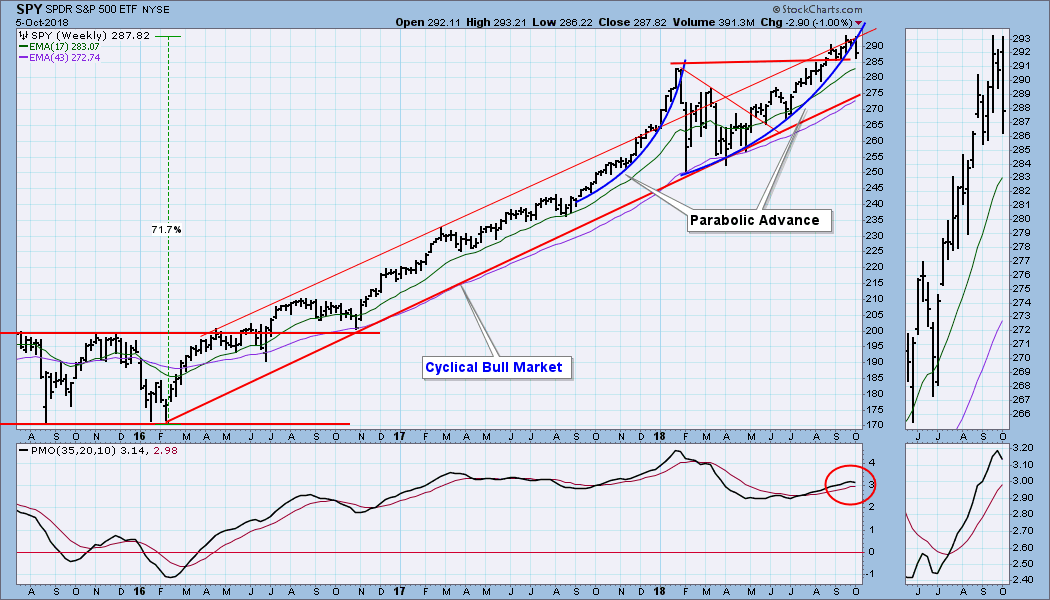
SPY Weekly Chart: This week price dropped below the parabolic arc we've been watching, so that is no longer an issue. The weekly PMO has topped, and price is headed down toward the bottom of the rising trend channel. The picture is currently negative, but not outside the parameters of a normal correction within an up trend.
Ultra-Short-Term Market Indicators: Net advances minus declines and net A-D volume both have modest readings and do not stand out as being climactic.
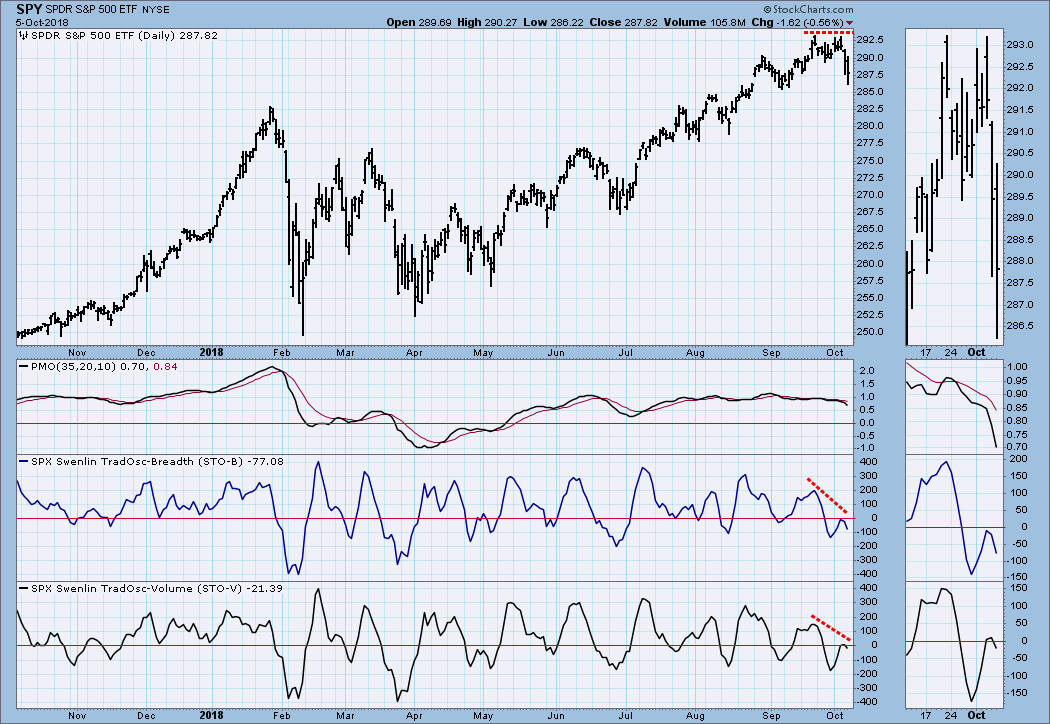
Short-Term Market Indicators: There are some pretty sharp negative divergences associated with the last price top.
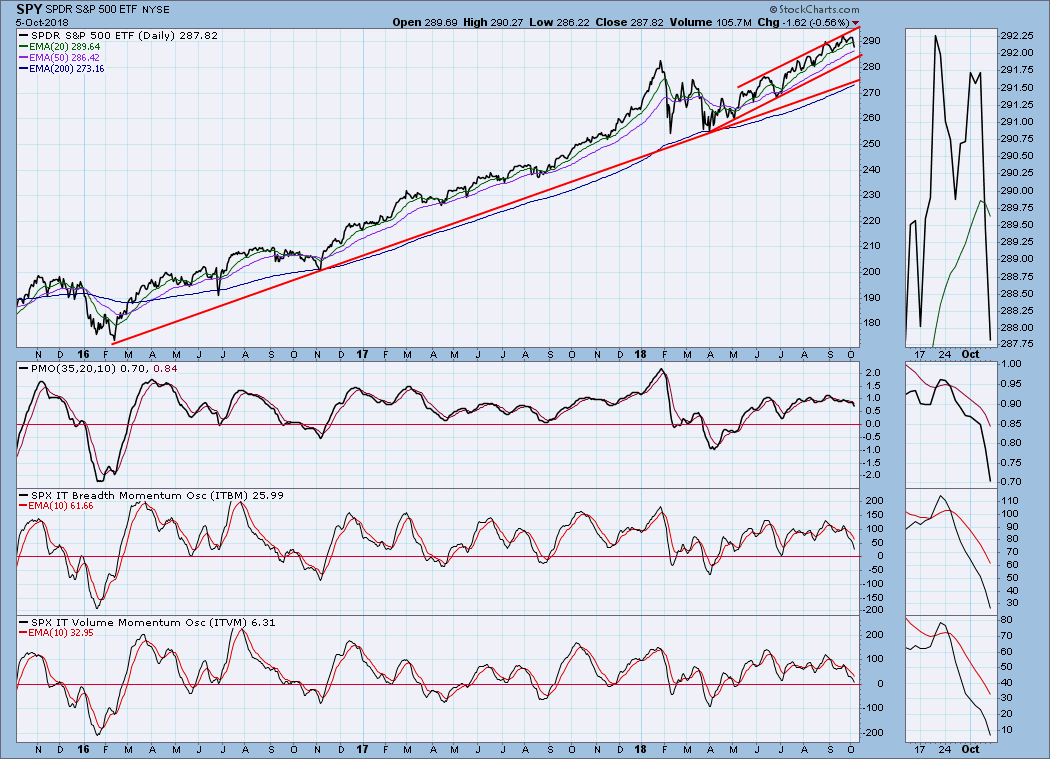
Intermediate-Term Market Indicators: Internals are neutral but weakening.
 Bullish Percent Index: Pardon me while I obsess over the BPI showing a substantial drop in participation since the January price top -- fewer stocks with point and figure BUY signals. This is the kind of chart that makes you glad you are a technical analyst.
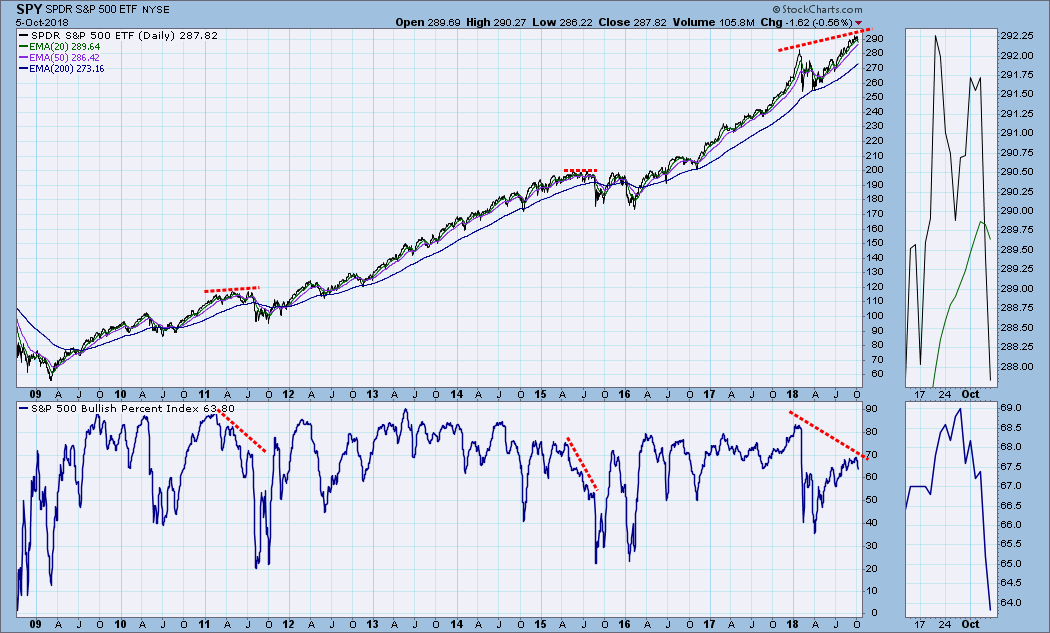
CONCLUSION: The kind of pullback the market experienced this week is pretty typical of what we have seen since May -- just enough to get the bears itchy, but over before you can get your feet off the desk to take a closer look. The VIX says the market is short-term oversold, so we could get a bottom next week. For the longer-term, I think we will soon run into problems due to the fading internals expressed by the BPI. Also, rising interest rates are having a negative effect on the real estate sector, and that party may well be over. Finally -- I should be writing them down -- but I'm seeing a lot of comments of the kind that usually abound at long-term market tops. This is no time to get complacent.
DOLLAR (UUP)
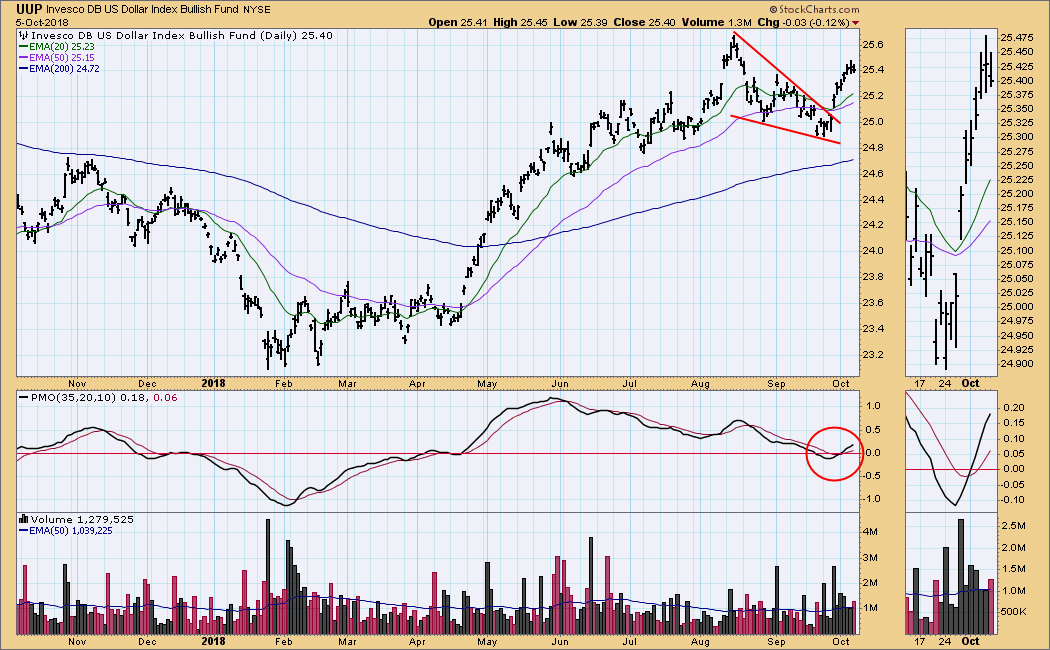
IT Trend Model: BUY as of 4/24/2018
LT Trend Model: BUY as of 5/25/2018
UUP Daily Chart: The mechanics of the wedge: It squeezes price into a ever-narrowing channel until price shoots out in the opposite direction of the wedge's trend. Such is the case here. Now price has decelerated from the speed of the initial thrust. Once the wedge resolves, there is no rule regarding what will happen next. My impression is that the advance is about to fizzle, so I'm looking for a short-term pullback.
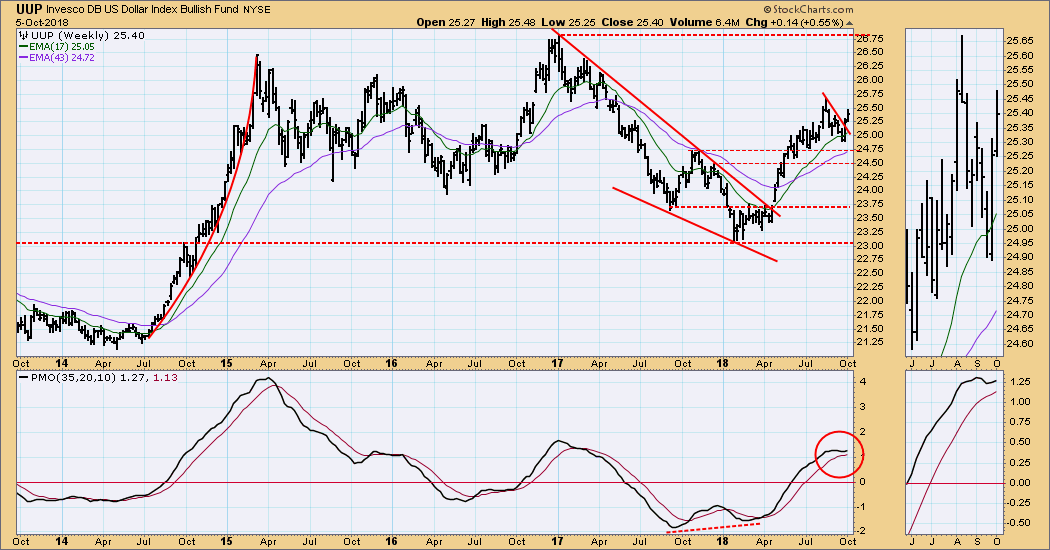
UUP Weekly Chart: The weekly PMO has turned up again, and the price breakout looks more energetic in this time frame.
GOLD
IT Trend Model: NEUTRAL as of 5/2/2018
LT Trend Model: SELL as of 6/22/2018
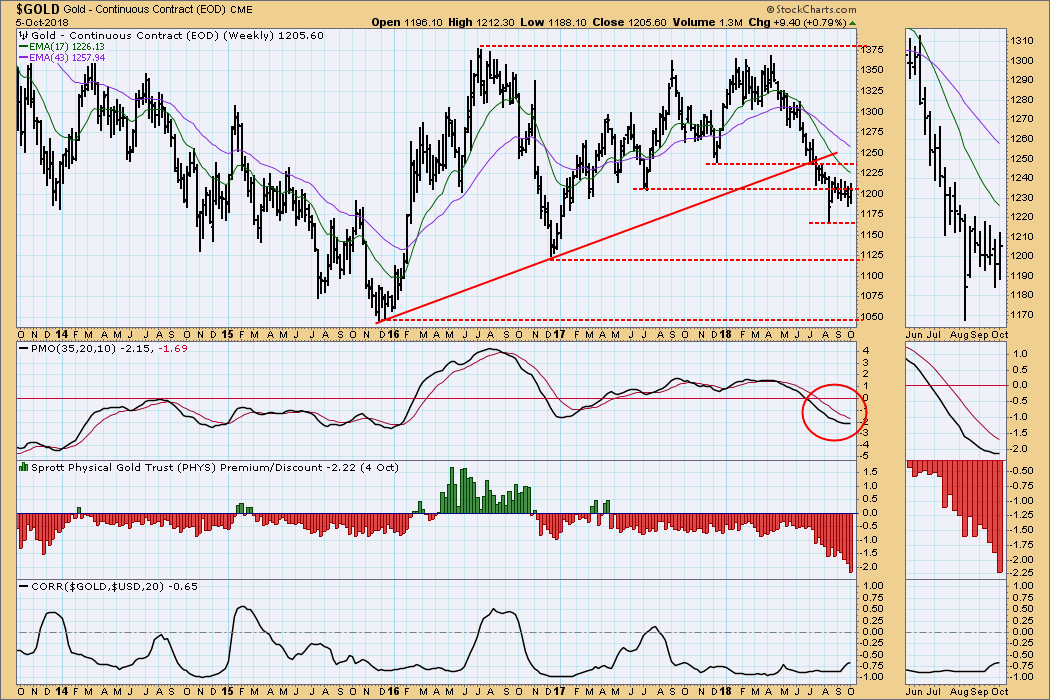
GOLD Daily Chart: Gold appears to have made a double bottom, albeit a little lopsided. I think that deal will be sealed if it can get above the declining tops line. The PMO implies that a breakout is likely. Of late, gold has decoupled from its usual negative correlation with the dollar; however, I suspect that any dollar weakness will translate into higher gold prices.
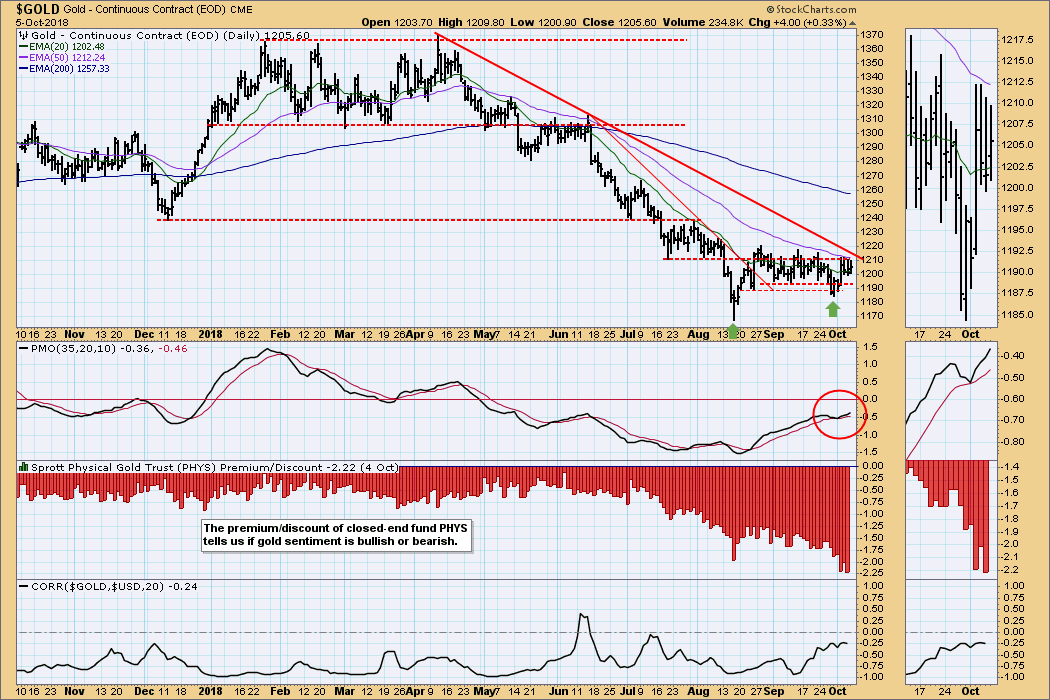
GOLD Weekly Chart: The weekly PMO is trying to bottom, indicating that momentum may be turning positive in this time frame. Sentiment is at its most negative since the 2011 price top, and that is positive from a contrarian point of view.
CRUDE OIL (USO)
IT Trend Model: BUY as of 8/24/2018
LT Trend Model: BUY as of 11/2/2017
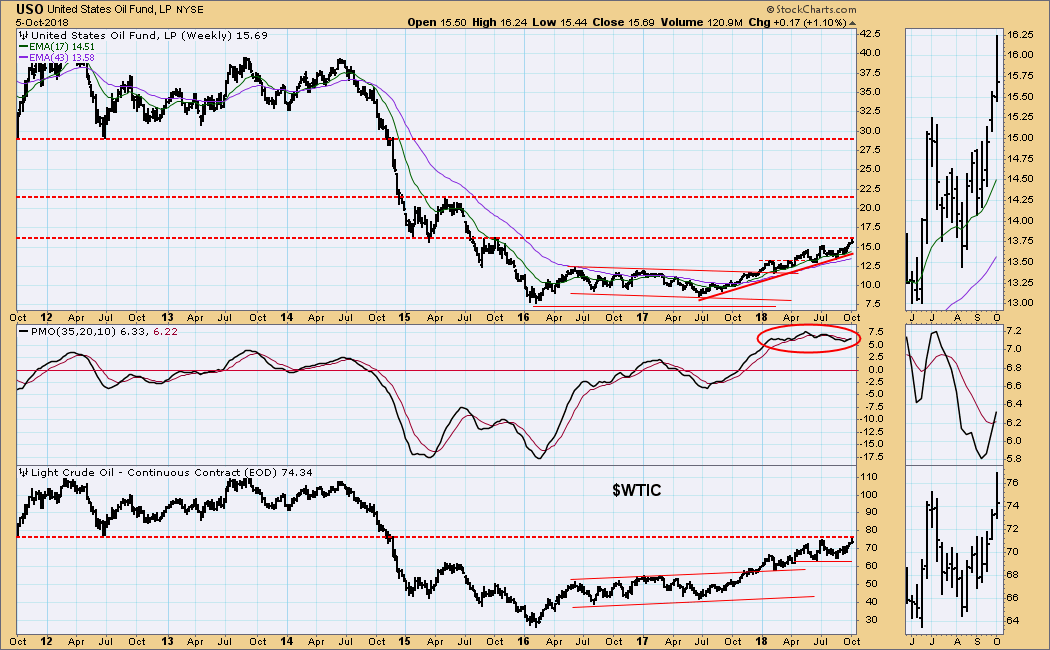
USO Daily Chart: Last week's breakout was extended this week, but now price has begun to consolidate. The weekly chart below shows why.
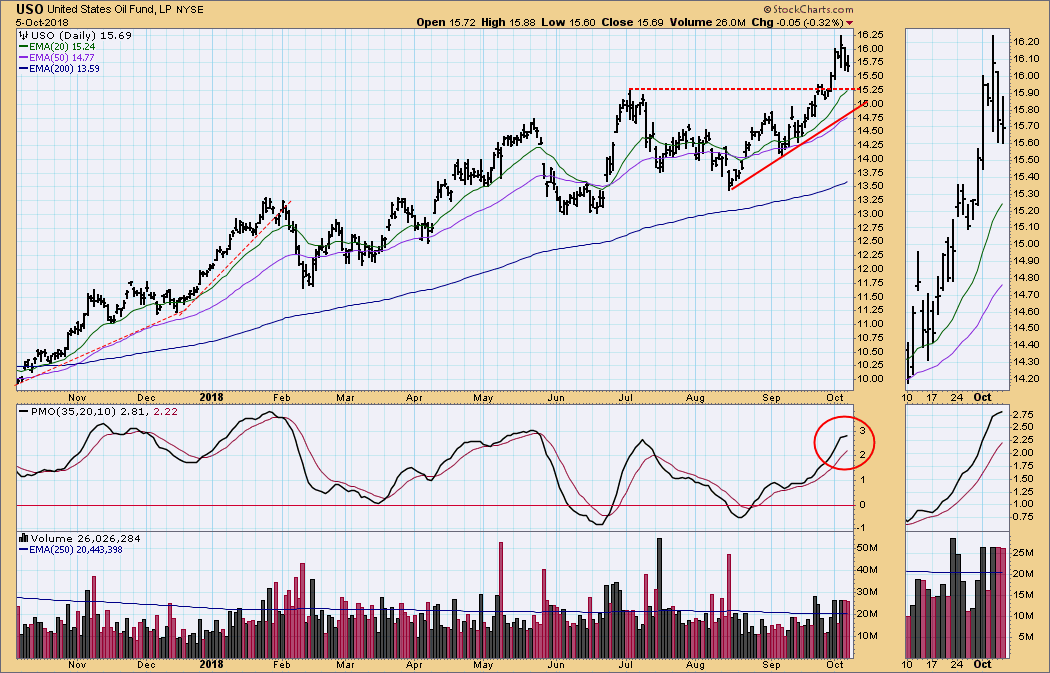
USO Weekly Chart: Both USO and $WTIC have reached the longer-term overhead resistance, and they have backed away somewhat. I'm not saying that prices won't go higher, but my feeling is that the upside potential is somewhat limited.
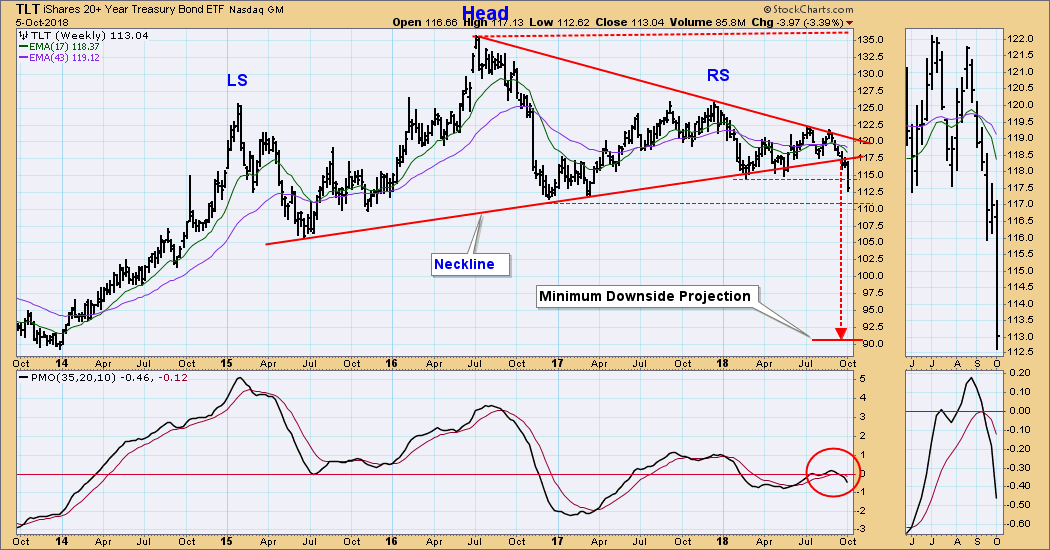
BONDS (TLT)
IT Trend Model: NEUTRAL as of 9/13/2018
LT Trend Model: SELL as of 9/18/2018
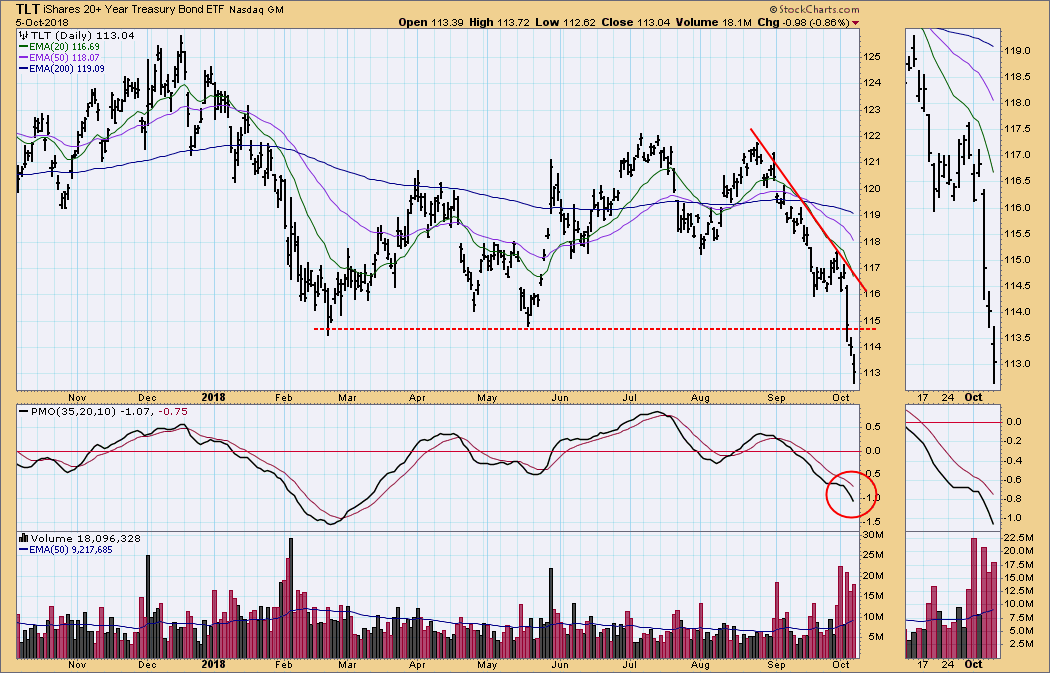
TLT Daily Chart: TLT has been deteriorating since August, but Wednesday's sharp drop indicates that maybe investors are finally waking up to the dismal long-term picture.
TLT Weekly Chart: Two weeks ago price edged slightly below the head and shoulders neckline, but this week the breakdown became decisive, meaning that TLT is not likely to rally back above the line of resistance. I have noted the minimum downside target, which is the distance between the top of the head and the neckline, but my assumption is and has been that bonds have begun a long-term decline that will persist for years.
**Don't miss any of the DecisionPoint commentaries! Go to the "Notify Me" box toward the end of this blog page to be notified as soon as they are published.**
Technical Analysis is a windsock, not a crystal ball.
Happy Charting!
- Carl
NOTE: The signal status reported herein is based upon mechanical trading model signals, specifically, the DecisionPoint Trend Model. They define the implied bias of the price index based upon moving average relationships, but they do not necessarily call for a specific action. They are information flags that should prompt chart review. Further, they do not call for continuous buying or selling during the life of the signal. For example, a BUY signal will probably (but not necessarily) return the best results if action is taken soon after the signal is generated. Additional opportunities for buying may be found as price zigzags higher, but the trader must look for optimum entry points. Conversely, exit points to preserve gains (or minimize losses) may be evident before the model mechanically closes the signal.
Helpful DecisionPoint Links:
DecisionPoint Shared ChartList and DecisionPoint Chart Gallery
Price Momentum Oscillator (PMO)
Swenlin Trading Oscillators (STO-B and STO-V)