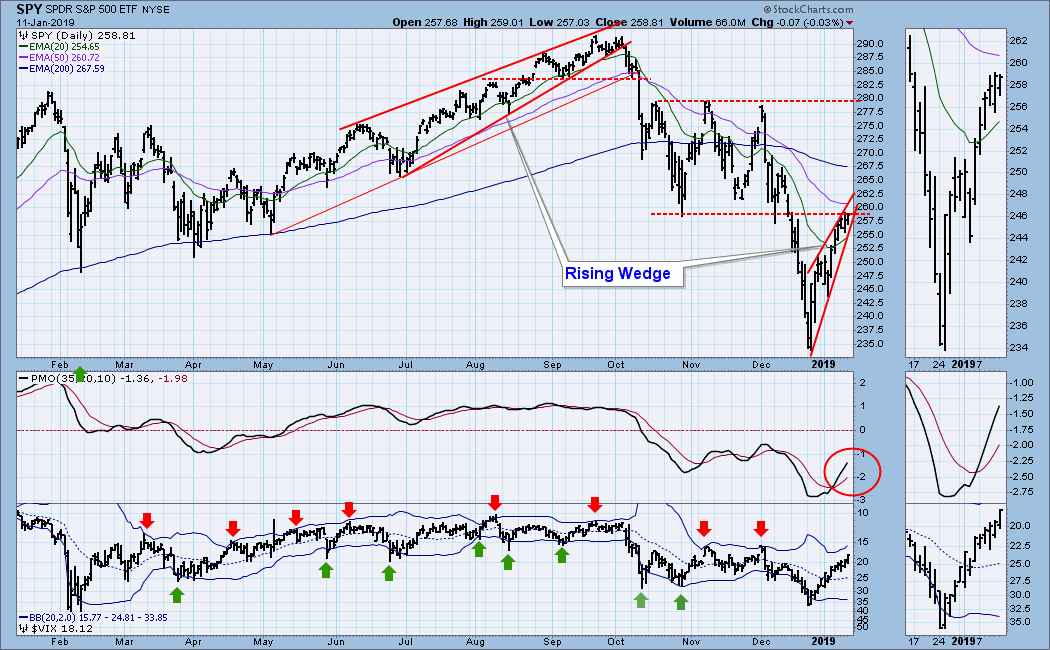
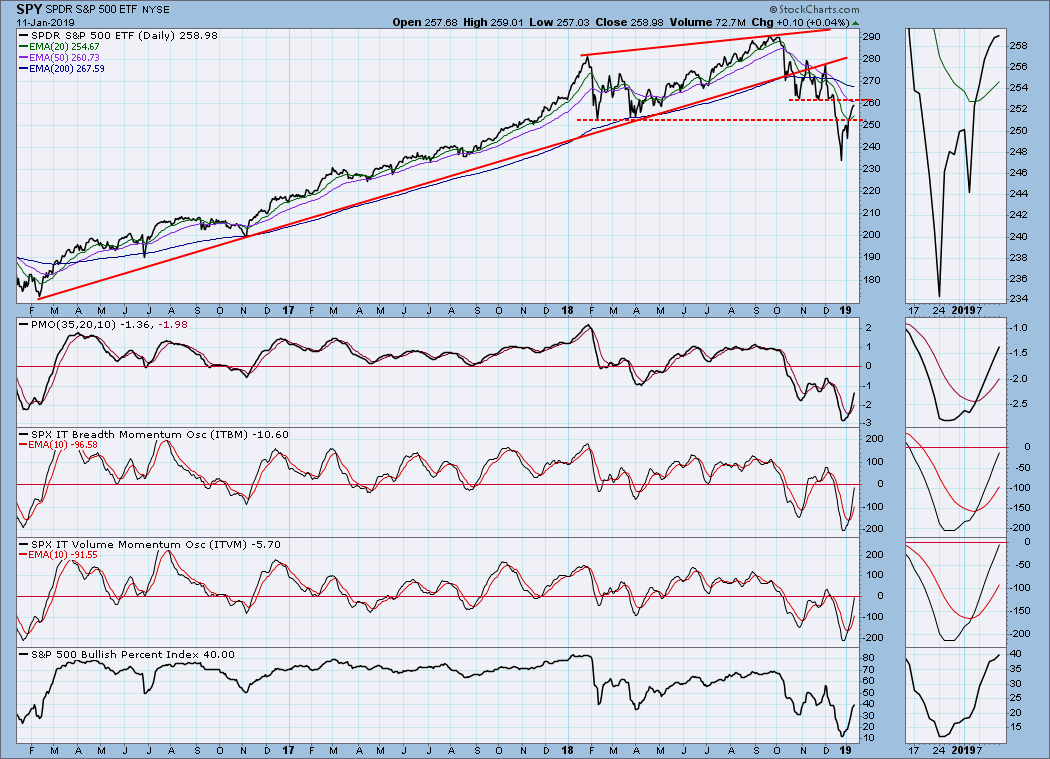
One of my favorite chart patterns is the wedge. Rising or falling, they arrive frequently and usually resolve predictably. On this chart there happen to be two rising wedge formations. The first one led us into the bull market top in September/October of 2018. It resolved downward, as expected, but I have to admit that the massive downside follow through was atypical to say the least. The current rising wedge off the December low should also resolve downward. That is not guaranteed, but, since we're in a bear market, it is more likely. Once it breaks down, the "prediction" is fulfilled, and I am not aware of any rule-of-thumb techniques to project how far down price is likely to go, but, again, the bear market implies that there will be more downside.
The DecisionPoint Weekly Wrap presents an end-of-week assessment of the trend and condition of the stock market (S&P 500), the U.S. Dollar, Gold, Crude Oil, and Bonds.
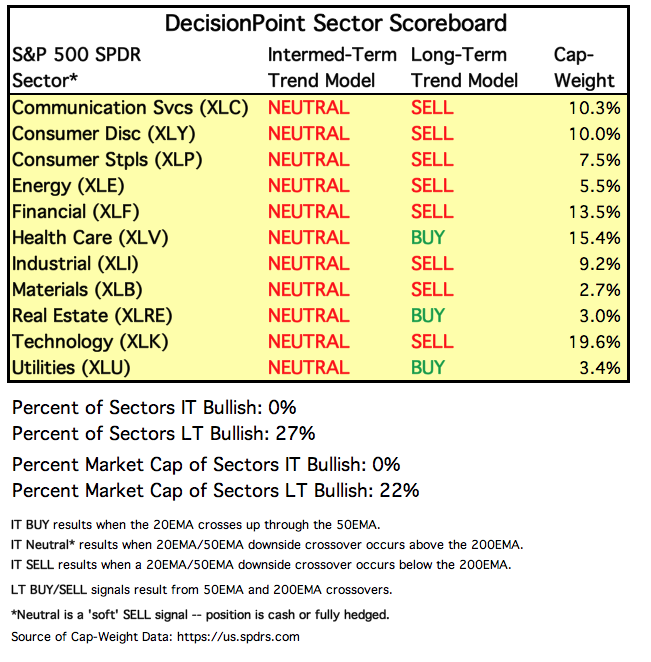
SECTORS
Each S&P 500 Index component stock is assigned to one, and only one, of 11 major sectors. This is a snapshot of the Intermediate-Term and Long-Term Trend Model signal status for those sectors.
STOCKS
IT Trend Model: NEUTRAL as of 10/15/2018
LT Trend Model: SELL as of 12/14/2018
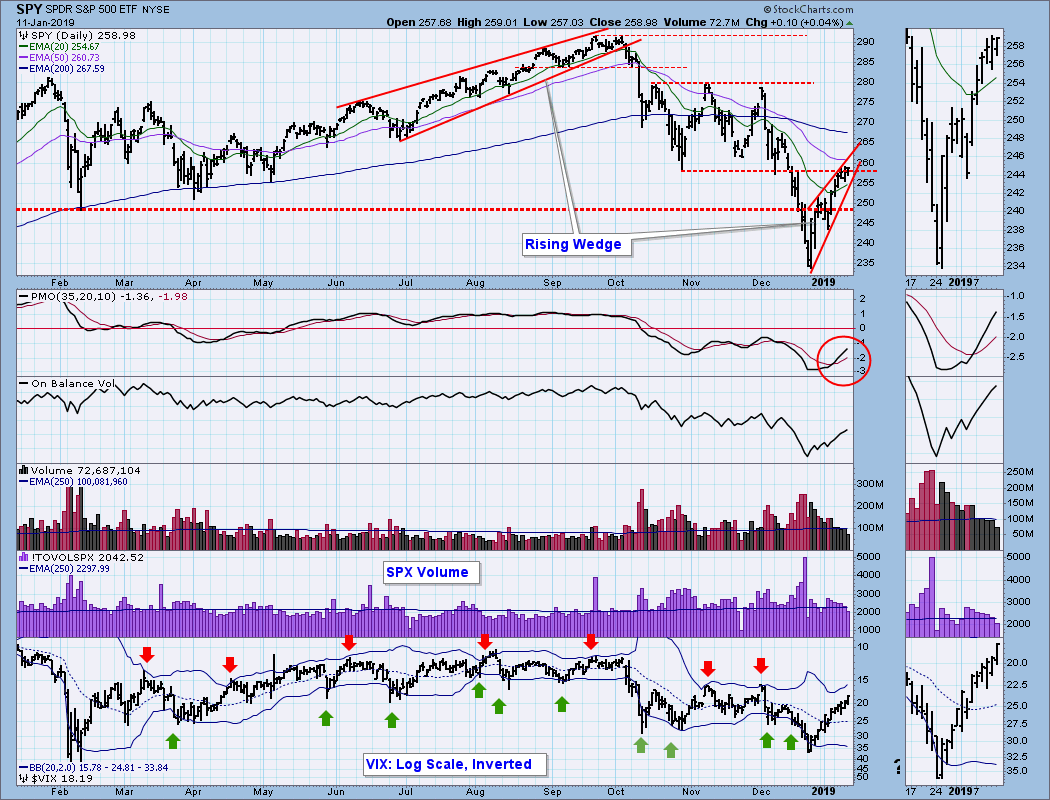
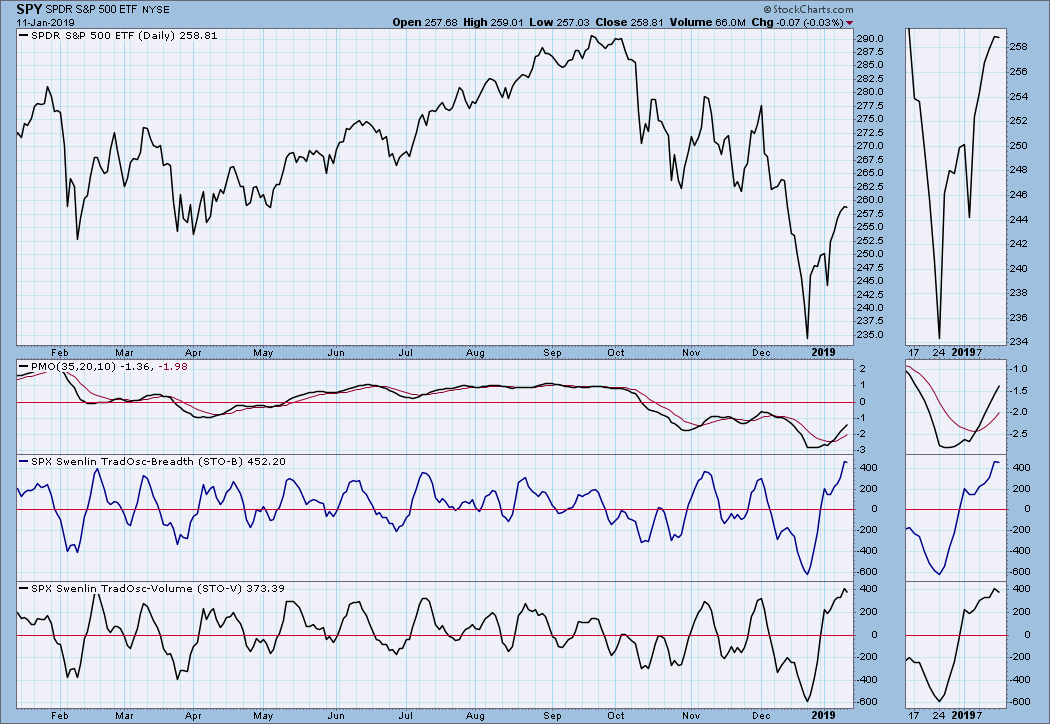
SPY Daily Chart: In addition to the issues covered in my opening comments, the VIX is close to the upper Bollinger Band, a short-term overbought indication.
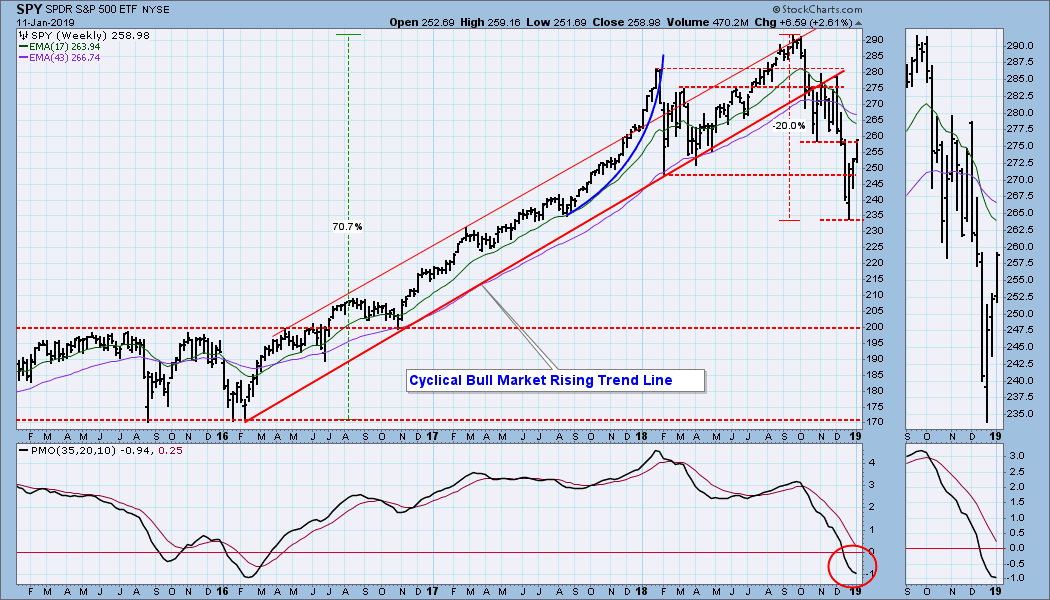
SPY Weekly Chart: Negative. The weekly PMO is close to turning up, but it is not there yet.
Short-Term Market Indicators: The STO-B and STO-V are at their highest levels in about five years. To be open-minded, it is possible that this indicates an upside initiation climax; however, I think it is more likely to be a bear market overbought condition, which will bring on a new down leg.
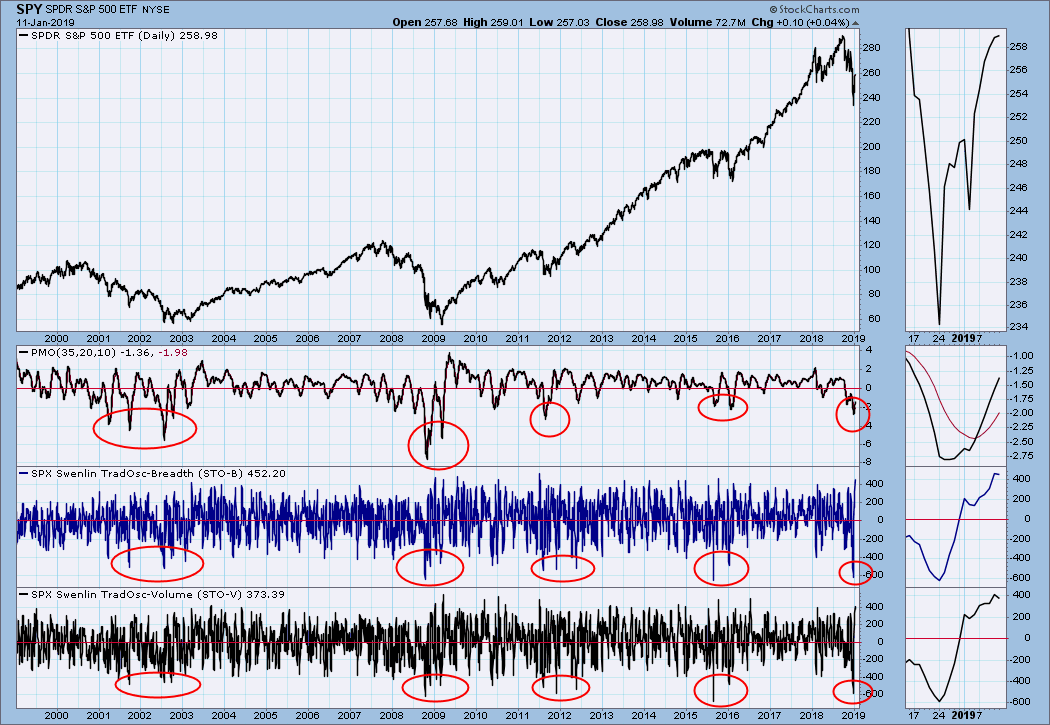
 This long-term look at short-term indicators gives us a view of extremes in the historical range. These indicators have recently hit downside extremes, which one might presume marks the end of the bear market, but historically we can see that it takes a series of extreme readings to finally put it bear market bottom.
Intermediate-Term Market Indicators: These have recovered quite a bit from their recent lows, which could be interpreted as their being relatively overbought.
CONCLUSION: There are two impending fundamental events to which the market is likely to react positively: (1) resolution of the trade issues with China; and (2) ending the government shutdown. Assuming that either event actually comes to pass, positive short-term reaction can be expected from either one, a reaction that could override negative short-term technical expectations; however, I don't think either of these events will end the bear market. Otherwise, I think we are at the end of the short-covering rally that began off the December lows, and I am expecting the decline to resume next week.
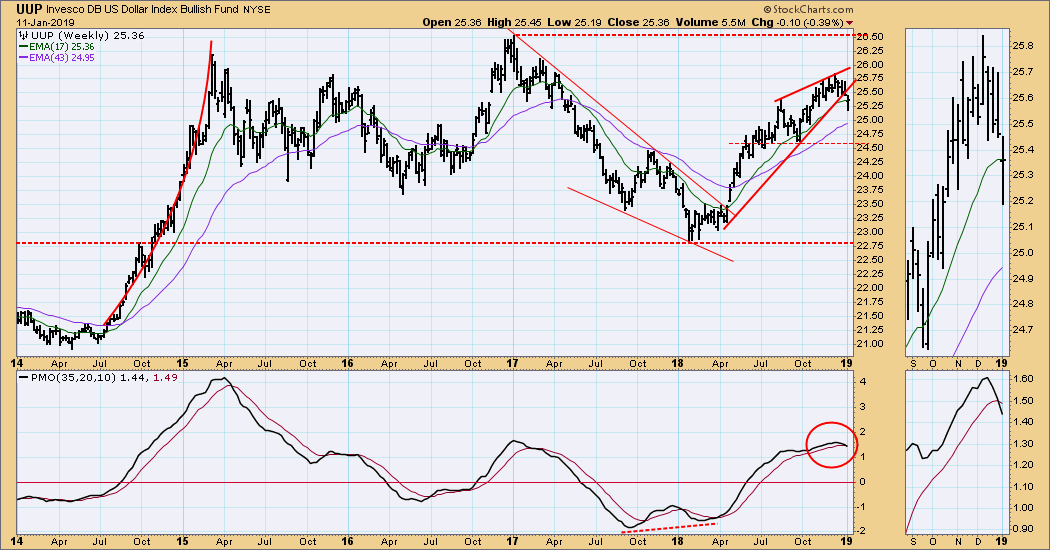
DOLLAR (UUP)
IT Trend Model: BUY as of 4/24/2018
LT Trend Model: BUY as of 5/25/2018
UUP Daily Chart: Close to neutral -- the 20EMA is about to cross down through the 50EMA, which will change the IT Trend Model from BUY to NEUTRAL.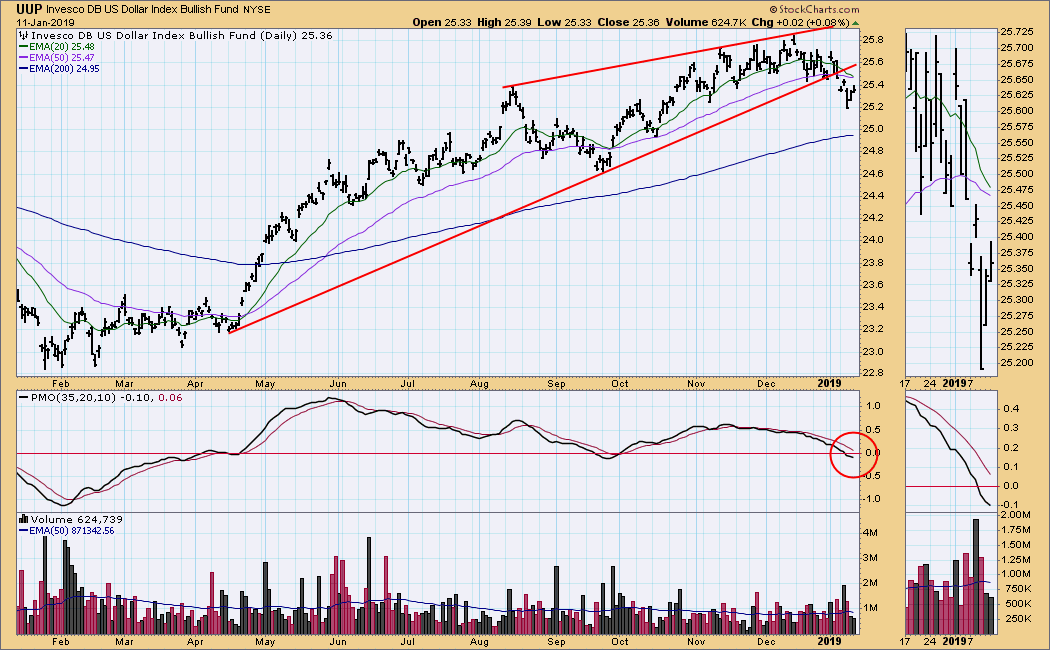
UUP Weekly Chart: Very negative. The rising wedge breakdown has been followed by weekly PMO downside crossover, which most likely means more price decline.
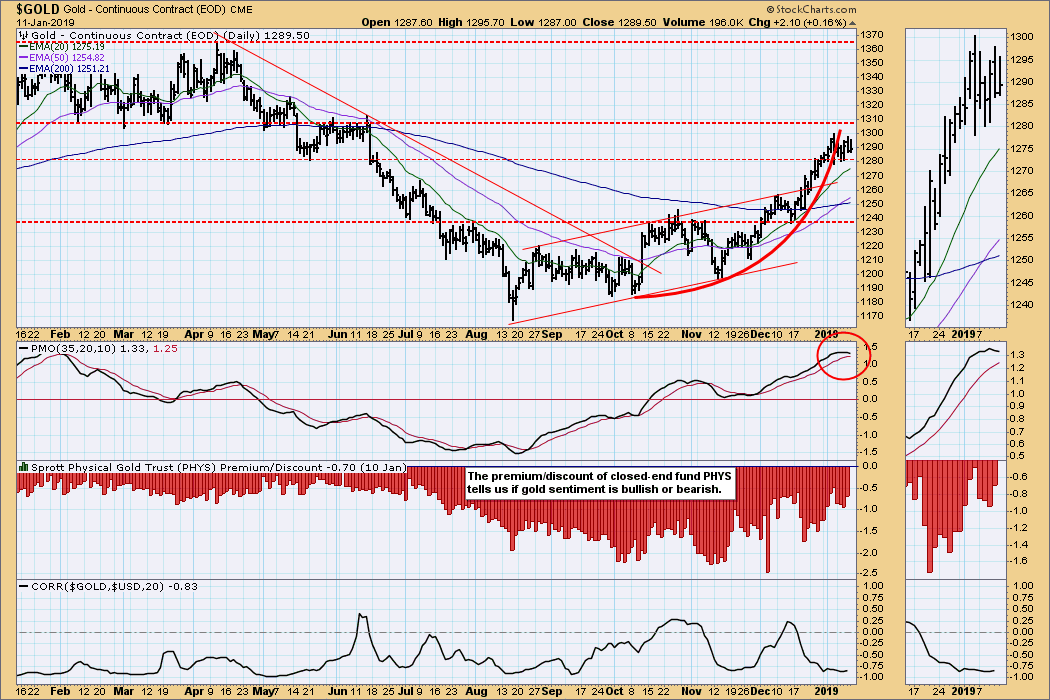
GOLD
IT Trend Model: BUY as of 10/19/2018
LT Trend Model: BUY as of 1/8/2019
GOLD Daily Chart: On Monday the 50EMA crossed up through the 200EMA, generating an LT Trend Model BUY signal. The mini-parabolic that I recently identified has resolved by price moving sideways through the arc instead of a breakdown. The daily PMO is overbought and has topped, so a pullback could still be in the cards.
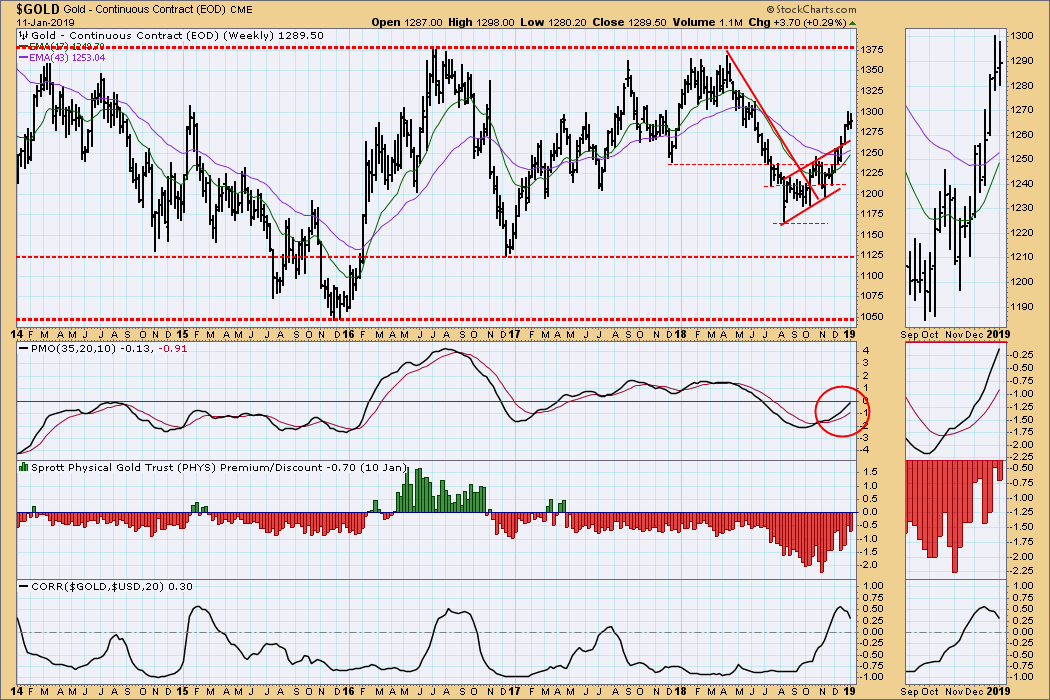
GOLD Weekly Chart: Positive. The weekly PMO looks strong, and the next obvious resistance is well above at 1375.
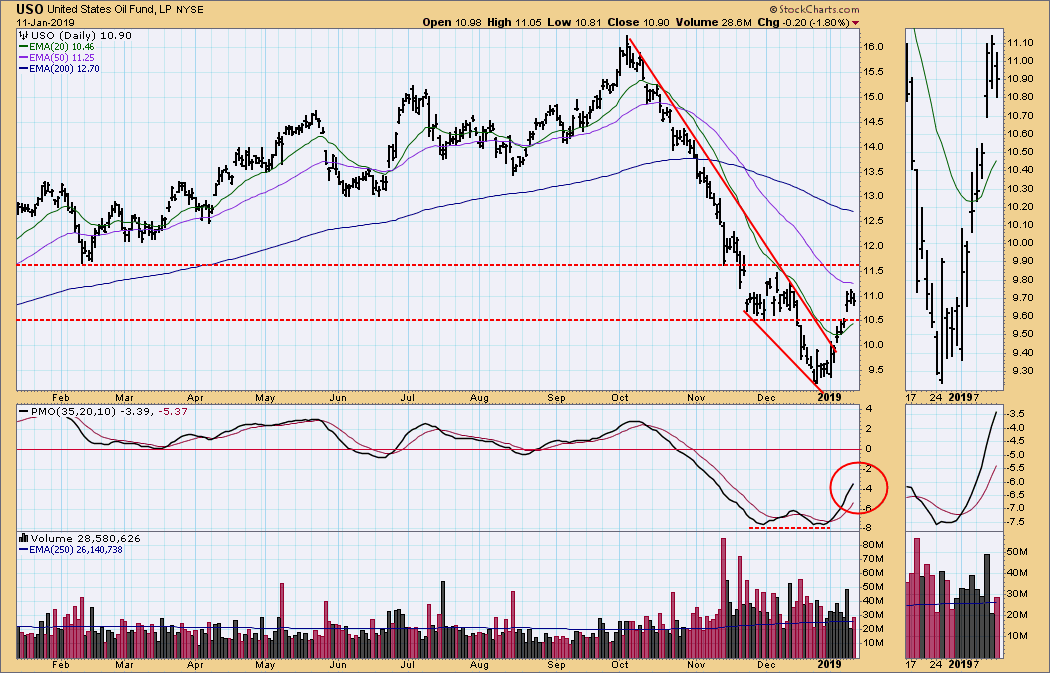
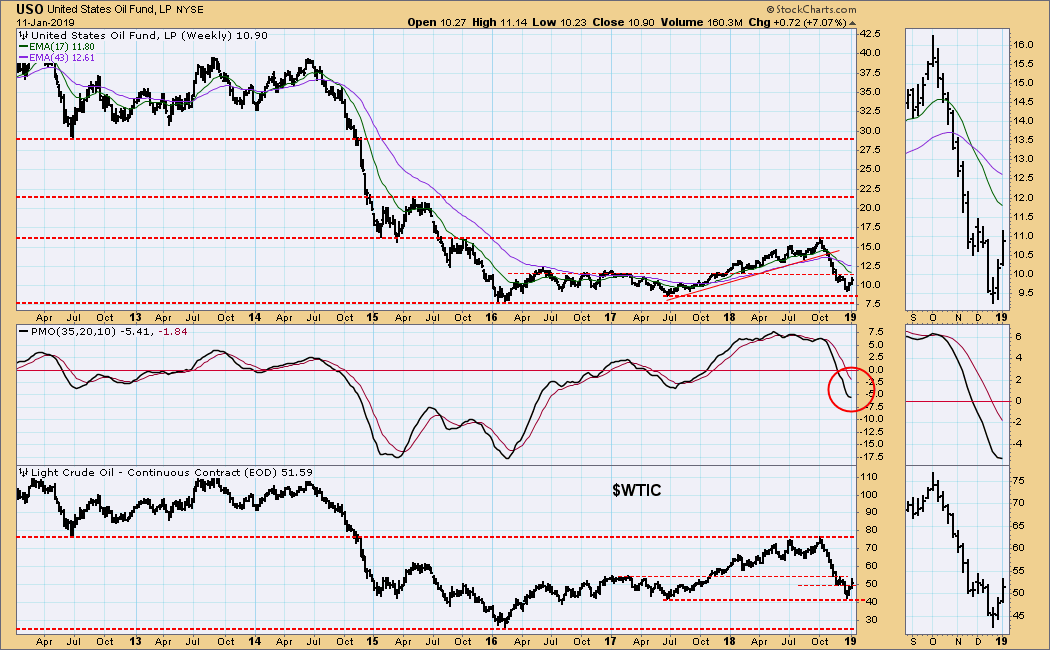
CRUDE OIL (USO)
IT Trend Model: NEUTRAL as of 10/29/2018
LT Trend Model: SELL as of 11/23/2018
USO Daily Chart: Here we see a falling wedge that has resolved upward, as expected. Note the PMO positive divergence.
USO Weekly Chart: Positive. Crude ($WTIC) has found support at 40, and the weekly PMO is about to turn up.
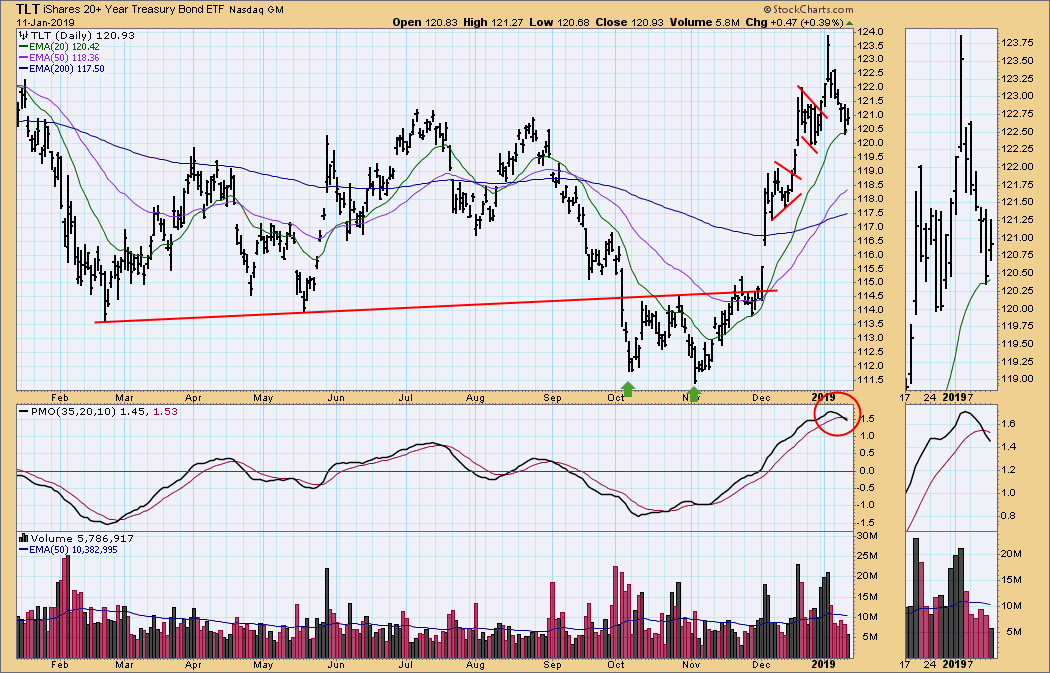
BONDS (TLT)
IT Trend Model: BUY as of 12/6/2018
LT Trend Model: BUY as of 1/2/2019
TLT Daily Chart: The daily PMO is below the signal line and falling, and price appears to be topping.
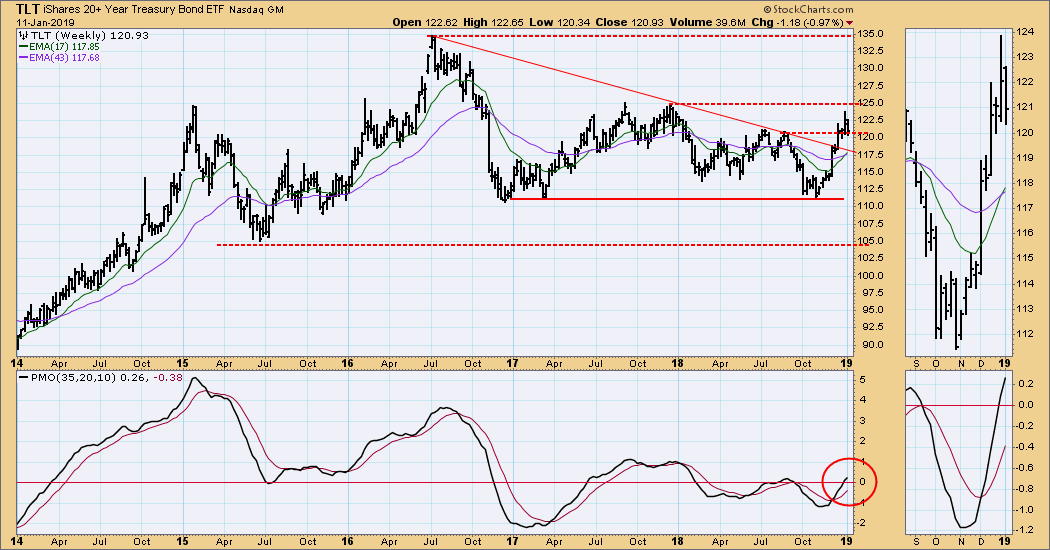
TLT Weekly Chart: The weekly PMO is moving up with no sign of reversing, so the picture remains positive in this time frame.
**Don't miss any of the DecisionPoint commentaries! Go to the "Notify Me" box toward the end of this blog page to be notified as soon as they are published.**
Technical Analysis is a windsock, not a crystal ball.
Happy Charting!
- Carl
NOTE: The signal status reported herein is based upon mechanical trading model signals, specifically, the DecisionPoint Trend Model. They define the implied bias of the price index based upon moving average relationships, but they do not necessarily call for a specific action. They are information flags that should prompt chart review. Further, they do not call for continuous buying or selling during the life of the signal. For example, a BUY signal will probably (but not necessarily) return the best results if action is taken soon after the signal is generated. Additional opportunities for buying may be found as price zigzags higher, but the trader must look for optimum entry points. Conversely, exit points to preserve gains (or minimize losses) may be evident before the model mechanically closes the signal.
Helpful DecisionPoint Links:
DecisionPoint Shared ChartList and DecisionPoint Chart Gallery
Price Momentum Oscillator (PMO)
Swenlin Trading Oscillators (STO-B and STO-V)