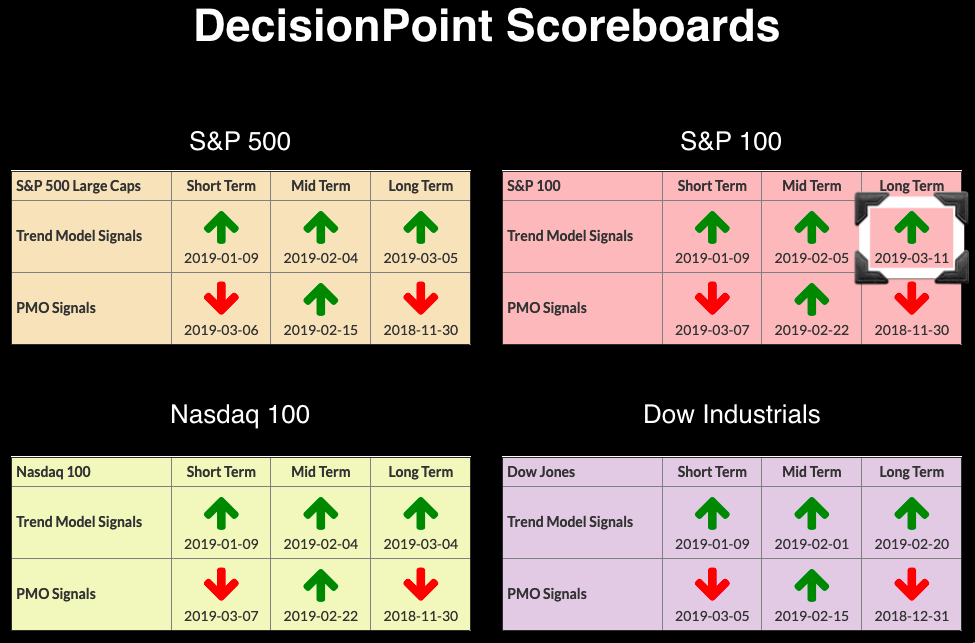
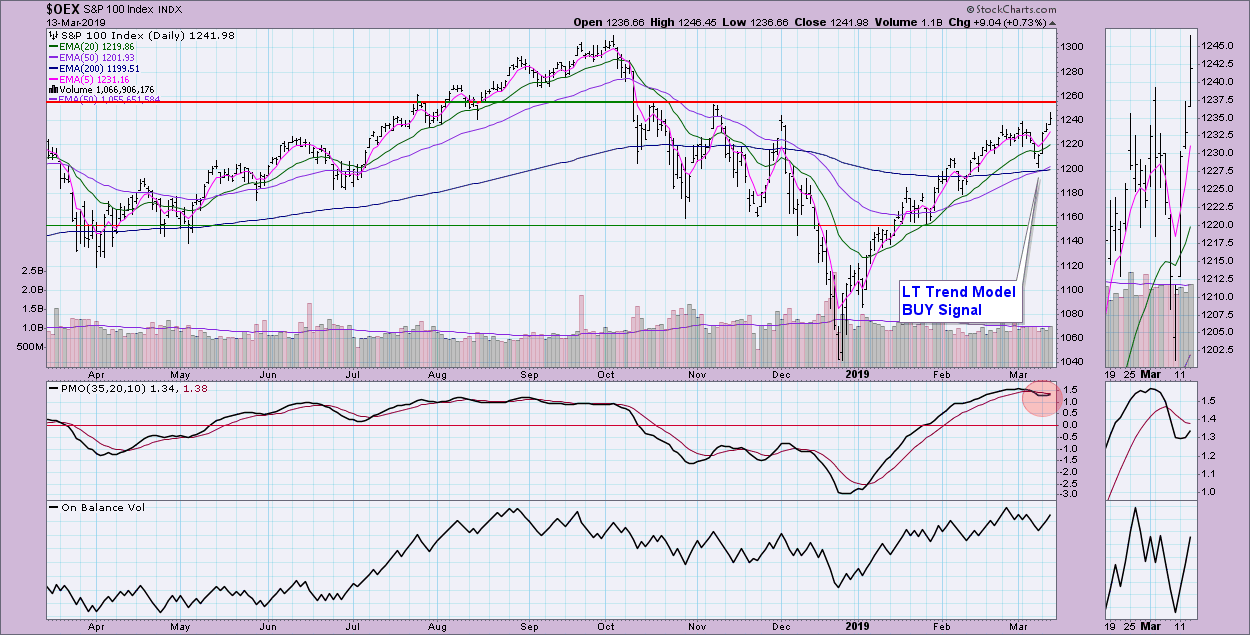
We have a new signal to add to the DecisionPoint Scoreboards, as the OEX triggered a Long-Term BUY signal on Monday. All of the large-cap Scoreboard indexes are now on Trend Model BUY signals in three timeframes. Additionally, we acquired two new BUY signals on Oil and Bonds, which I'll cover in the sections below. To our DP faithful, don't miss this Friday's show at 4:30p EST, where Carl and I will go through the major markets as well as the Big Four. Each week, we also add a "bonus" segment with charts that we believe you must see before starting the week ahead.
The DecisionPoint Alert presents a mid-week assessment of the trend and condition of the stock market (S&P 500), the U.S. Dollar, Gold, Crude Oil and Bonds.
Watch the latest episode of DecisionPoint on StockCharts TV's YouTube channel here!
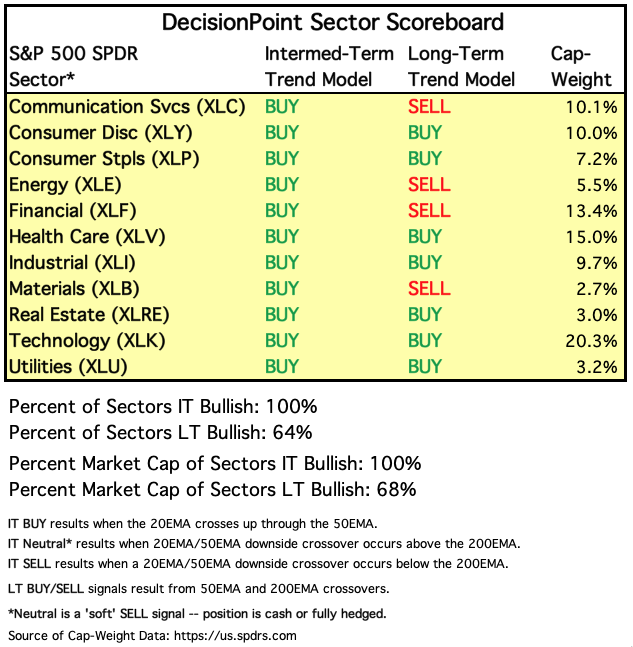
SECTORS
Each S&P 500 Index component stock is assigned to one, and only one, of eleven major sectors. This is a snapshot of the Intermediate-Term and Long-Term Trend Model signal status for those sectors.
STOCKS
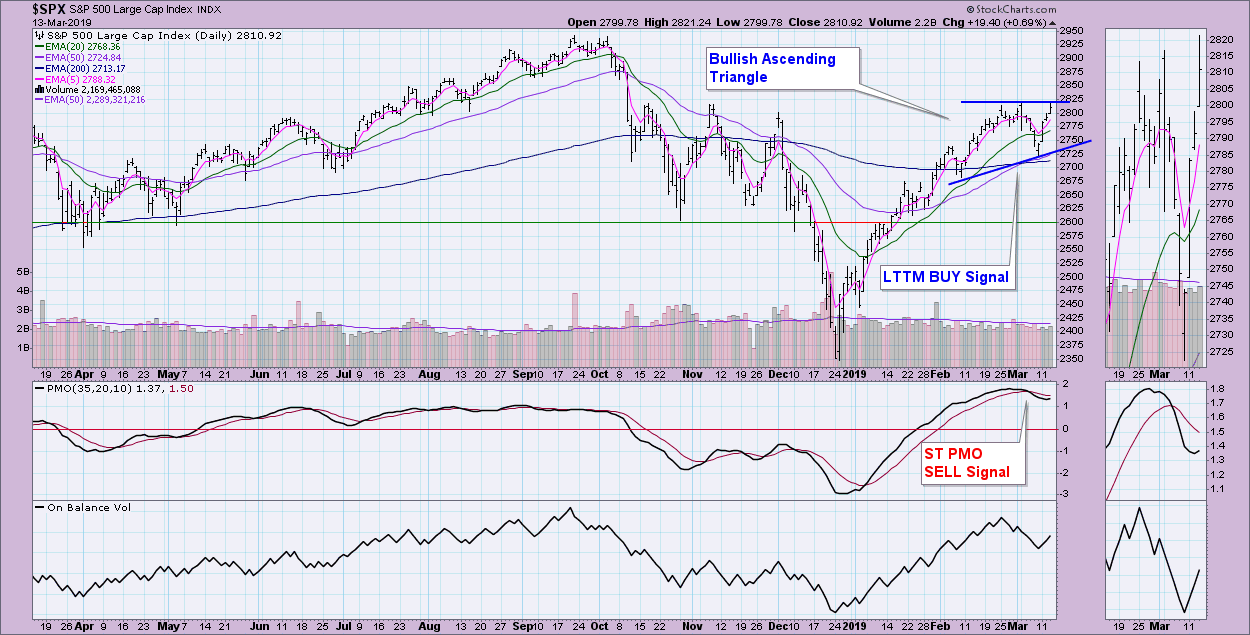
IT Trend Model: BUY as of 2/1/2019
LT Trend Model: BUY (SPY) as of 2/26/2019
SPY Daily Chart: Price has hit overhead resistance; however, given the bullish price pattern and PMO turning up, the expectation should be a breakout to the upside. It certainly appears that the worst is likely behind us - I'm not expecting to see December lows tested at this point. My solid bearish stance is moving more neutral. Underneath the daily chart is the monthly chart. The monthly PMO is finally decelerating enough that I'm moving to Neutral.
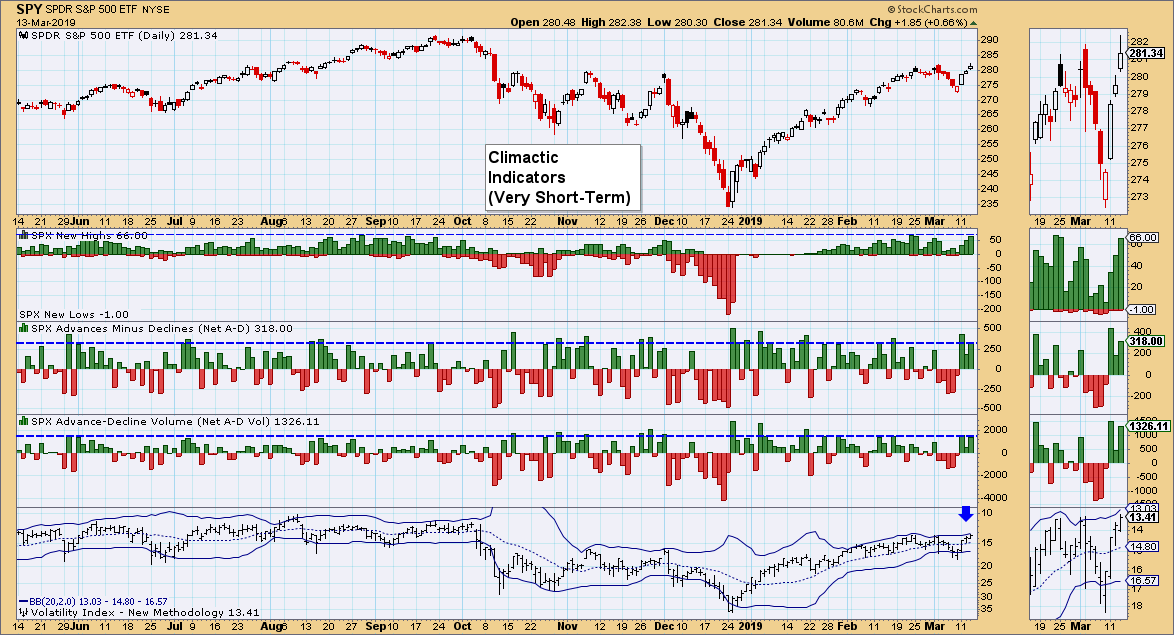
Climactic Market Indicators: In the very short term, I see a buying exhaustion lining up. The VIX has nearly broken above the upper Bollinger Band, which indicates too much complacency on the part of investors. Sentiment is contrarian, which means this is going to be bearish. With new highs continuing to rise, I think the market could eke out another rally tomorrow, but price has hit overhead resistance. I'm looking for a decline at the end of the week or the beginning of next week.
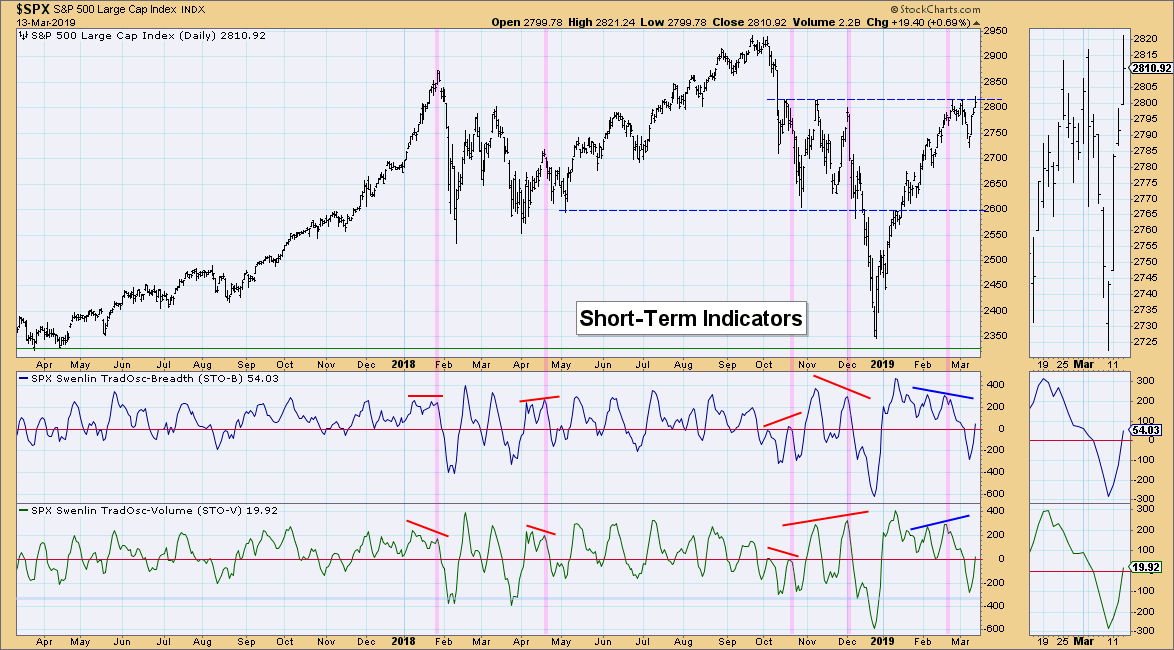
Short-Term Market Indicators: It looks like the divergence between STOs has cleared with the pullback. With both rising and moving just above the zero line, I would look for an eventual upside breakout above 2820.
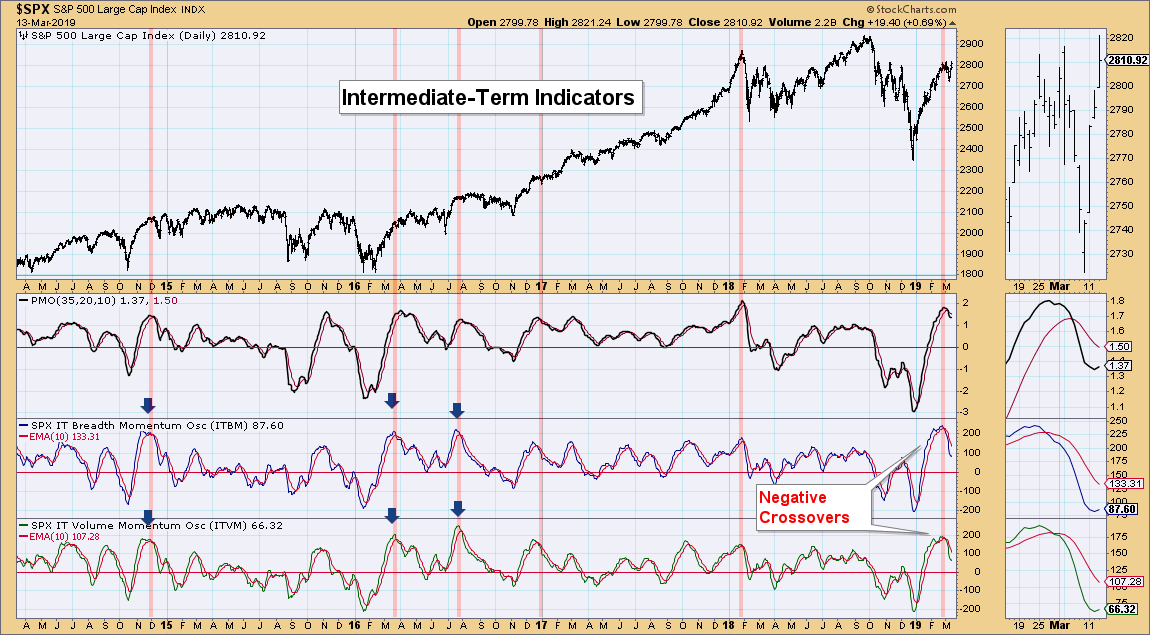
Intermediate-Term Market Indicators: It appears that our IT indicators are making an about face. This is positive, but I won't get too excited until I see a positive crossover on both of these.
Conclusion: With price moving above 2820 today and indicators certainly still healthy in the short term, I would expect to see a breakout following the very short-term decline at the end of this week or the beginning of the next. A correction is still a possibility in the intermediate term, at least until I see positive crossovers on our IT indicators. For now, I see a buying exhaustion setting up on breadth, which should lead to lower prices for a day or two.
DOLLAR (UUP)
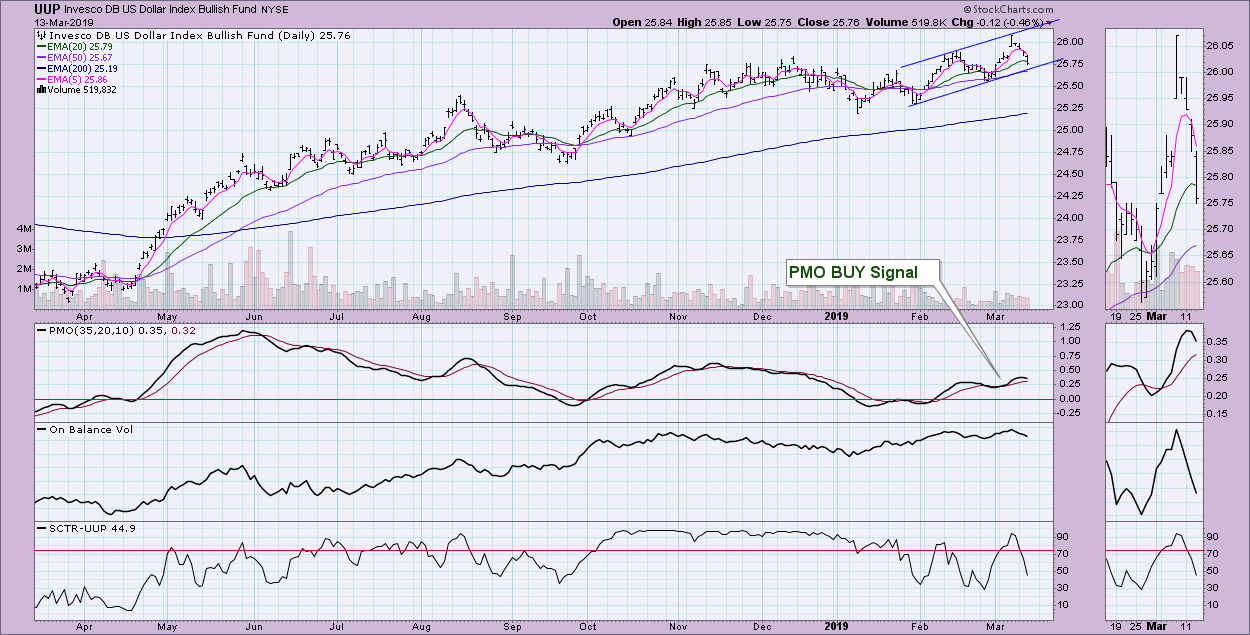
IT Trend Model: BUY as of 2/7/2019
LT Trend Model: BUY as of 5/25/2018
UUP Daily Chart: The Dollar is still in a rising trend. The last PMO top was higher than the previous, which suggests the trend should continue. I don't like the dive on the SCTR. In the short term, of course, a PMO top isn't positive. However, I just don't see serious deterioration of the trend. We will certainly know more when support is hit at the bottom of the rising trend channel.
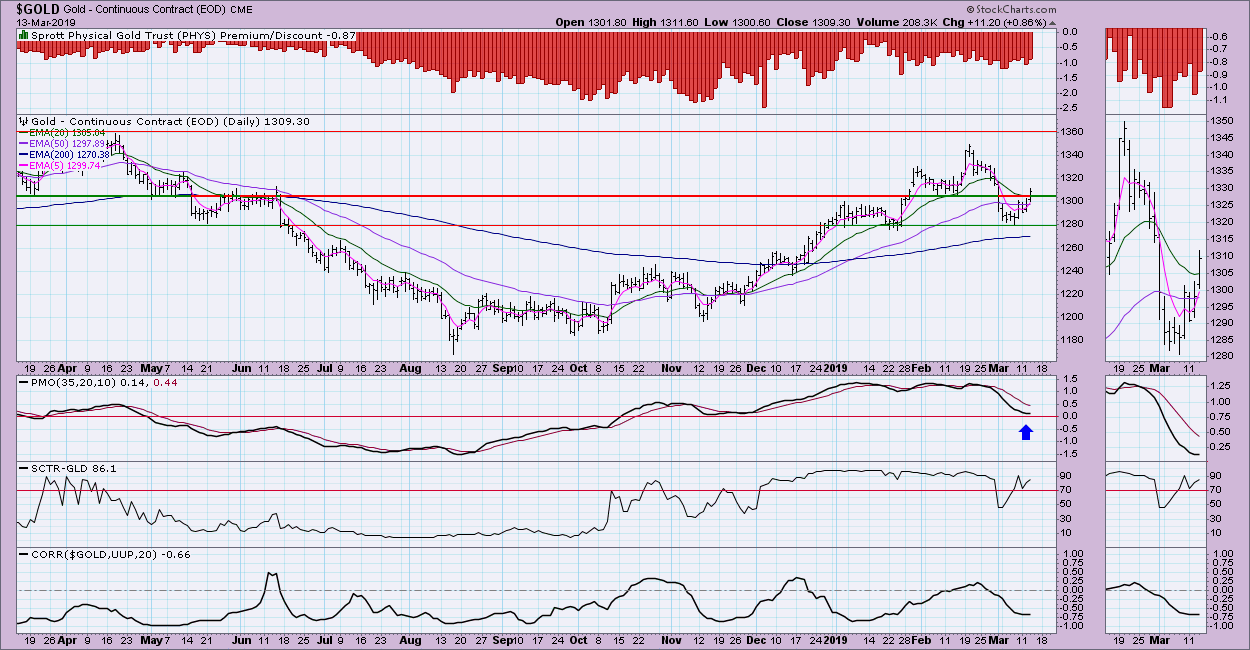
GOLD
IT Trend Model: BUY as of 10/19/2018
LT Trend Model: BUY as of 1/8/2019
GOLD Daily Chart: The PMO has decelerated and is heading higher above the zero line. This is a positive development, as is the breakout today. I am looking for higher prices.
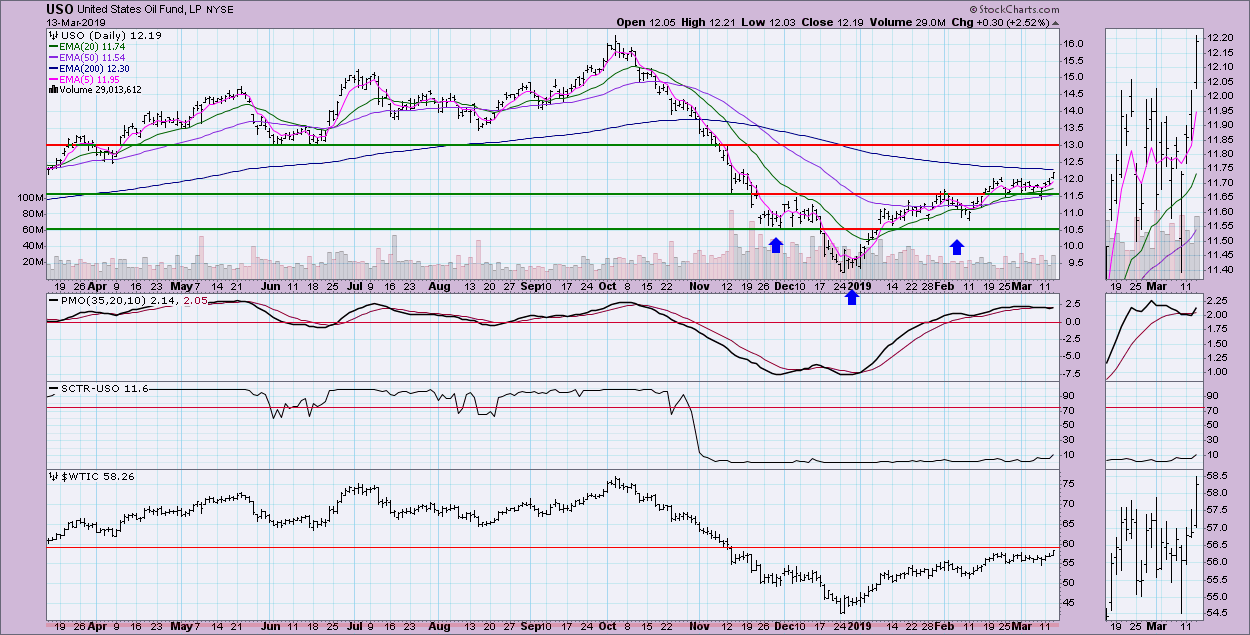
CRUDE OIL (USO)
IT Trend Model: BUY as of 2/19/2019
LT Trend Model: SELL as of 11/23/2018
USO Daily Chart: The PMO BUY signal comes off a whipsaw SELL signal. I've been watching a somewhat non-traditional reverse head and shoulders. The recent consolidation zone was finally broken; I now believe it is ripe to reach overhead resistance at $13. The biggest concern would be an overbought PMO, but we've seen it hit lows at -7.5, meaning +5 or more is certainly possible. $WTIC is pushing against overhead resistance from March of last year, but, like USO in the very short term, you can see in the thumbnail that crude also broke out from a short-term consolidation zone.
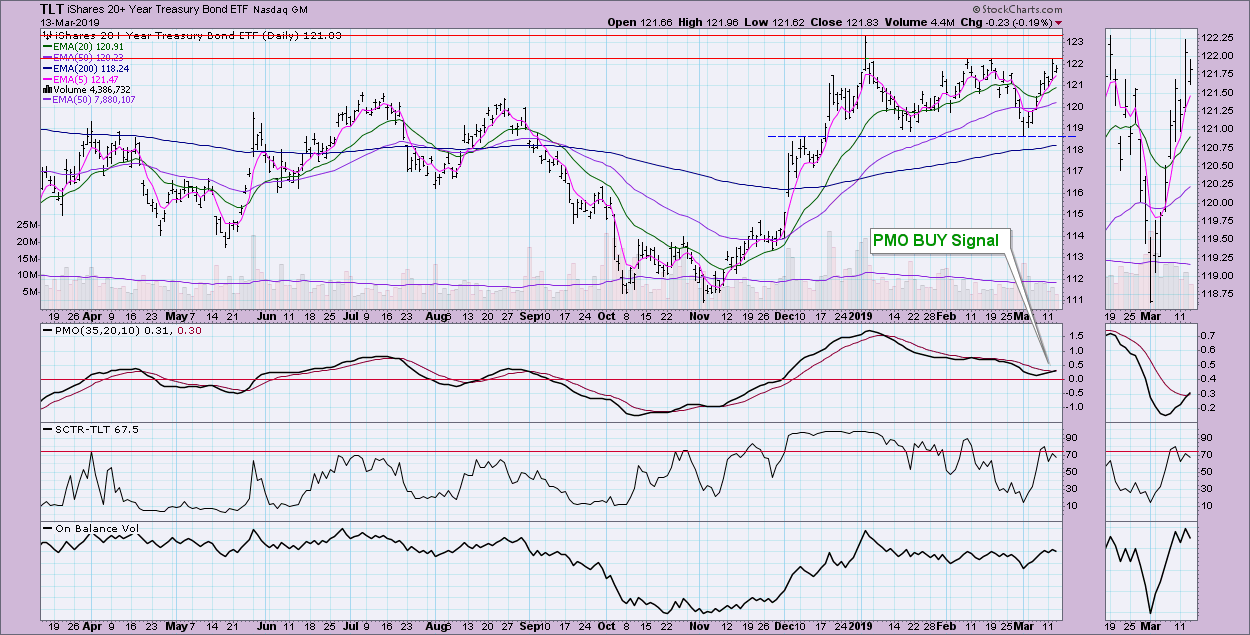
BONDS (TLT)
IT Trend Model: BUY as of 12/6/2018
LT Trend Model: BUY as of 1/2/2019
TLT Daily Chart: Bonds look very healthy. We just got a new Short-Term PMO BUY signal. Price is up against resistance, but, given the rising OBV and PMO, I'm looking for a test of overhead resistance at the January top.
Technical Analysis is a windsock, not a crystal ball.
Happy Charting!
- Erin
**Don't miss any of the DecisionPoint commentaries! Go to the "Notify Me" box toward the end of this blog page to be notified as soon as they are published.**
NOTE: The signal status reported herein is based upon mechanical trading model signals, specifically the DecisionPoint Trend Model. These define the implied bias of the price index based upon moving average relationships, but they do not necessarily call for a specific action. They are information flags that should prompt chart review. Further, they do not call for continuous buying or selling during the life of the signal. For example, a BUY signal will probably (but not necessarily) return the best results if action is taken soon after the signal is generated. Additional opportunities for buying may be found as price zigzags higher, but the trader must look for optimum entry points. Conversely, exit points to preserve gains (or minimize losses) may be evident before the model mechanically closes the signal.
Helpful DecisionPoint Links:
DecisionPoint Shared ChartList and DecisionPoint Chart Gallery
Price Momentum Oscillator (PMO)
Swenlin Trading Oscillators (STO-B and STO-V)