Don't Ignore This Chart! July 31, 2009 at 01:13 PM
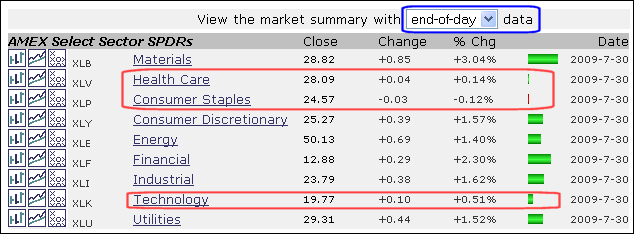
The market summary page provides an excellent overview of market performance, both end-of-day and intraday. You can change the setting at the top. Notice that materials led the market on Thursday, while healthcare, consumer staples and technology lagged... Read More
Don't Ignore This Chart! July 30, 2009 at 01:30 PM
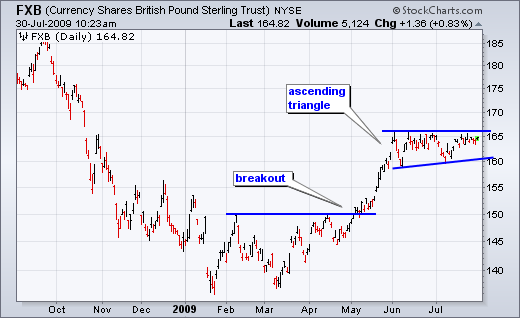
After a breakout and surge from March to May, the British Pound ETF (FXB) consolidated with an ascending triangle over the last two months. Notice how FXB hit resistance at 165 a number of times since early June... Read More
Don't Ignore This Chart! July 29, 2009 at 01:48 PM
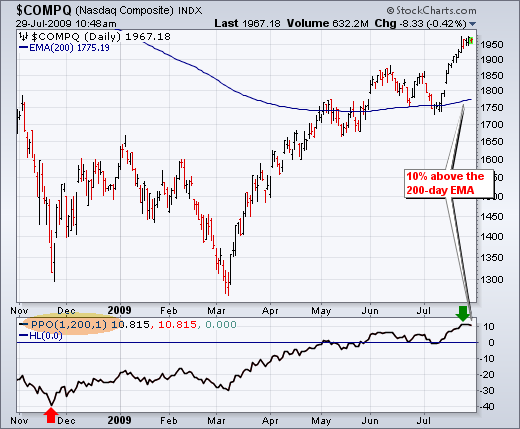
In less than 9 months, the Nasdaq has gone from being 40% below its 200-day EMA to being 10% above its 200-day EMA. Talk about a huge swing. The percentage difference was determined using the Percentage Price Oscillator (1,200,1)... Read More
Don't Ignore This Chart! July 28, 2009 at 02:16 PM
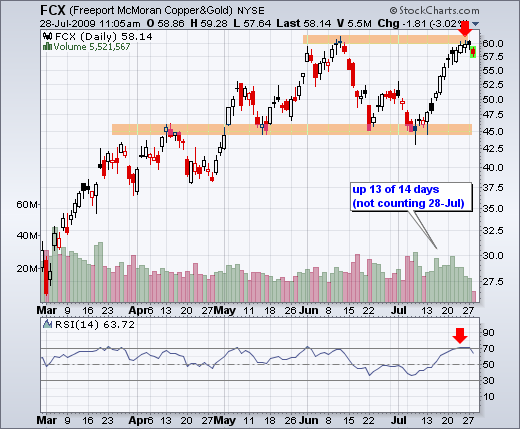
Freeport McMoran Copper & Gold (FCX) kept pace with the Nasdaq by advancing 13 of the last 14 days. In the process, the stock surged to its June high, which may offer resistance. Also notice that RSI moved above 70 to become overbought... Read More
Don't Ignore This Chart! July 27, 2009 at 05:53 PM
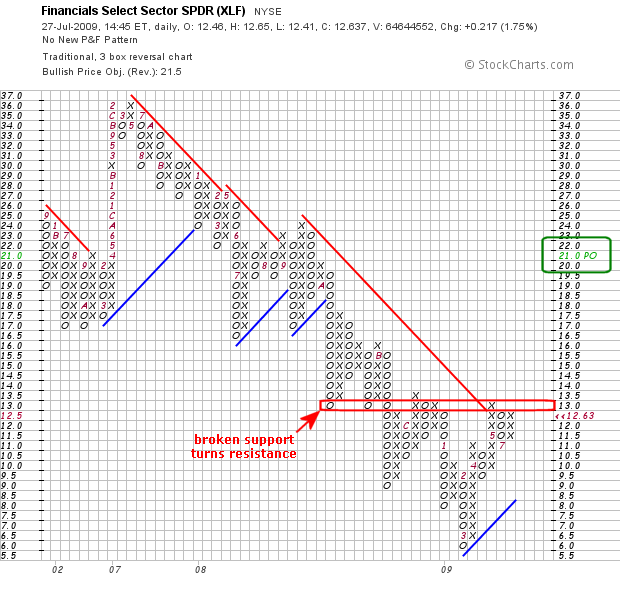
With gains over the last few days, the Financials SPDR (XLF) is challenging an important resistance zone on the daily PnF chart. Notice that broken support (2008) around 13 turned into resistance in 2009. XLF is currently on a bullish PnF signal with a price objective around 21... Read More
Don't Ignore This Chart! July 24, 2009 at 01:20 PM
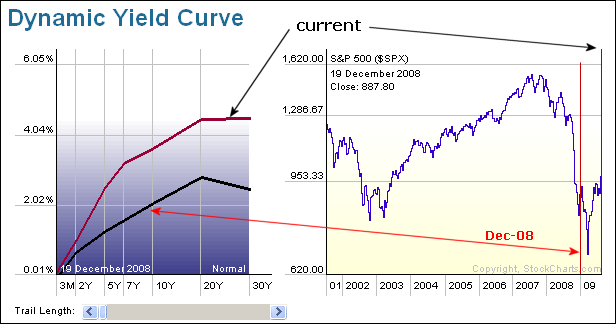
The Dynamic Yield Curve shows two plots over the last eight months. The black line shows the yield curve in December, while the maroon line shows the current yield curve... Read More
Don't Ignore This Chart! July 23, 2009 at 01:50 PM
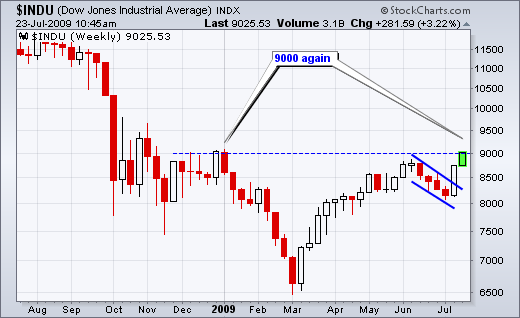
For the first time since January, the Dow Industrials moved above the 9000 level. It took around two months to fall from 9000 to 6500 and then 4-5 months to get back above 9000 (March to July)... Read More
Don't Ignore This Chart! July 22, 2009 at 01:48 PM
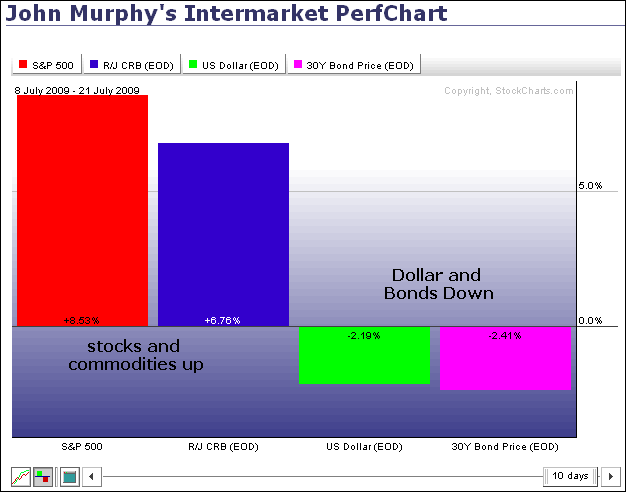
The inter-market relationship since early March remains in place. Stocks and commodities are up sharply over the last two weeks, but bonds and the Dollar are down... Read More
Don't Ignore This Chart! July 21, 2009 at 02:37 PM
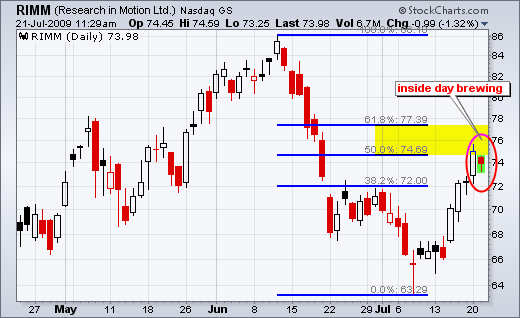
After a long white candlestick on Monday, Research in Motion (RIMM) pulled back immediately on Tuesday with a small decline. Tuesday's trading has been within Monday's range thus far. Should this range hold, an inside day or harami would take shape... Read More
Don't Ignore This Chart! July 20, 2009 at 05:39 PM
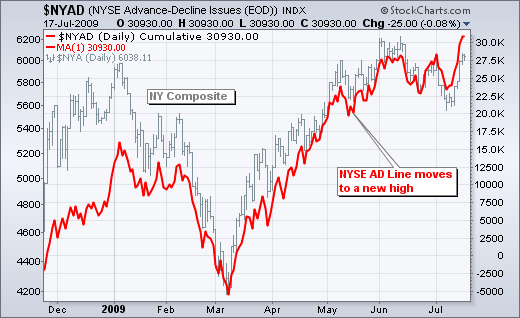
The AD Line for the NYSE remains strong after a break above the June high. In fact, the AD Line is leading the NY Composite because the latter has yet to break its June high. Leadership from the AD Line is positive for the market overall... Read More
Don't Ignore This Chart! July 17, 2009 at 12:30 PM
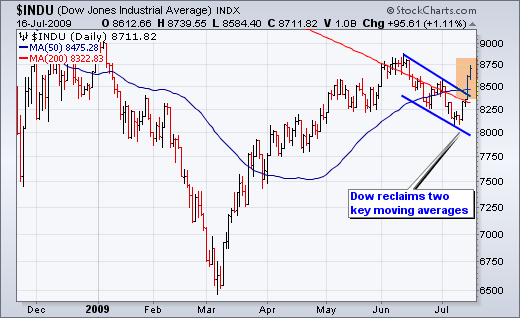
With a surge back above 8500 this week, the Dow Industrials reclaimed the upper ground on the 50-day and 200-day moving averages. Also notice that the 50-day SMA moved above the 200-day SMA. This is also knows as a golden cross... Read More
Don't Ignore This Chart! July 16, 2009 at 01:28 PM
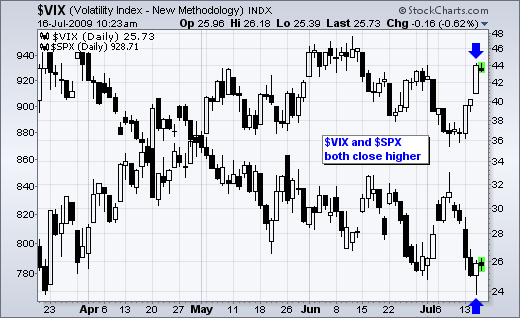
Despite a big surge in the S&P 500 on Wednesday, the S&P 500 Volatility Index ($VIX) recovered from early losses and closed higher on the day. This is unusual because the VIX normally declines during a sharp stock market advance. It is just one day though... Read More
Don't Ignore This Chart! July 15, 2009 at 01:44 PM
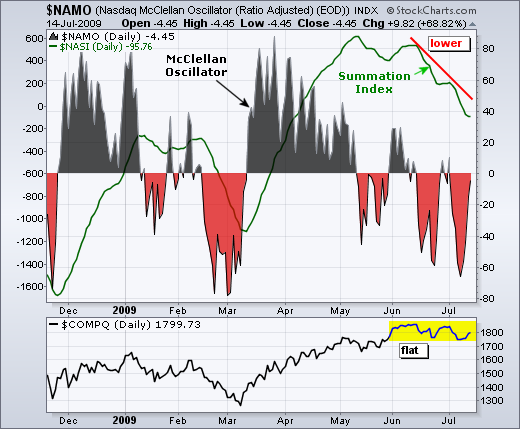
Even though the Nasdaq is trading above its mid May levels, the Nasdaq Summation Index (green line) is trending lower. This breadth indicator suggests that a "stealth" correction is underway within the Nasdaq... Read More
Don't Ignore This Chart! July 14, 2009 at 01:31 PM
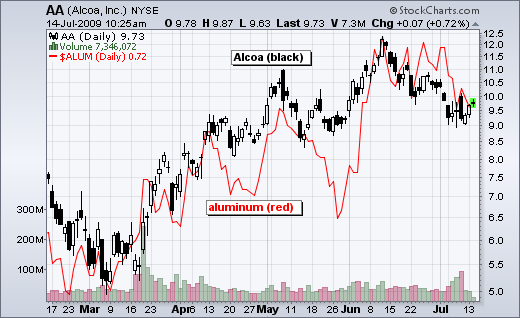
The chart below shows Alcoa (AA) with black candlesticks and the continuous futures contract for Aluminum ($ALUM). Although not perfect, there is clearly a positive correlation between the two. Overall, both have been working their way higher since March... Read More
Don't Ignore This Chart! July 13, 2009 at 06:19 PM
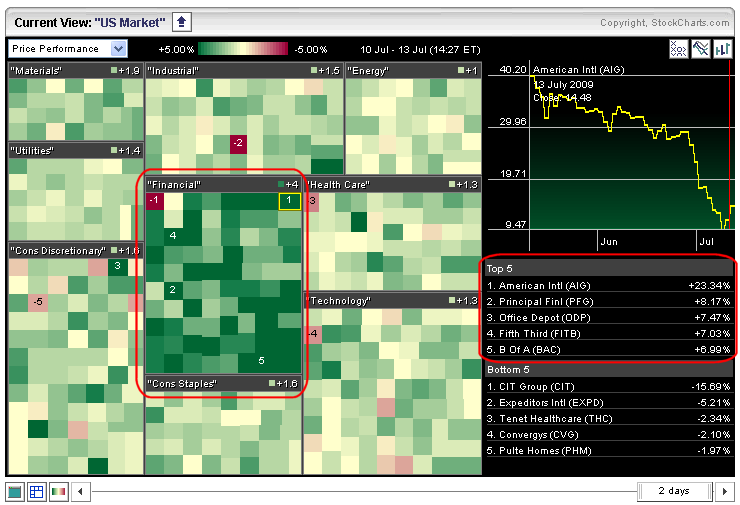
A look at the market carpet for Monday reveals strength in the finance sector. All sectors are up today, but the finance sector shows the most, and the darkest, green on the carpet... Read More
Don't Ignore This Chart! July 10, 2009 at 01:10 PM
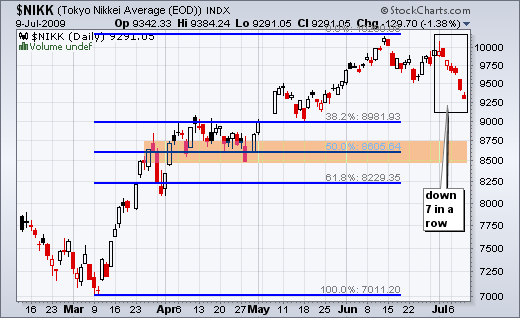
With another down day on Thursday, the Nikkei 225 ($NIKK) has now declined seven days in a row. Even though it is getting short-term oversold, it looks like a medium-term downtrend is taking shape... Read More
Don't Ignore This Chart! July 09, 2009 at 12:45 PM
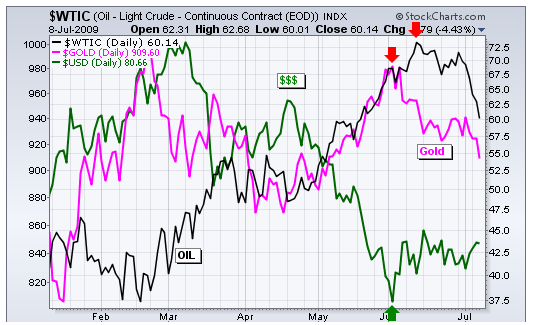
June witnessed a change in inter-market dynamics. The US Dollar Index ($USD) bounced at the beginning of June while the Gold-Continuous Futures ($GOLD) and West Texas Intermediate ($WTIC) declined in June. Gold started down first with a move lower in early June... Read More
Don't Ignore This Chart! July 07, 2009 at 06:12 PM
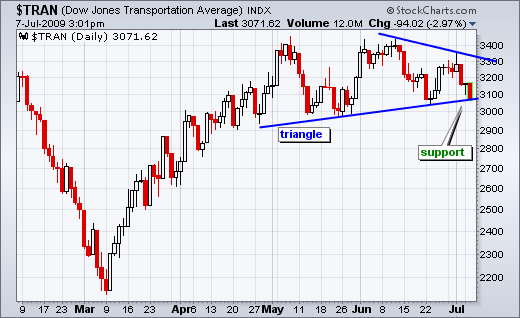
After forming a lower high last week, the Dow Transports declined to triangle support with a sharp move lower the last three days. As of 3PM ET on Tuesday, the Average was down over 8% from last week's high... Read More
Don't Ignore This Chart! July 06, 2009 at 02:06 PM
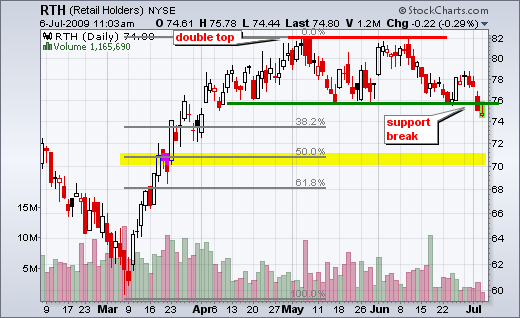
The Retail HOLDRS (RTH) broke below the May low with a sharp decline last week. Overall, it appears that a double top formed in May-June. The support break confirms the pattern and this ETF could retrace around 50% of its prior advance... Read More
Don't Ignore This Chart! July 03, 2009 at 01:43 PM
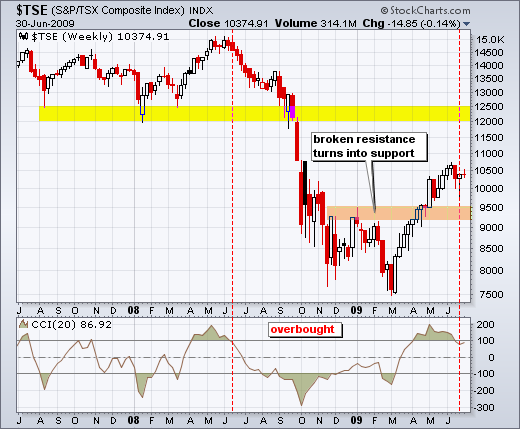
With a 3000 point surge the last few months, the S&P TSX Composite ($TSE) broke through resistance and CCI moved above +100. Both events are bullish, but the index looks vulnerable to a pullback. First, CCI moved back below +100... Read More
Don't Ignore This Chart! July 02, 2009 at 10:06 AM
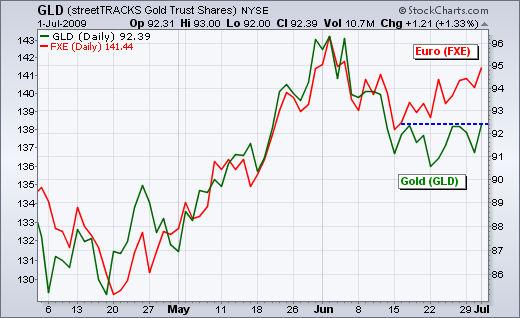
Gold normally moves with the Euro, but the yellow metal has not been keeping up the last few weeks. Notice how the Euro ETF (FXE) bottomed on 15-June and moved higher the last 2-3 weeks... Read More
Don't Ignore This Chart! July 01, 2009 at 10:52 AM
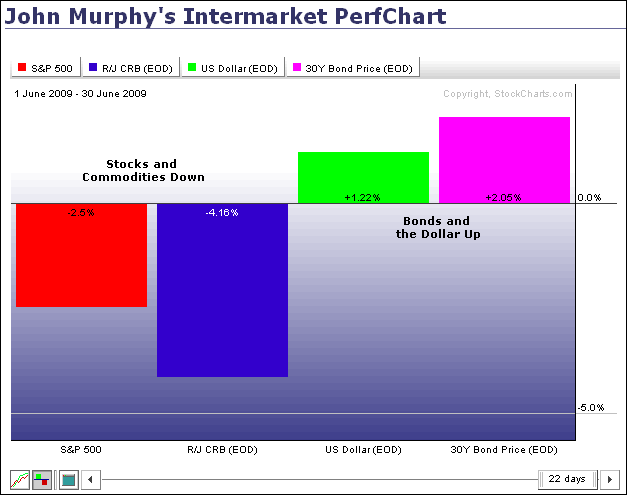
From John Murphy's intermarket perfchart, we can see that stocks (S&P 500) and commodities ($CRB) were down for the month of June. In contrast, Bonds ($USB) and the Dollar ($USD) were up. Strength in the greenback weighed on commodities... Read More