Don't Ignore This Chart! August 31, 2009 at 01:11 PM
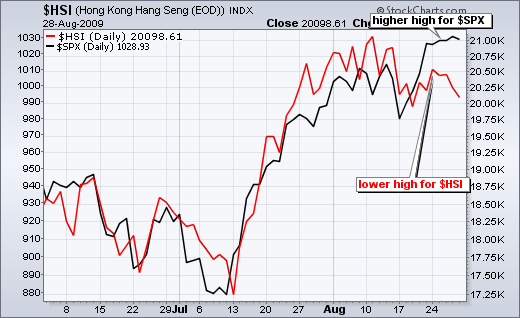
While the S&P 500 sports a small gain for the month of August, the Hong Kong Hang Seng Index ($HSI) is actually down and lagging. The S&P 500 (black) moved above its early August high last week, but the Hang Seng Index (red) formed a lower high... Read More
Don't Ignore This Chart! August 28, 2009 at 09:15 PM
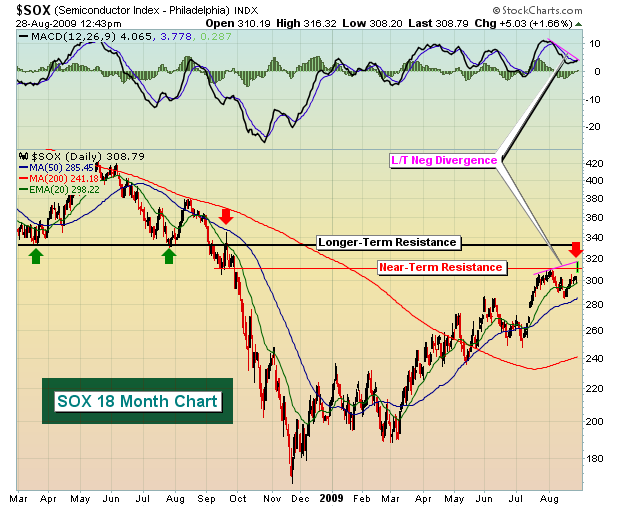
Once the SOX broke below the March and July lows of 2008, a new low close of 312 was established in mid-Sept 2008. After a move higher to quickly retest the earlier breakdown area, the SOX fell precipitously into late 2008... Read More
Don't Ignore This Chart! August 28, 2009 at 09:48 AM
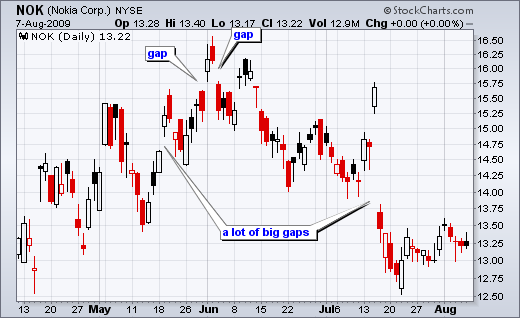
Nokia is a $49 billion company that trades on the NYSE - as an ADS (American Depository Shares). Nokia also happens to trade on the Nasdaq OMX Helsinki. Yes, Nasdaq bought the Helsinki exchange. Anyhow, this means Nokia starts trading long before the NYSE opens... Read More
Don't Ignore This Chart! August 27, 2009 at 09:46 AM
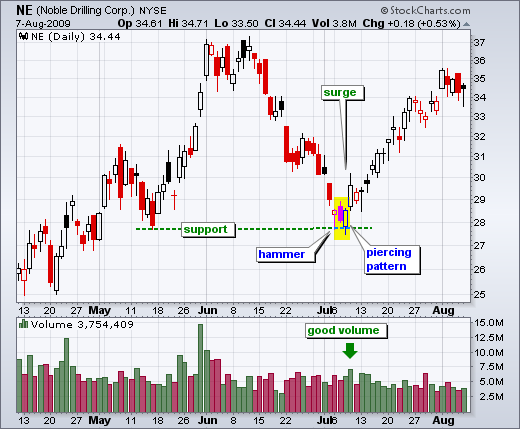
Candlesticks are more powerful when combined with other aspects of technical analysis. Noble Energy (NE) gapped down and formed a hammer in early July. Over the next two days, a piercing pattern formed to further affirm support around 28... Read More
Don't Ignore This Chart! August 26, 2009 at 09:44 AM
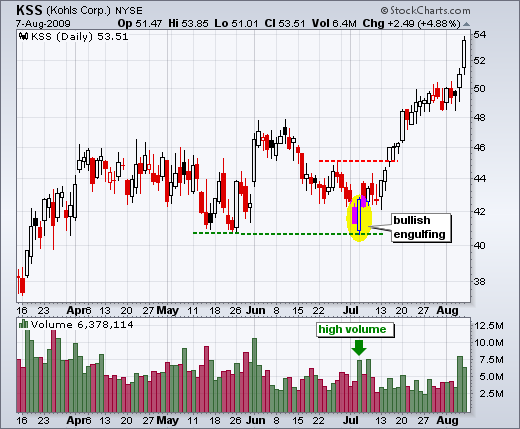
There are bullish engulfing patterns and then there are BULLISH ENGULFING patterns. Kohls (KSS) successfully tested support from its May lows with a bullish engulfing on high volume... Read More
Don't Ignore This Chart! August 25, 2009 at 09:42 AM
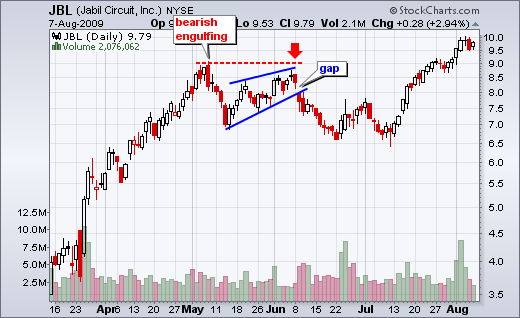
The bearish engulfing pattern is a short-term candlestick reversal, but it can also mark future resistance. Jabil Circuit (JBL) formed a bearish engulfing in early May and this area marked resistance a month later... Read More
Don't Ignore This Chart! August 24, 2009 at 09:42 AM
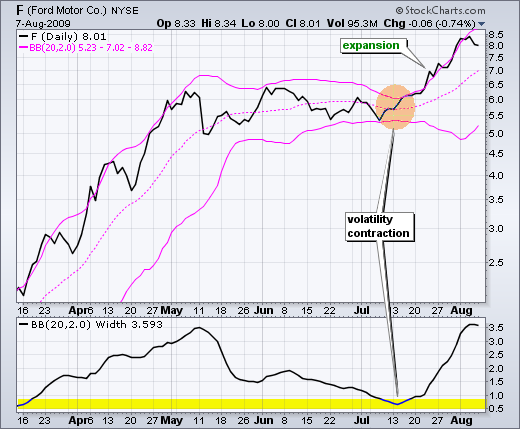
Volatility contractions often precede volatility expansions. This is the rational behind Bollinger Bands. After surging above 5.5, Ford (F) formed a long consolidation and Bollinger Bands contracted as the range narrowed... Read More
Don't Ignore This Chart! August 21, 2009 at 09:38 AM
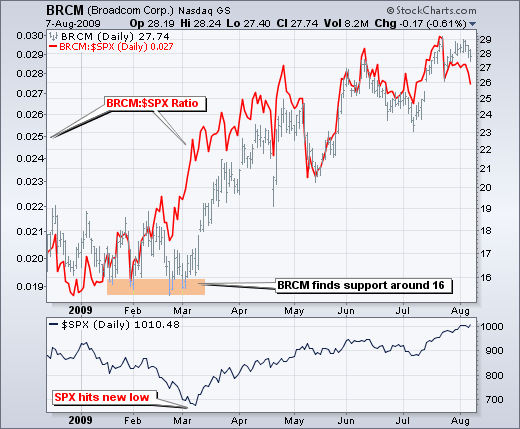
The price relative can be used to show relative strength or relative weakness. While the S&P 500 moved to new lows in March, Broadcom (BRCM) held support around 16 from mid January to early March... Read More
Don't Ignore This Chart! August 20, 2009 at 09:36 AM
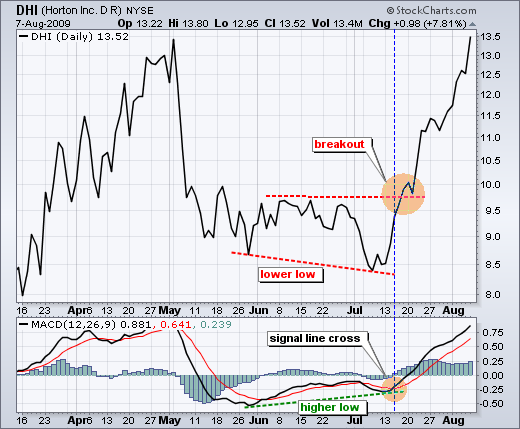
Positive divergences in MACD show waning downside momentum that can lead to a breakout. DR Horton (DHI) forged a lower low in early July, but MACD held above its June low for a positive divergence. Despite a lower low in the stock, downside momentum was fading... Read More
Don't Ignore This Chart! August 20, 2009 at 09:35 AM
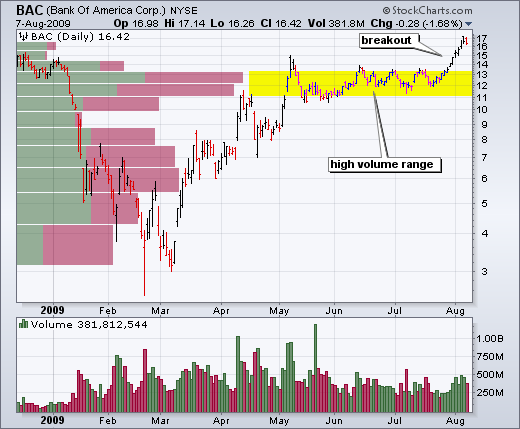
The volume-by-price bars for Bank of America were the longest between 11 and 13. Even though the red and green portions were relatively equal, it is clear that many positions were established in this range. Remember, there is a buyer for every seller... Read More
Don't Ignore This Chart! August 19, 2009 at 09:33 AM
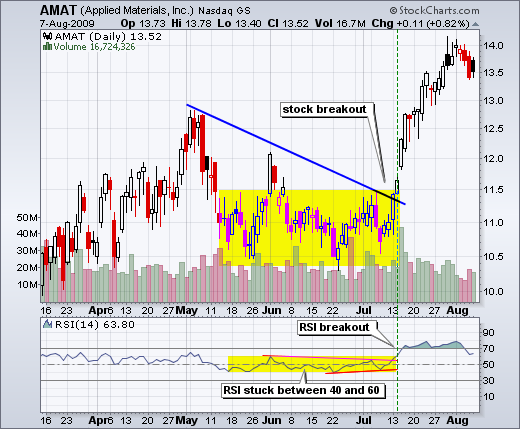
Momentum indicators like RSI can be used to define periods when there isn't much momentum, such as a consolidation. Applied Materials (AMAT) was largely range bound from mid May to mid July (yellow area). So was RSI... Read More
Don't Ignore This Chart! August 18, 2009 at 09:25 AM
The volume-by-price bars for Bank of America were the longest between 11 and 13. Even though the red and green portions were relatively equal, it is clear that many positions were established in this range. Remember, there is a buyer for every seller... Read More
Don't Ignore This Chart! August 17, 2009 at 09:20 AM
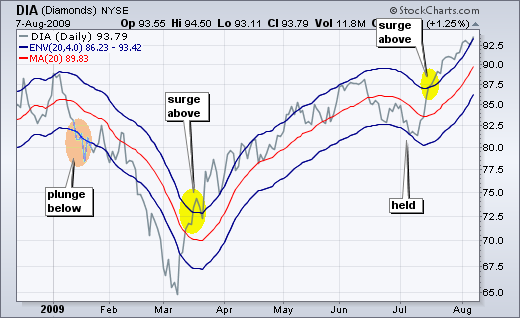
The chart below shows DIA with a 20-day SMA and an envelope set 4% above/below the 20-day SMA. Notice how the January plunge below the lower envelope triggered an extended decline. Conversely, the March surge above the upper envelope kicked off the current rally... Read More
Don't Ignore This Chart! August 14, 2009 at 10:42 AM
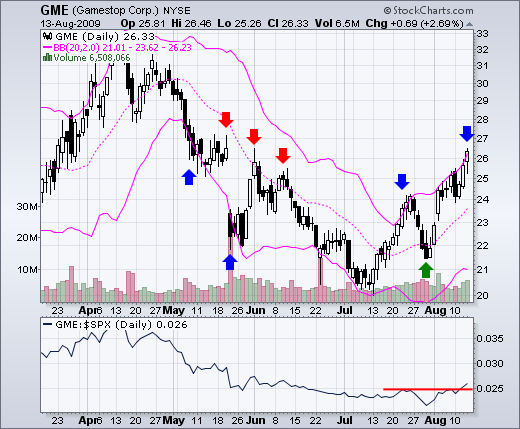
Gamestop (GME) came across the Bollinger Band screen with a move above the upper band on Thursday. Such moves show underlying strength... Read More
Don't Ignore This Chart! August 13, 2009 at 07:46 PM
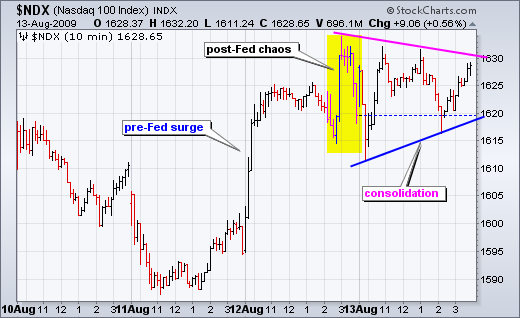
There are three distinct periods over the last two days. First, stocks surged as the Nasdaq 100 advanced above 1620 before the Fed meeting. Second, stocks gyrated rather wildly as NDX moved above and below 1620 after the announcement... Read More
Don't Ignore This Chart! August 12, 2009 at 02:37 PM
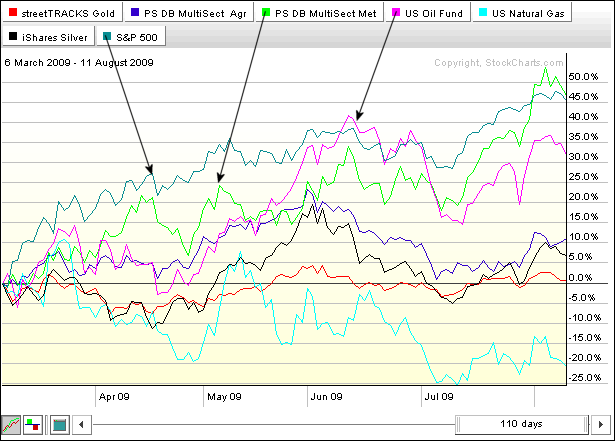
The PerfChart below shows the key commodity related ETFs and the S&P 500 since early March. As the stock market surged, the US Oil Fund ETF (USO) and the Base Metals ETF (DBB) were the only two commodity ETFs able to keep pace... Read More
Don't Ignore This Chart! August 11, 2009 at 06:04 PM
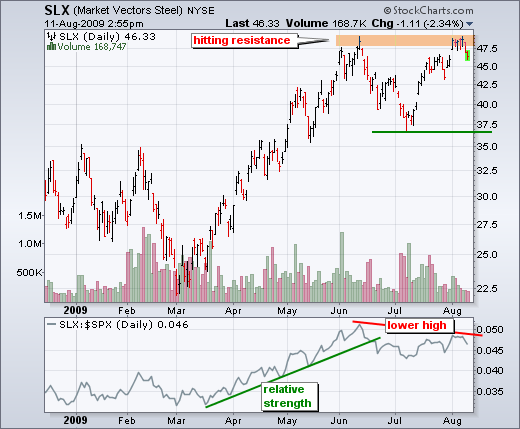
After surging to the June high, the Steel Vectors (SLX) met resistance and pulled back over the last two days. Notice that the August 3rd gap did not hold and the price relative formed a lower high. SLX is starting to show relative weakness... Read More
Don't Ignore This Chart! August 10, 2009 at 01:53 PM
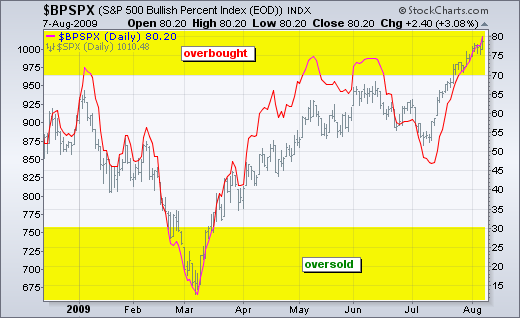
The S&P 500 Bullish Percent Index stands at 80%, its highest level since February 2007. Above 70% is generally regarded as overbought because this indicator spends most of its time fluctuating between 30% and 70%... Read More
Don't Ignore This Chart! August 07, 2009 at 12:18 PM
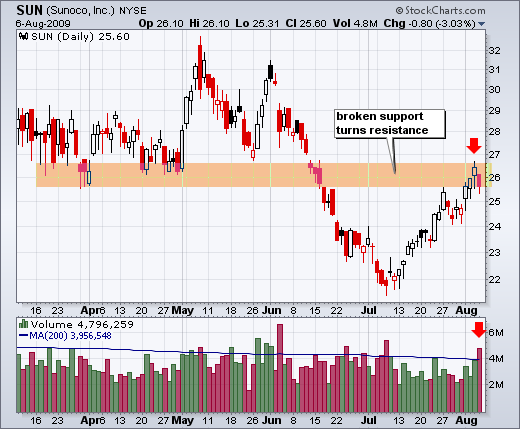
Sunoco (SUN) broke support around 26 with a sharp decline in June. After reversing course in early July, the stock surged back to broken support, which now turns into resistance. Notice how the stock pulled back with high volume on Thursday. This is a big resistance test... Read More
Don't Ignore This Chart! August 06, 2009 at 12:38 PM
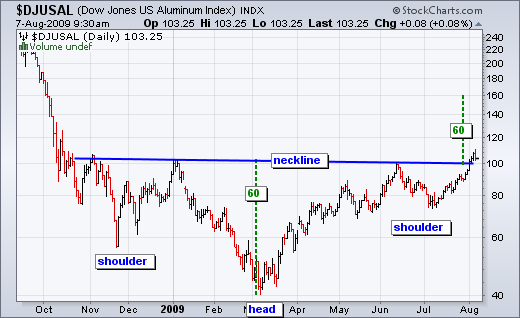
The DJ US Aluminum Index ($DJUSAL) traced out a massive inverse head-and-shoulders over the last nine months and broke above neckline resistance this week. With this pattern representing a large base, the breakout is bullish and targets further strength towards 140... Read More
Don't Ignore This Chart! August 05, 2009 at 10:00 AM
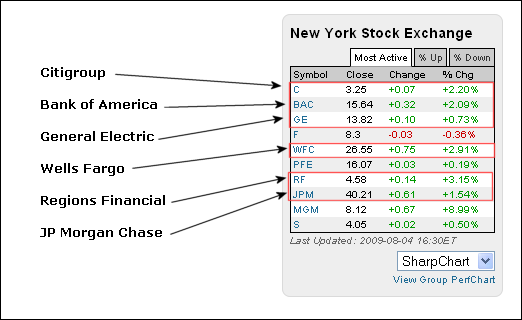
From the NYSE most active list on the stockcharts.com home page, we can see that banks take up half the list (5 of 10). Although not a bank, GE has a large financial services arm and was third on the list... Read More
Don't Ignore This Chart! August 03, 2009 at 05:18 PM
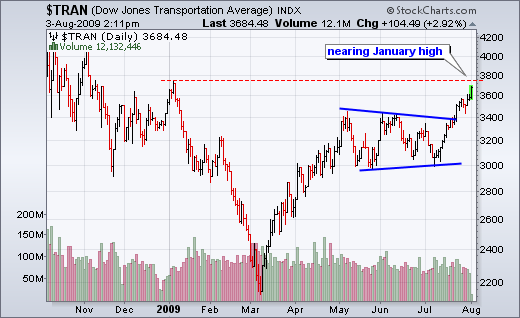
Despite rising oil prices, the Dow Transports surged on Monday with a move above 3600. This key average is now within spitting distance of its January high... Read More