Don't Ignore This Chart! August 30, 2013 at 02:41 PM
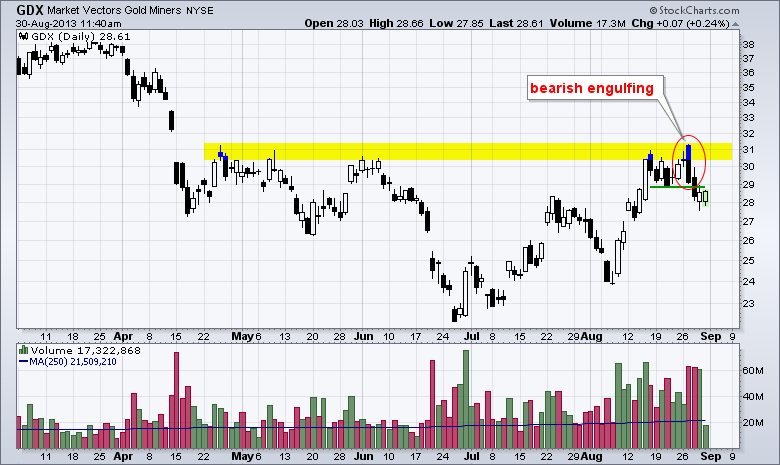
The Gold Miners ETF (GDX) came under intense selling pressure earlier this week with a bearish engulfing and short-term support break. These two down days occurred on high volume. Also notice that the ETF is hitting resistance from the highs extending back to late April... Read More
Don't Ignore This Chart! August 29, 2013 at 03:31 PM
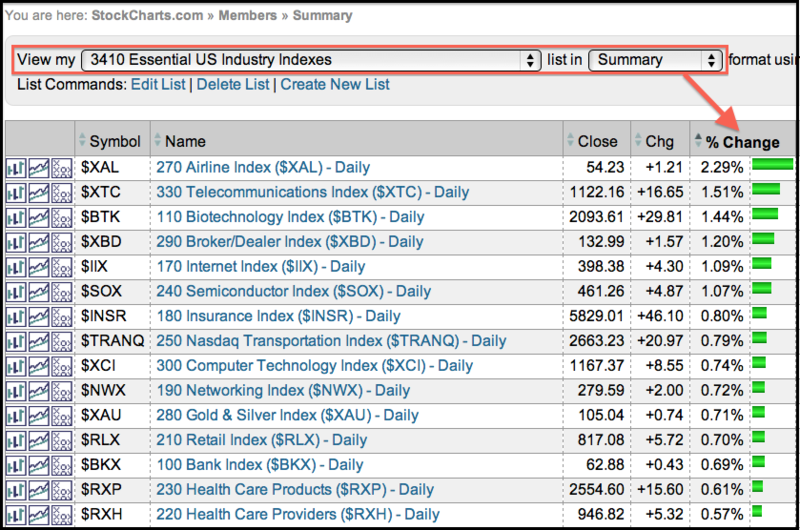
Extra! and Pro users have access to the StockCharts Essentials ChartPack, which features 13 core chartlists with over 140 key charts. The image below shows the Essential US Industry Indexes in "summary" format and sorted by percent change... Read More
Don't Ignore This Chart! August 28, 2013 at 03:32 PM
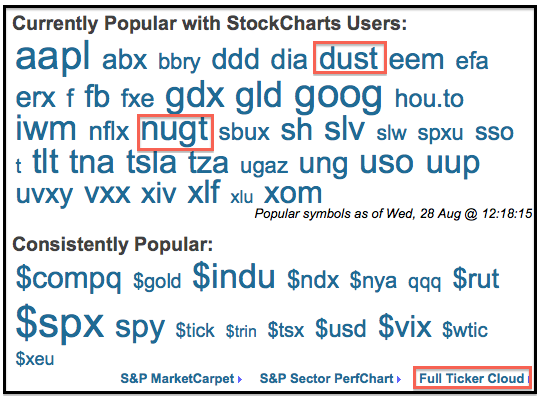
Want to see what's hot today? Check out the ticker cloud on the home page. The bigger the symbol, the more popular the chart. As you can see, the Direxion Gold Miners Bull 3X ETF (NUGT) and the Direxion Gold Miners Bear 3X ETF (DUST) are quite popular today... Read More
Don't Ignore This Chart! August 27, 2013 at 05:17 PM
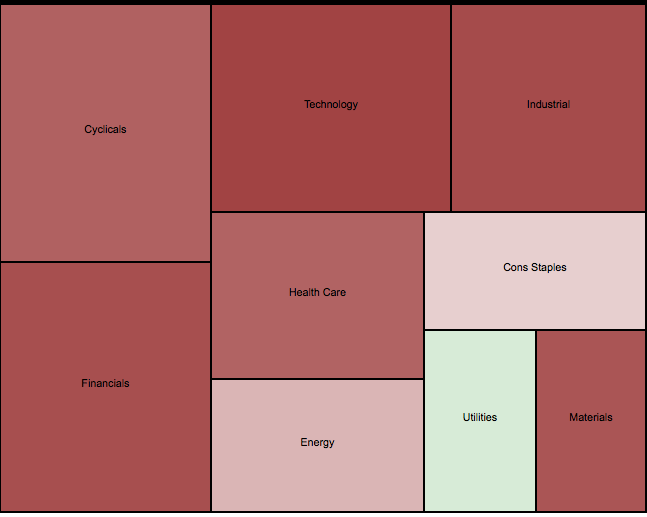
Looking for pockets of strength on a down day? Turn to the Sector Market Carpet. The first image shows the broad sector view with the utilities sector in light green. The other sectors are either red or a lighter shade of red, which means they are down... Read More
Don't Ignore This Chart! August 26, 2013 at 03:10 PM
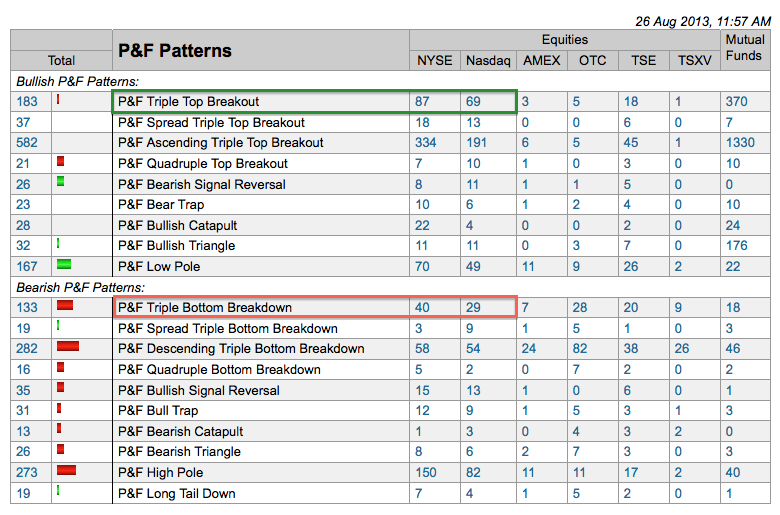
Chartists can get an idea of the overall market trend by comparing the number of bullish P&F signals with bearish P&F signals. StockCharts provides this data every day on the predefined scans page... Read More
Don't Ignore This Chart! August 23, 2013 at 03:26 PM
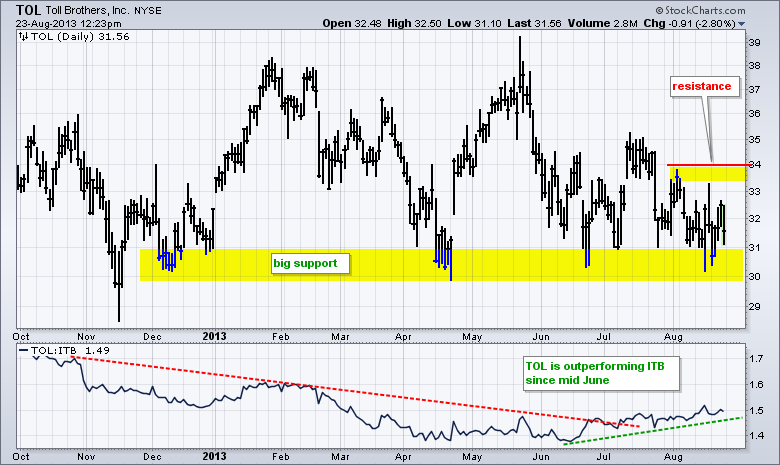
While the Home Construction iShares (ITB) battles broken support, Toll Brothers (TOL) is still holding support from the 2013 lows. The chart below shows TOL bouncing off support in mid August, but falling short of a breakout... Read More
Don't Ignore This Chart! August 22, 2013 at 02:02 PM
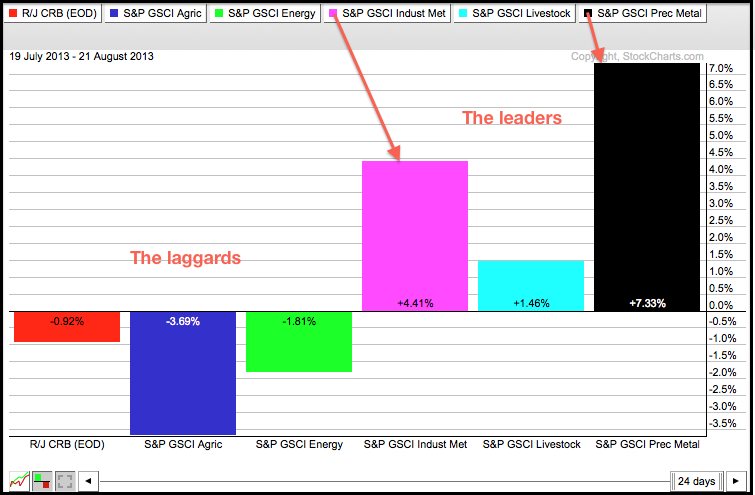
The US Commodity Groups PerfChart shows the performance for five commodity groups and the CRB Index ($CRB). Energy prices weighed on the CRB Index as the GSCI Energy Index fell over 1% this past month... Read More
Don't Ignore This Chart! August 21, 2013 at 03:24 PM
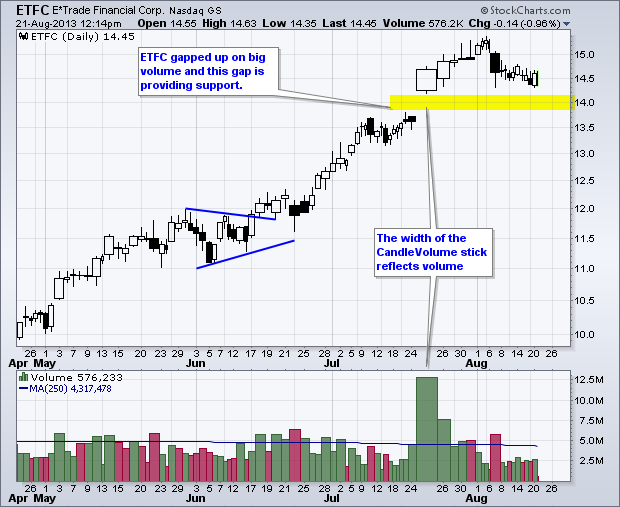
The chart below shows E*Trade (ETFC) with CandleVolume charts to accent volume. Upside volume has been strong in general and the stock gapped above 14 with the biggest volume since the mid March gap down. This gap zone around 14 has turned support as the stock firms just above... Read More
Don't Ignore This Chart! August 20, 2013 at 03:25 PM
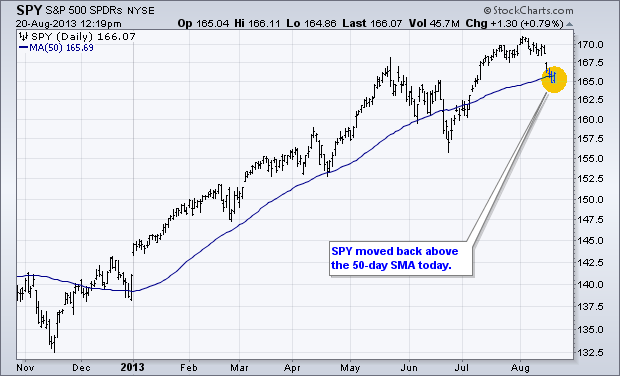
The S&P 500 ETF (SPY) broke below its 50-day moving average on Monday, but moved right back above on Tuesday. This moving average held from December to early June. SPY broke below in late June, but quickly recovered and recaptured the moving average... Read More
Don't Ignore This Chart! August 19, 2013 at 03:24 PM
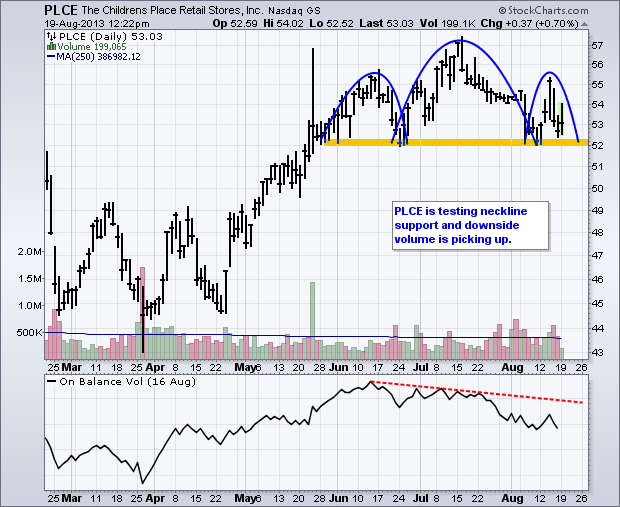
Children's Place formed a head-and-shoulders reversal pattern from late May to August and is currently testing neckline support. Notice that downside volume is outpacing upside volume and On Balance Volume (OBV) broke its June low this month... Read More
Don't Ignore This Chart! August 16, 2013 at 03:37 PM
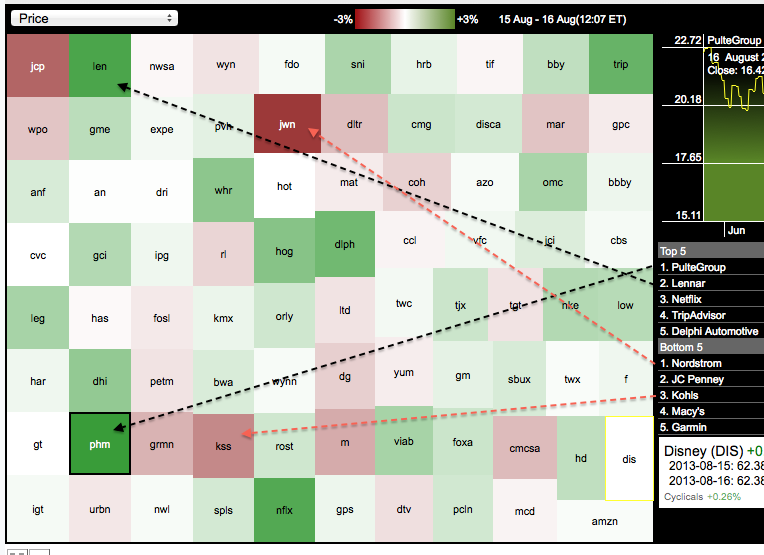
The image below shows the Market Carpet for just the consumer discretionary sector (cyclicals). Notice that Pulte (PHM) and Lennar (LEN) are leading on Friday, while Nordstrom (JWN) and Kohl's (KSS) are lagging... Read More
Don't Ignore This Chart! August 15, 2013 at 01:23 PM
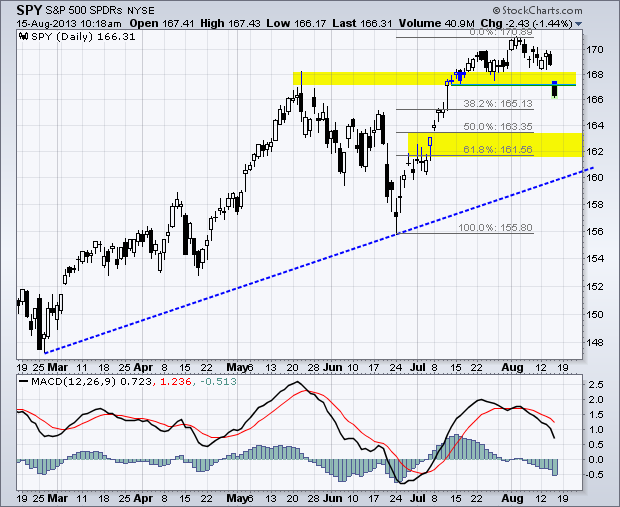
After weeks of indecision, the S&P 500 ETF (SPY) made a decisive move with break below the late July low. The gap and support break are short-term bearish as long as they hold... Read More
Don't Ignore This Chart! August 14, 2013 at 07:14 PM
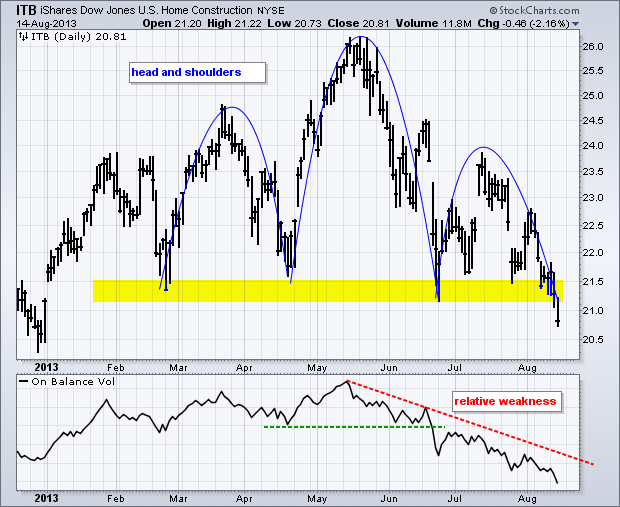
Rising rates are taking their toll on the Home Construction iShares (ITB) as the ETF broke neckline support on Wednesday. The head-and-shoulders pattern extends almost the entire year and today's breakdown confirms the bearish reversal... Read More
Don't Ignore This Chart! August 13, 2013 at 01:19 PM
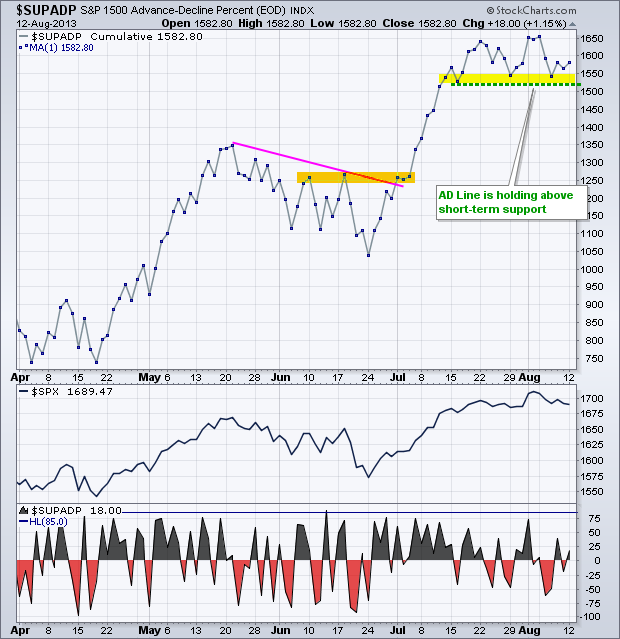
The S&P 1500 AD Line ($SUPADP), which is a key breadth indicator, has yet to break support and remains in bull mode. Notice how the AD Line established lows from mid July to early August. These lows mark a support zone that chartists should watch for clues on market direction... Read More
Don't Ignore This Chart! August 12, 2013 at 05:33 PM
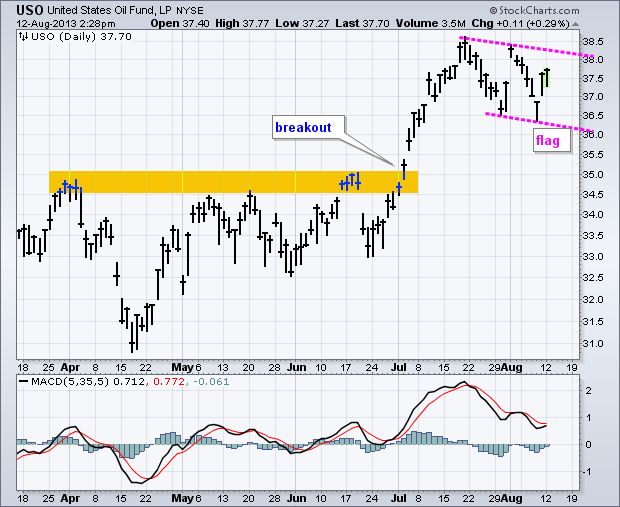
After surging and breaking resistance in July, the US Oil Fund (USO) pulled back with a falling flag the last few weeks. USO made its first move with a surge over the last two days. A follow through breakout above flag resistance would signal a continuation higher... Read More
Don't Ignore This Chart! August 09, 2013 at 12:27 PM
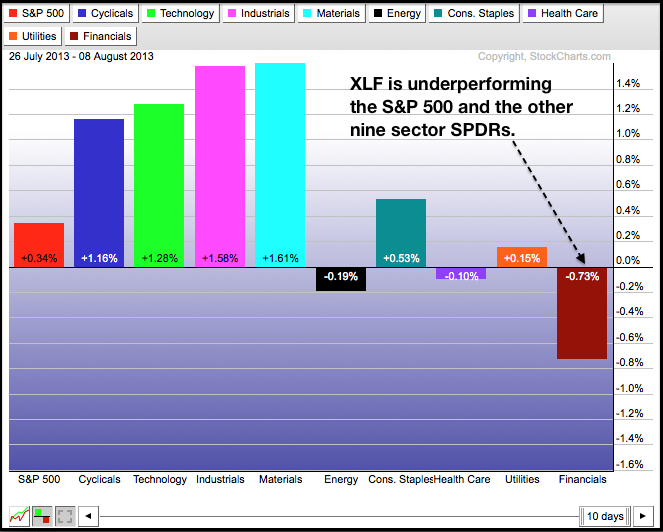
The Finance SPDR (XLF) was one of the best performing sectors from April to late July, but was the weakest sector over the last two weeks. The PerfChart below shows XLF with a loss over the last ten trading days... Read More
Don't Ignore This Chart! August 08, 2013 at 09:32 PM
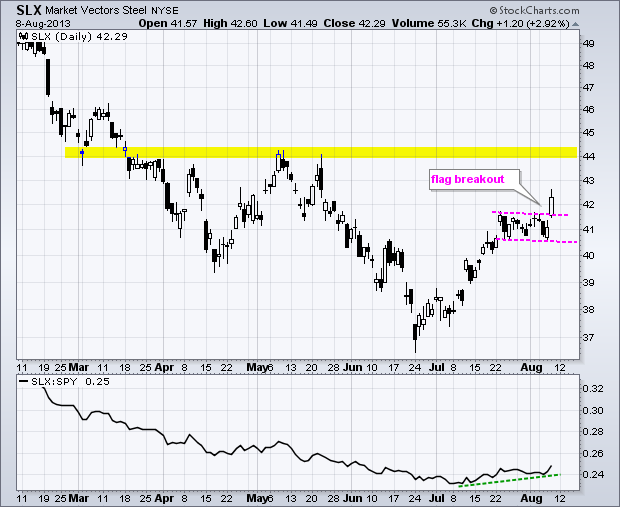
Even though the long-term trend remains down, the Steel ETF (SLX) is making some bullish waves with a flag breakout on Thursday. After an advance from late June to mid July, SLX consolidated with a falling flag, which is a bullish continuation pattern... Read More
Don't Ignore This Chart! August 07, 2013 at 02:00 PM
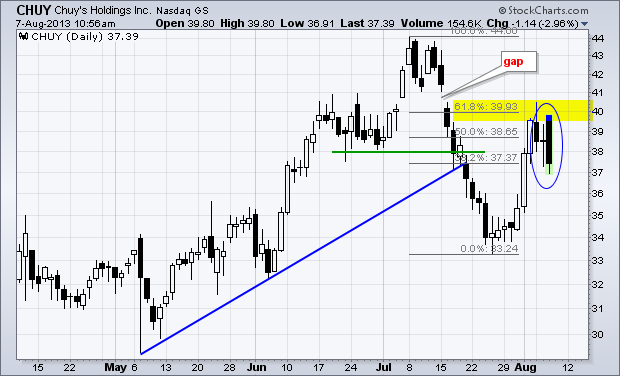
Chuy's Holdings came across the intraday bearish engulfing scan on Wednesday. Even though the trading day has just begun, notice that the stock broke down in July and retraced 62% with a bounce back to 40 in August... Read More
Don't Ignore This Chart! August 05, 2013 at 02:04 PM
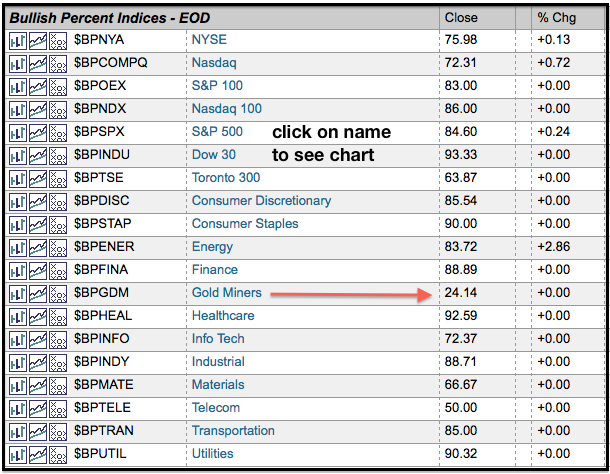
StockCharts calculates the Bullish Percent Index for over a dozen groups, including several major indices, the main sectors and a few industry groups. A list can be found on the end-of-day market summary page. Notice that all BPIs are at or above 50%, which favors the bulls... Read More
Don't Ignore This Chart! August 02, 2013 at 01:31 PM
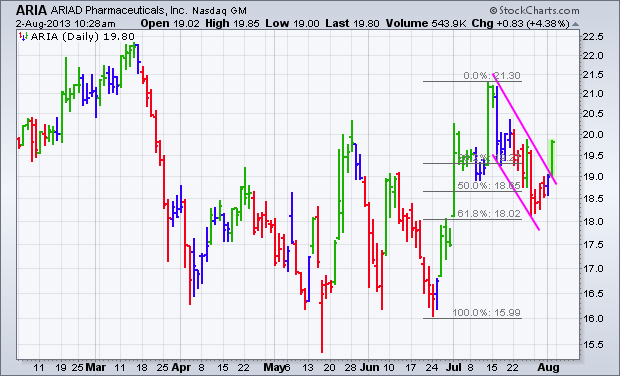
Chartists looking for stocks on the move can turn to our pre-defined scans page and the Elder bar scans. Stocks with an Elder bar turning green are turning up. Those with an Elder bar turning red are turning down... Read More
Don't Ignore This Chart! August 01, 2013 at 03:17 PM
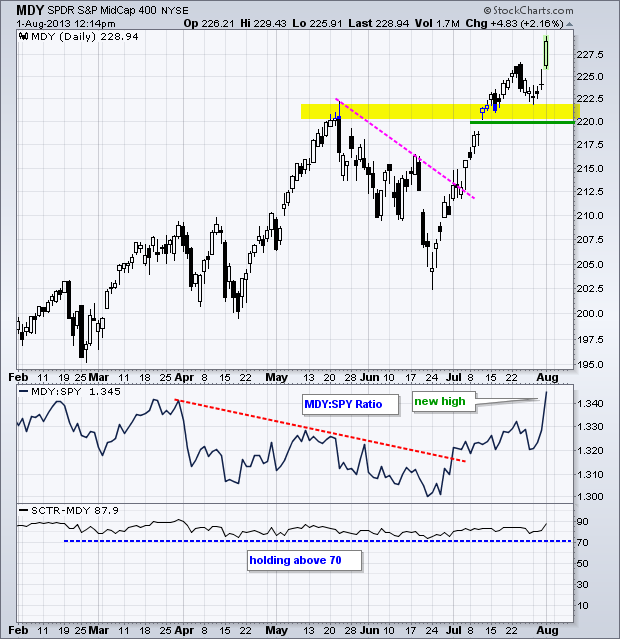
Stocks surged after Fed day with the S&P MidCap 400 SPDR (MDY) hitting a new high early Thursday. The indicator window shows the price relative (MDY:SPY ratio) hitting a new high as well... Read More
Don't Ignore This Chart! July 31, 2013 at 08:04 PM
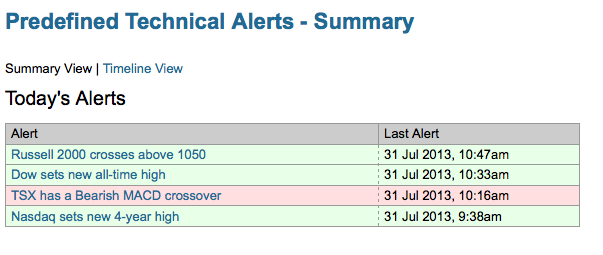
Even though stocks were all over the place on Wednesday, the Dow recorded an all time high and the Nasdaq recorded a four year high. Not shabby at all. StockCharts users can keep abreast of these milestones on the Predefined Technical Alerts page... Read More