Don't Ignore This Chart! December 31, 2013 at 07:04 AM
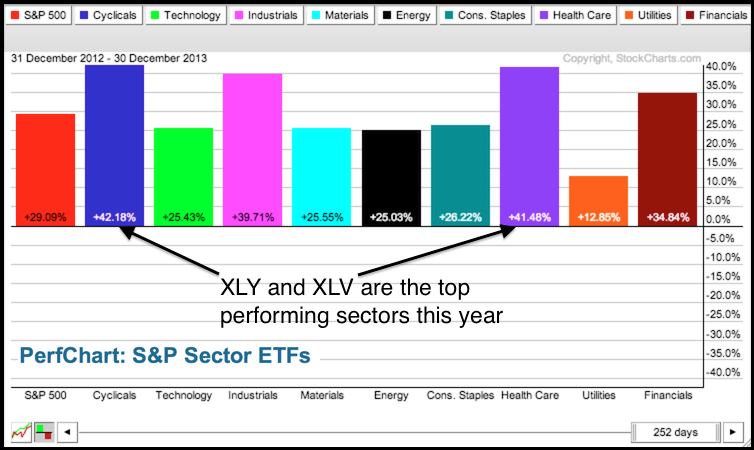
The Consumer Discretionary SPDR (XLY) and the HealthCare SPDR (XLV) are the top performing sectors year-to-date. Both are up over 40% and easily outperforming the S&P 500 SPDR (SPY), which is up a mere 29%... Read More
Don't Ignore This Chart! December 30, 2013 at 06:22 AM
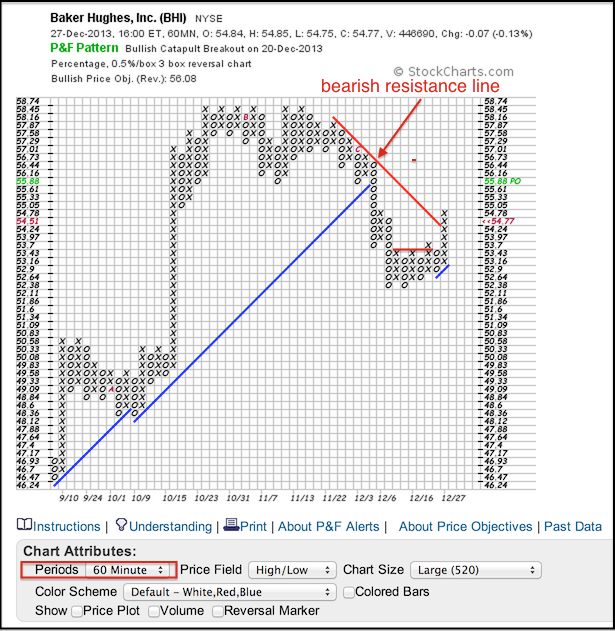
Baker Hughes (BHI) perked up over the last few weeks by establishing support in the lows 50s and triggering three bullish P&F signals. First, notice that the stock forged a Triple Top Breakout at 53.7. Second, BHI triggered a bullish Catapult with a move above 54... Read More
Don't Ignore This Chart! December 27, 2013 at 06:00 AM
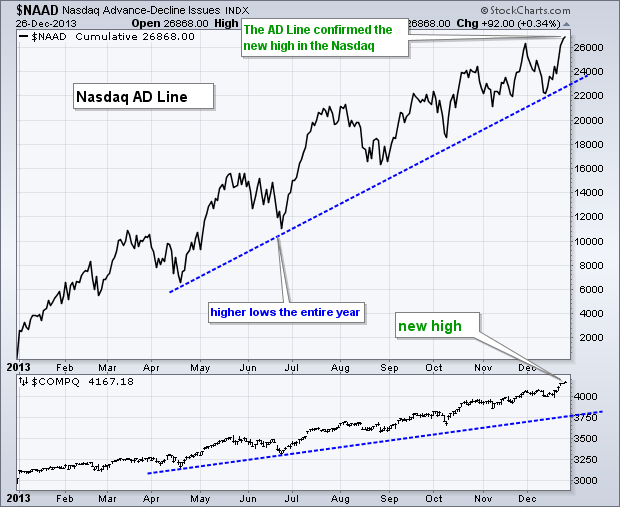
The Nasdaq AD Line extended its year long uptrend with a surge and new high in December. The chart below shows the AD Line with a series of rising peaks and rising troughs (higher highs and higher lows)... Read More
Don't Ignore This Chart! December 26, 2013 at 02:28 PM
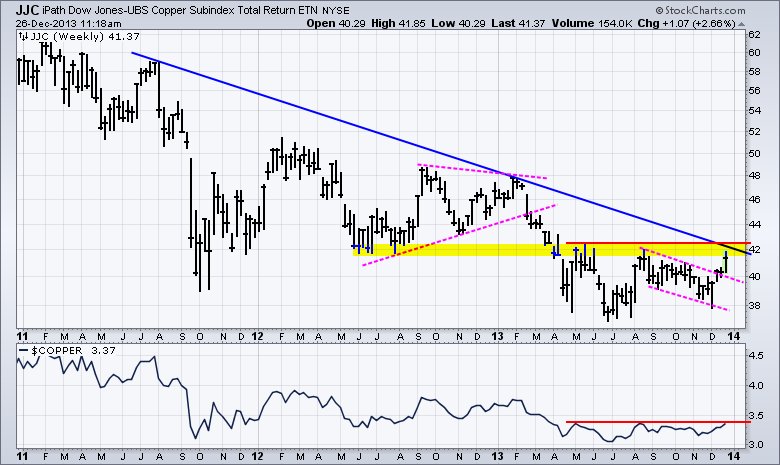
The Copper ETN (JJC) is poised to challenge resistance after a channel breakout this month. Notice that the ETF successfully tested the spring-summer lows with a 5+ percent bounce this month... Read More
Don't Ignore This Chart! December 24, 2013 at 11:26 AM
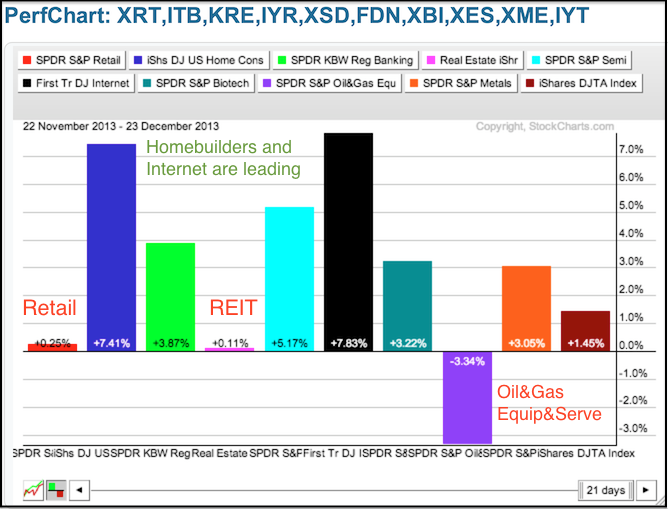
The PerfChart below shows one-month performance for ten industry group ETFs. Even though I am concerned with relative weakness in the Retail SPDR (XRT), this concern is offset by relative strength in three other groups... Read More
Don't Ignore This Chart! December 23, 2013 at 03:30 PM
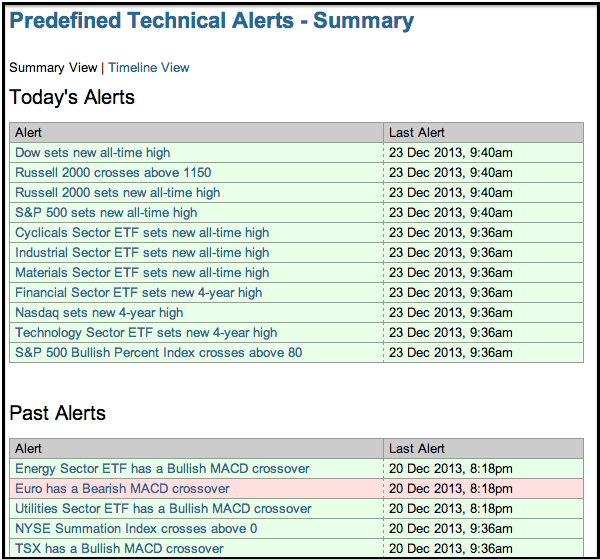
With a strong open on Monday, the pre-defined technical alerts page is showing lots of green for the stock market. Notice that five sector SPDRs hit new highs, three major indices hit new highs and the S&P 500 Bullish Percent Index surged above 80... Read More
Don't Ignore This Chart! December 19, 2013 at 02:32 PM
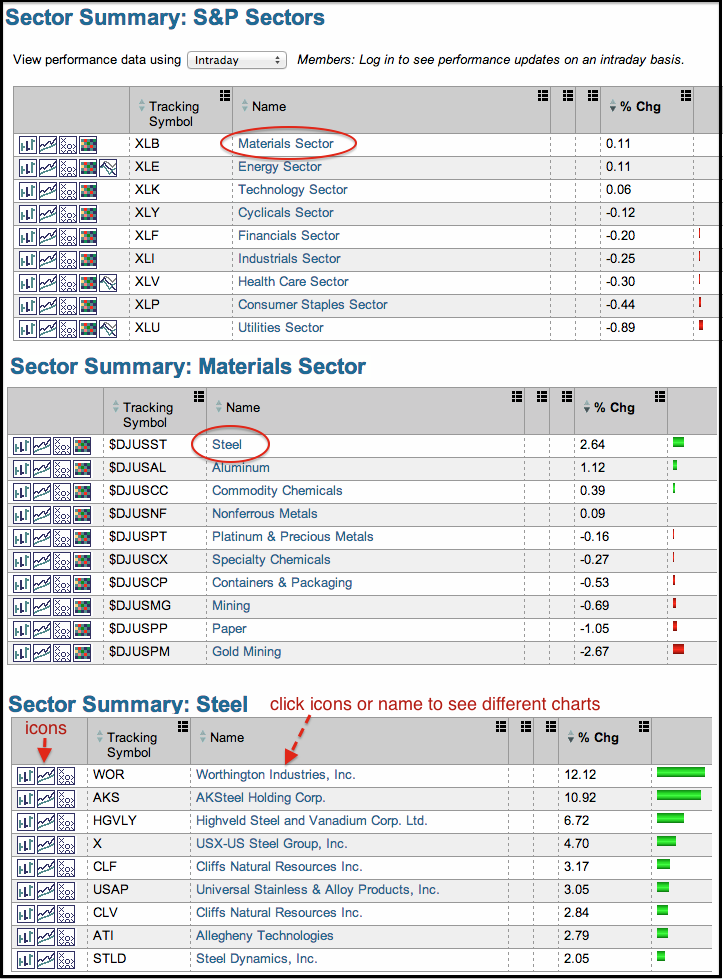
A top-down browse through the sector summary shows that steel stocks are up in a down market on Thursday. Starting with the sector overall, chartists can see which sectors are leading and which are lagging... Read More
Don't Ignore This Chart! December 18, 2013 at 06:12 PM
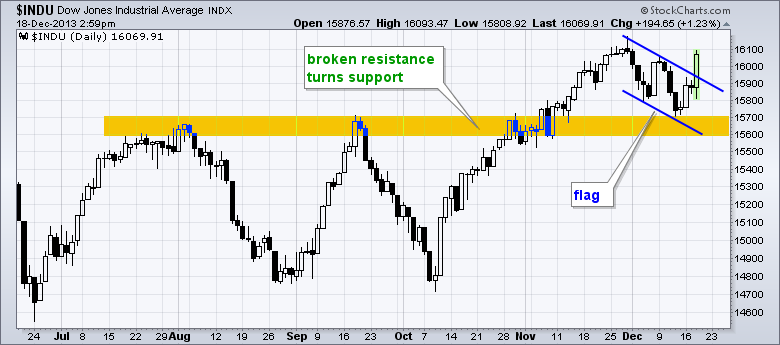
The Dow is making a bold statement as it holds the resistance breakout from November and exceeds flag resistance. The Dow broke to new high with a move above 15700 in early November and the 15600-15700 area turns support... Read More
Don't Ignore This Chart! December 17, 2013 at 07:09 PM
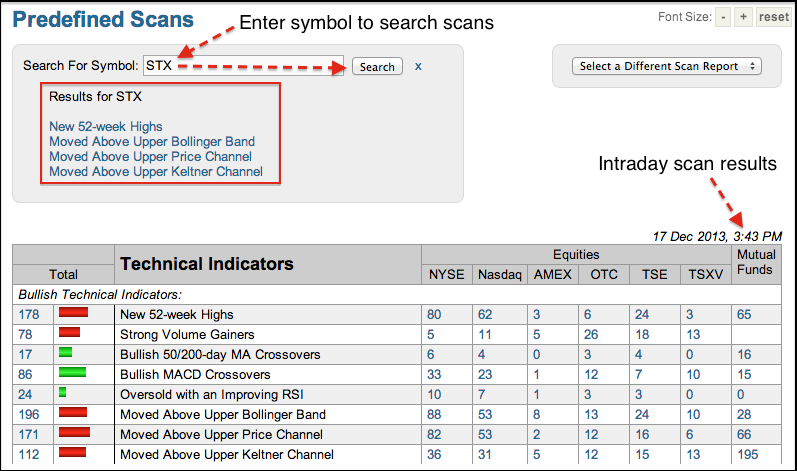
Reports of the death of the PC have been greatly exaggerated. Though not PC makers, the hard drive makers are strong with two hitting 52-week highs this week. Seagate (STX) and Western Digital (WDC) hit new highs and stand out on the predefined scans page... Read More
Don't Ignore This Chart! December 16, 2013 at 08:21 PM
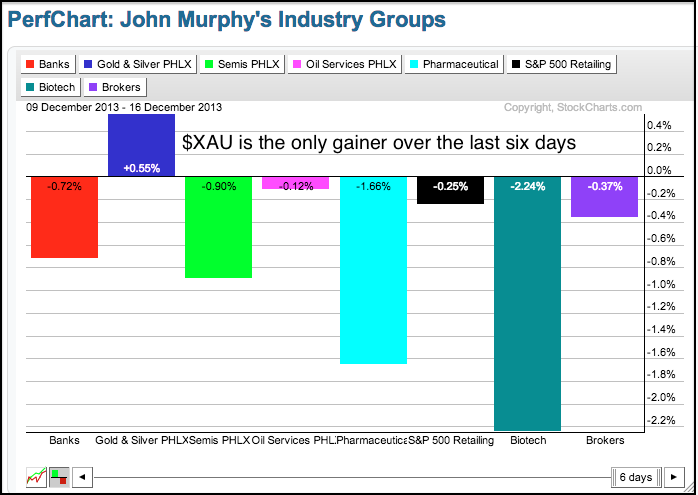
The PHLX Gold & Silver Index ($XAU) is actually showing some strength with a small gain over the last six days. Perhaps this is because most other industry group indices are down and XAU is a contrarian play... Read More
Don't Ignore This Chart! December 13, 2013 at 08:23 AM
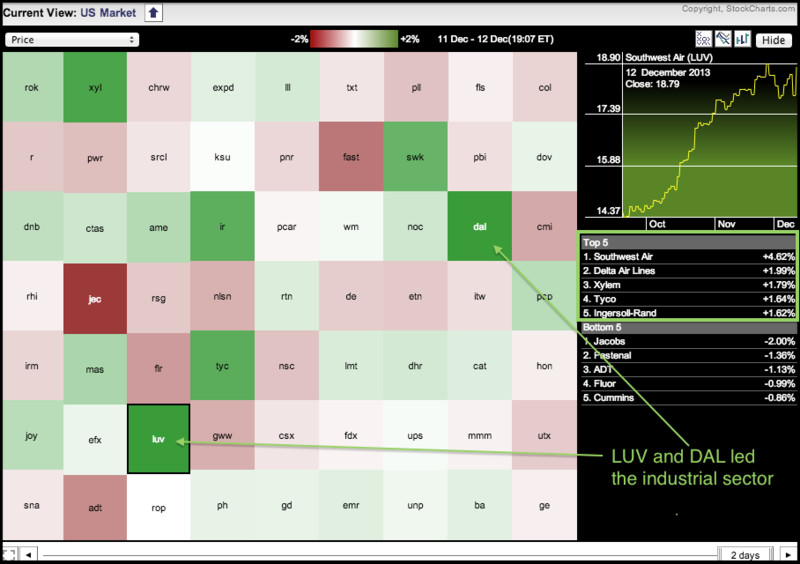
The Sector MarketCarpet shows that Delta and Southwest, two airline stocks, are leading the industrials sector on Thursday. Airlines tend to move as a group and this means other airline stocks are likely strong as well... Read More
Don't Ignore This Chart! December 12, 2013 at 01:33 PM
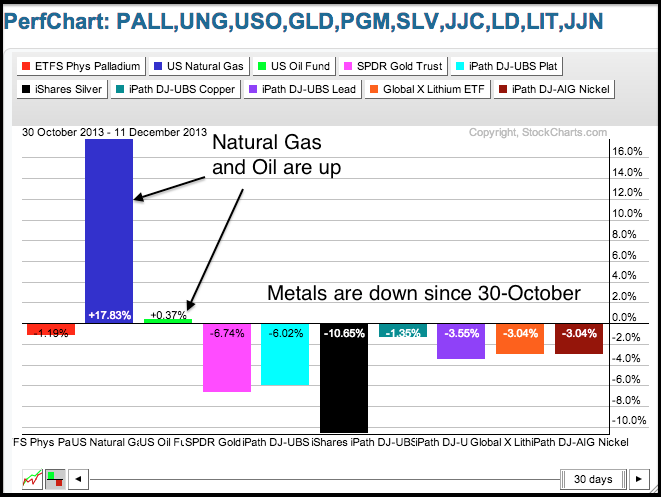
The Natural Gas ETF (UNG) is on a tear with a 15+ percent gain since October 30th. The PerfChart below shows UNG with nine other commodity-related ETFs. The eight metal-related ETFs are down with the Gold SPDR (GLD) and Silver Trust (SLV) leading the way lower... Read More
Don't Ignore This Chart! December 11, 2013 at 12:17 PM
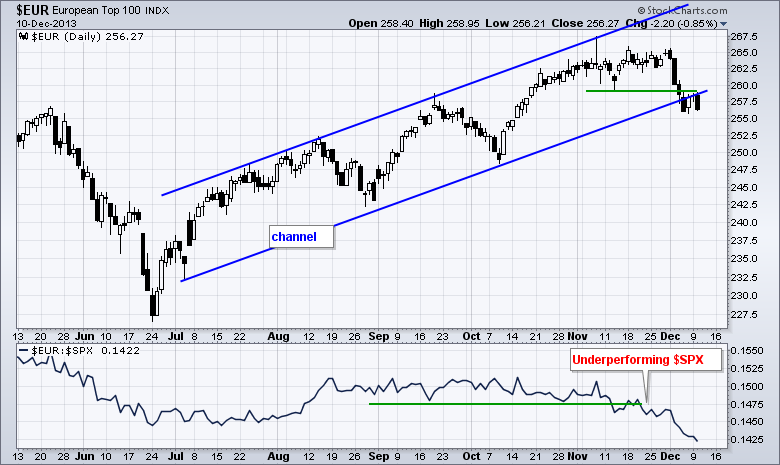
The European Top 100 Index ($EUR) broke below the lower trend line of a five month channel with a sharp decline this month. In addition, notice that the index broke below the mid November low and these breaks are holding... Read More
Don't Ignore This Chart! December 10, 2013 at 10:23 AM
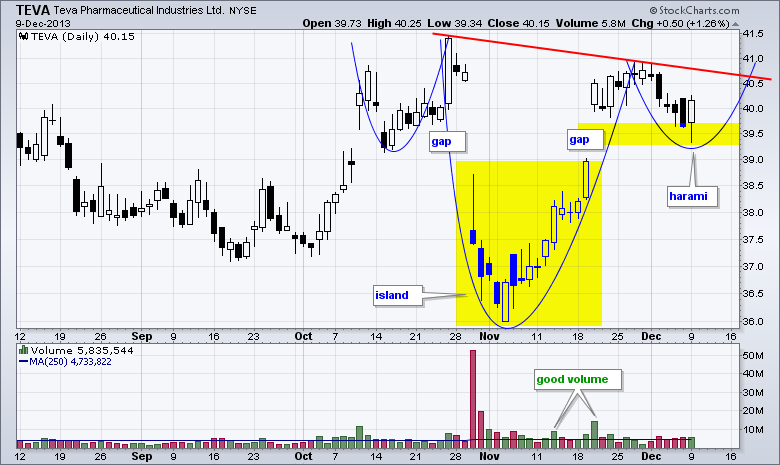
Teva Pharmaceuticals (TEVA) has been all over the place since early October, but two bullish patterns are taking shape and the stock could be poised for a breakout. First, the stock formed a massive island reversal with the late October gap down and the late November gap up... Read More
Don't Ignore This Chart! December 09, 2013 at 08:54 PM
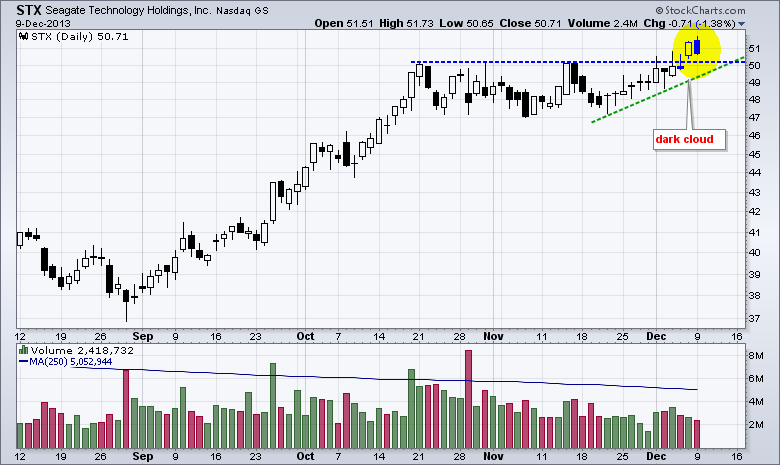
Seagate Technology (STX), which is a Nasdaq stock with a three letter symbol, opened strong and closed weak to make the dark cloud scan list. These are potentially bearish patterns that require confirmation. A move below 49... Read More
Don't Ignore This Chart! December 06, 2013 at 03:37 PM
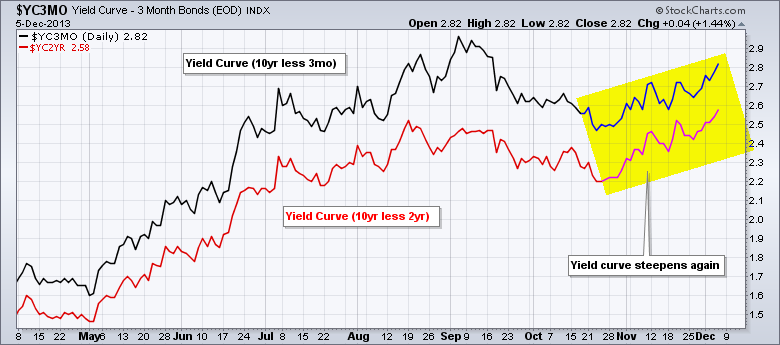
The yield curve is steepening as the 10-YR Treasury Yield ($TNX) surges more than the 2-YR Treasury Yield and the 3-Month Treasury Yield. A steepening yield curve confirms loose monetary policy and this could help banks, which make money by borrowing short and lending long... Read More
Don't Ignore This Chart! December 05, 2013 at 06:26 PM
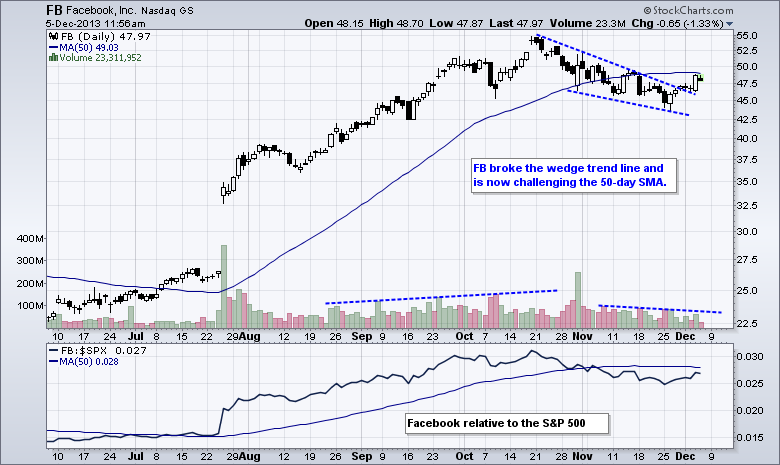
Facebook (FB) got a bounce over the last seven days and broke above the wedge trend line. This is the first step to ending the correction that started in mid October. The 50-day moving average is the next hurdle... Read More
Don't Ignore This Chart! December 04, 2013 at 05:07 PM
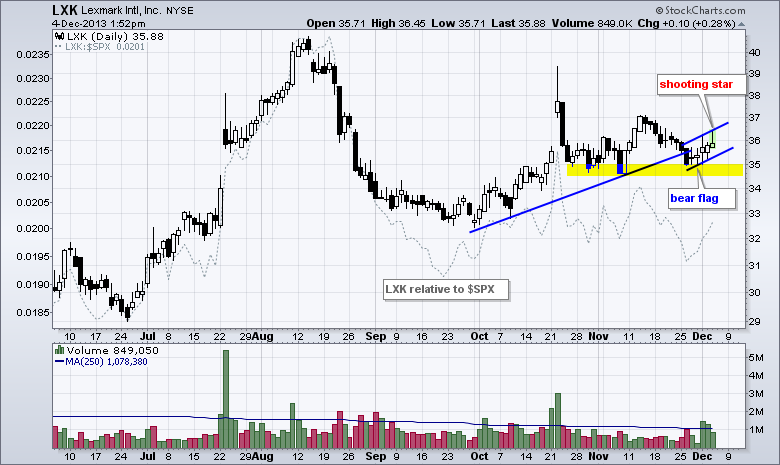
Lexmark (LXK) presents a conundrum for traders. On the bullish side, the stock bounced off support near 35 with a three day advance on pretty good volume. Relative to the market, the stock is also holding up pretty well the last three days... Read More
Don't Ignore This Chart! December 03, 2013 at 07:35 PM
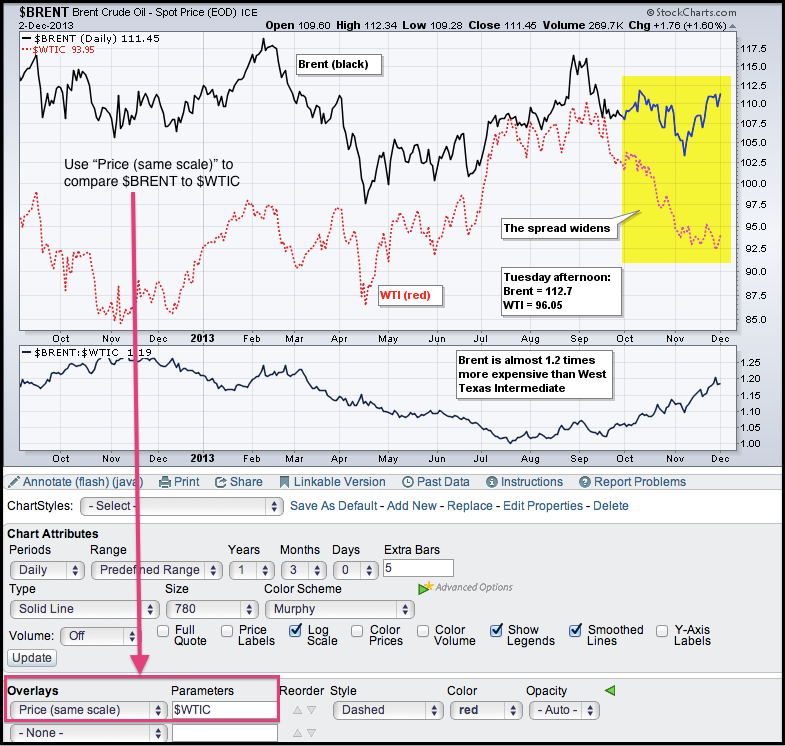
Brent Crude ($BRENT) surged above $110 this week and WTI Crude ($WTIC) moved above $96, but the spread between the two remains wide. The chart below shows Brent trading some $18 higher than WTI. The indicator window shows the $BRENT:$WTIC ratio nearing 1... Read More
Don't Ignore This Chart! December 02, 2013 at 03:07 PM
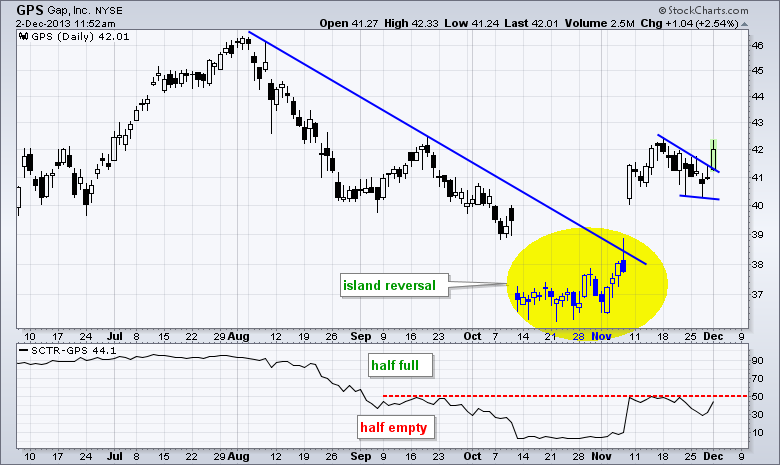
Gap is making some waves with an island reversal in early November and wedge breakout here in early December. Also notice that the SCTR surged above 40 and is on the verge of breaking into the upper half of its range. Click here for the current SCTRs for the S&P 500... Read More