Don't Ignore This Chart! April 30, 2014 at 02:23 PM
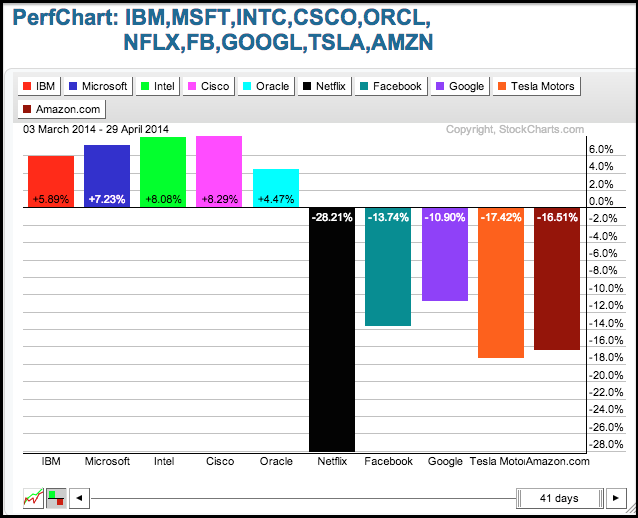
The S&P 500 is up around 1.75% over the last two months, but the Nasdaq is down around 4%. Part of the reason for this discrepancy can be found in the performance of ten key tech stocks... Read More
Don't Ignore This Chart! April 28, 2014 at 06:11 PM
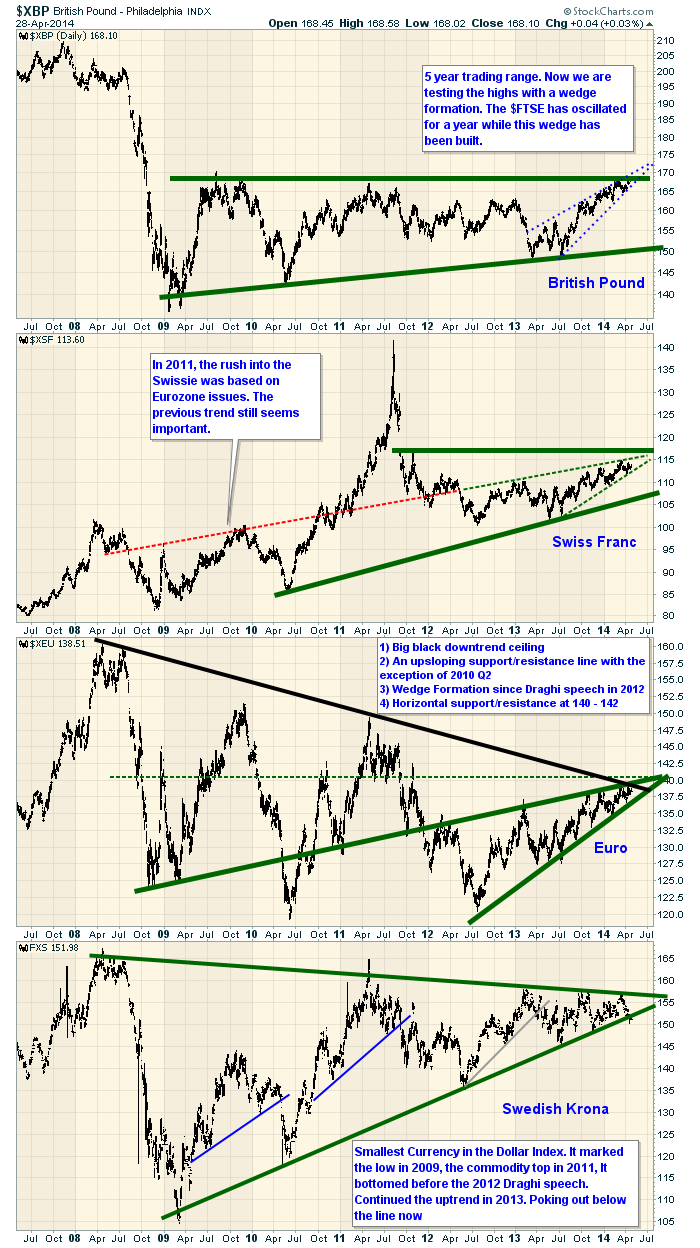
This article will look at the four currencies in the Eurozone that are part of $USD index.The Euro, the Swiss, the British Pound and the Krona. Earlier today I published a currency article showing the Yen, the Aussie and the Canadian Dollar all just under important resistance... Read More
Don't Ignore This Chart! April 28, 2014 at 05:53 PM
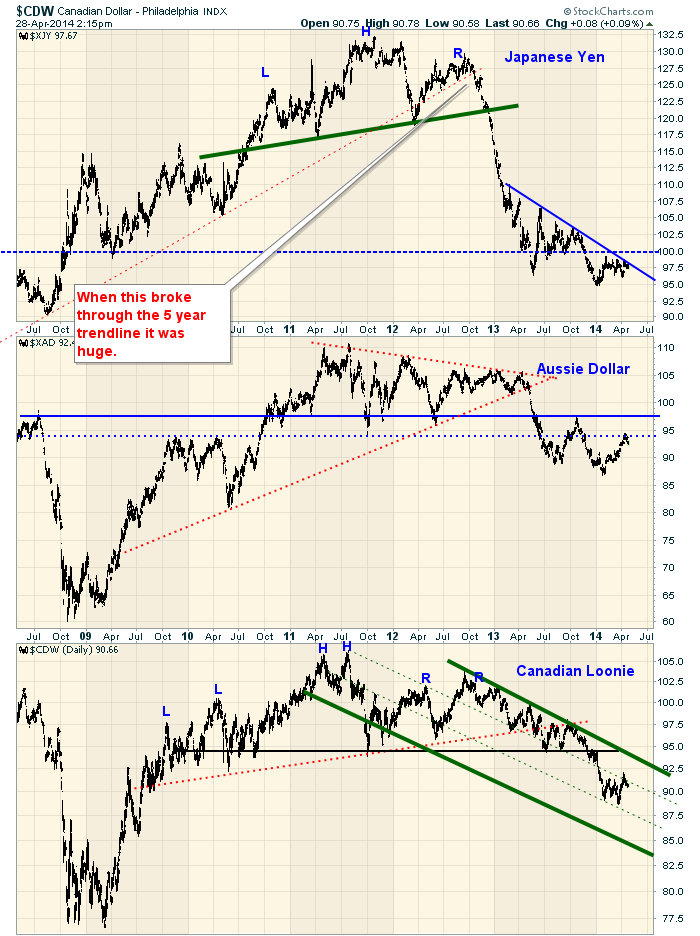
When big market moves in the $SPX or other major indexes happen, there is usually a big move in the currencies. Today, studying the non-Euro currencies reveals an interesting dilemma. This is the big picture view... Read More
Don't Ignore This Chart! April 27, 2014 at 02:28 PM
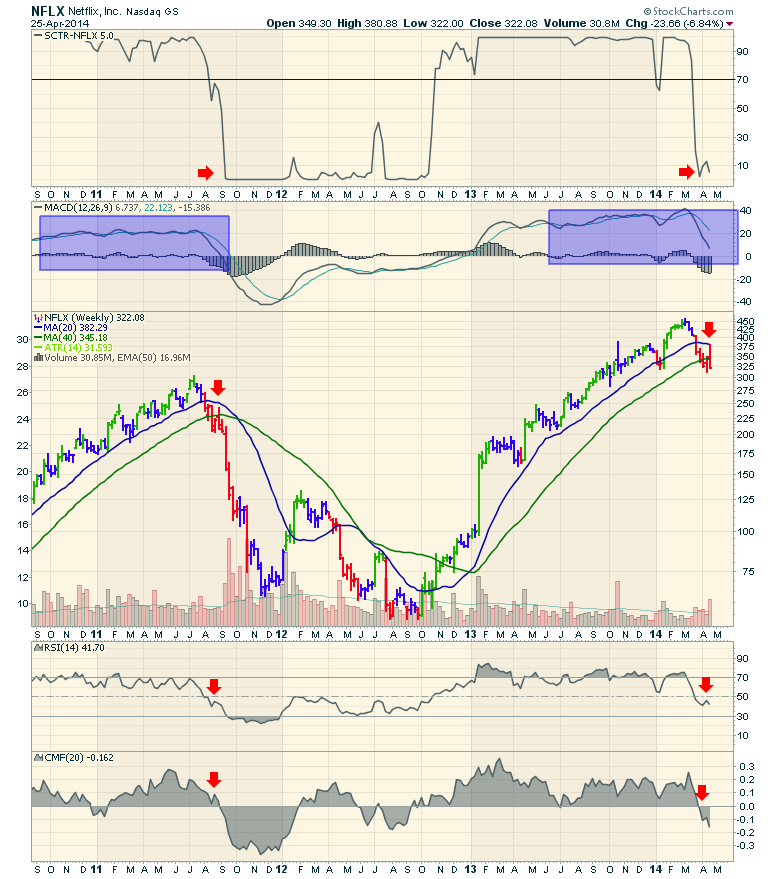
Netflix has been a darling for the momentum stock selectors. So on a Saturday night, maybe we should watch a movie on NFLX. When I called up NFLX today, I was in awe at how similar the patterns are looking back to 2011... Read More
Don't Ignore This Chart! April 25, 2014 at 09:18 AM
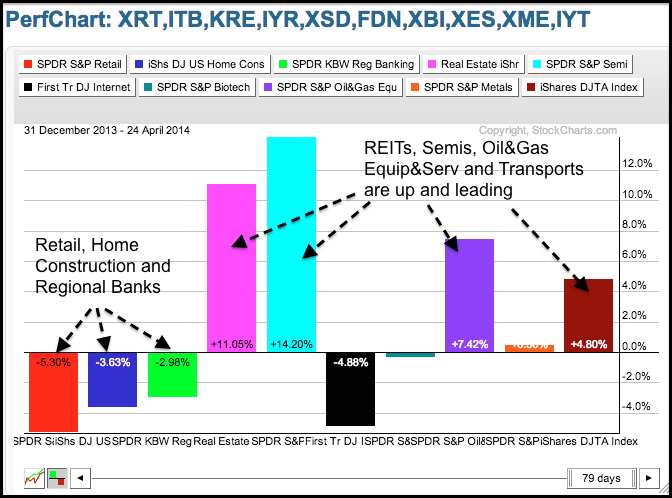
The S&P 500 is up 1.64% year-to-date and the Russell 2000 is down 1.66%. This market splits is also reflected in year-to-date performance for ten key industry group ETFs. Notice that five are up and five are down... Read More
Don't Ignore This Chart! April 24, 2014 at 02:10 PM
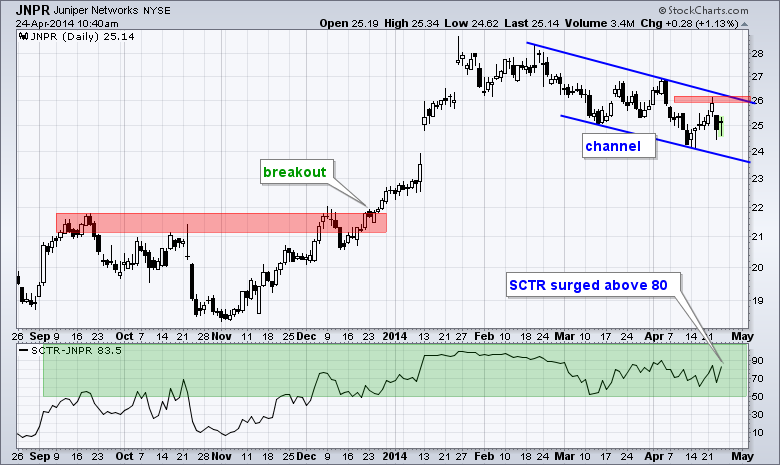
Juniper Networks (JNPR) is making waves because its StockCharts Technical Rank (SCTR) surged above 80 with one of the biggest SCTR gains among large-caps. Chartists can access the SCTR tables in the lower half of the home page... Read More
Don't Ignore This Chart! April 23, 2014 at 06:48 PM
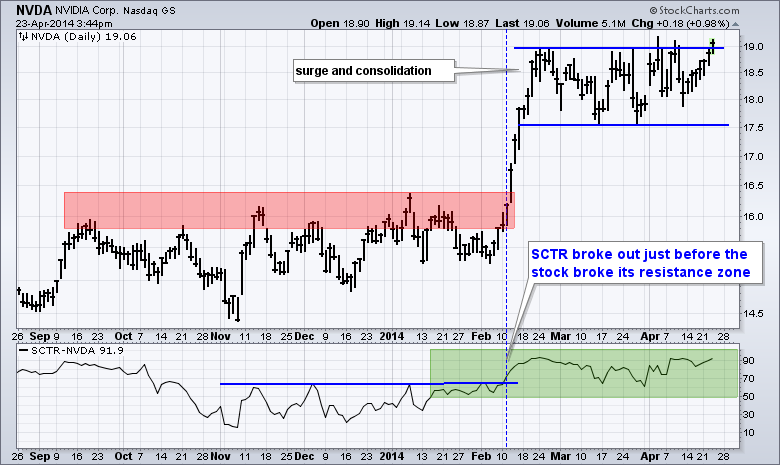
Nvidia (NVDA) is showing relative strength as it breaks above consolidation resistance. The chart below shows the stock surging and then moving into a trading range that looks like a flat flag. A breakout here would signal a continuation higher... Read More
Don't Ignore This Chart! April 23, 2014 at 05:46 PM
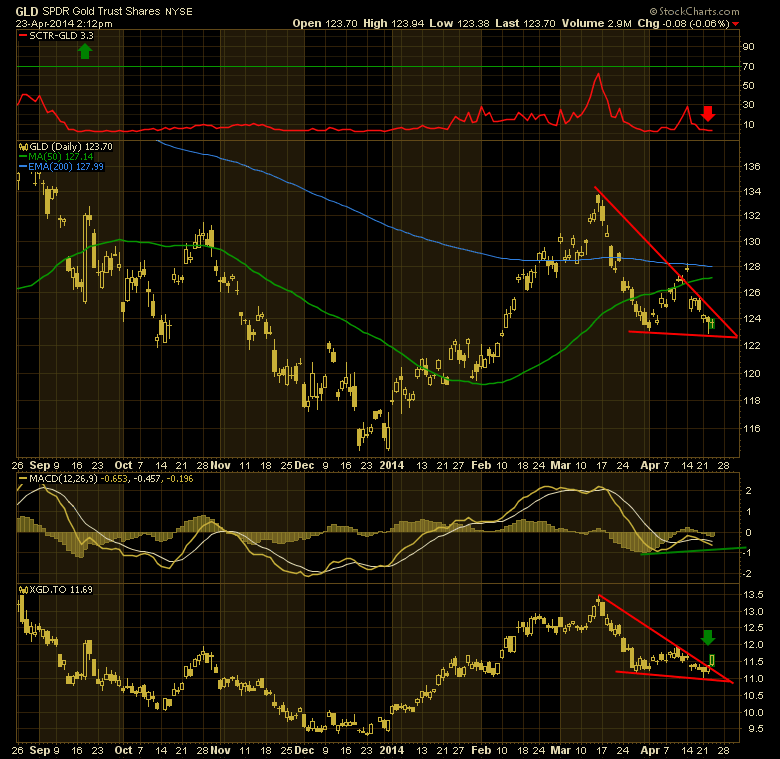
Some days, its about what is not moving. That would be $GOLD. Here is the chart of GLD the tracking ETF. You can see the SCTR is at 3. This means it is behaving worse than 97% of the stocksand ETFs on the $TSX. We recently made a lower low and are below the 200 DMA... Read More
Don't Ignore This Chart! April 19, 2014 at 03:00 PM
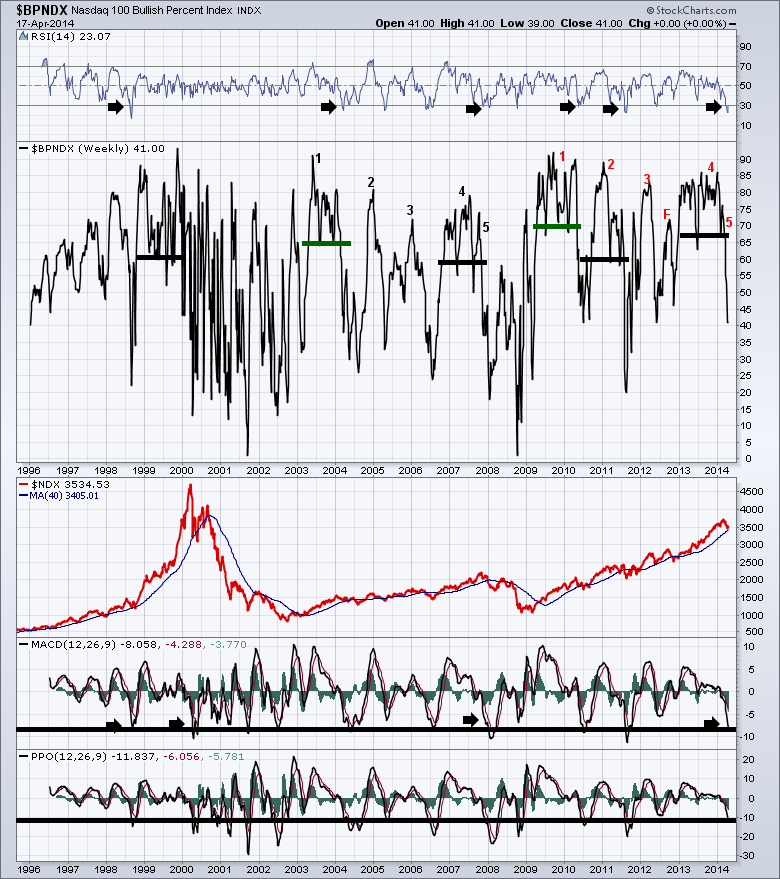
The Nasdaq data is the most interesting in terms of change in my chart lists currently. The $BPNDX is producing similar signals to the $NDXA200R. See today's Chartwatchers newsletter for more information on that. Here is the link. ChartWatchers... Read More
Don't Ignore This Chart! April 16, 2014 at 05:34 AM
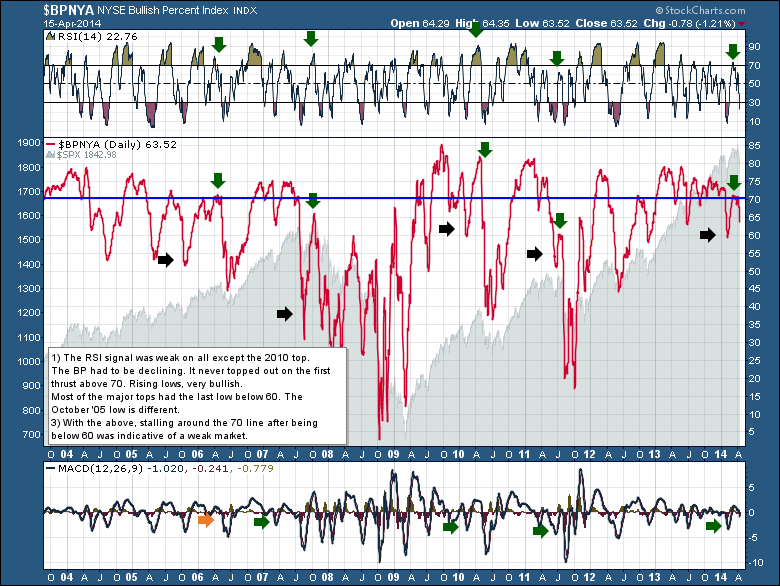
The concept of Bullish Percent is great. From a group of stocks, you calculate the % of stocks on a buy signal. The rest are on a sell. With PnF charts as the basis for Bullish Percent calculations, penny moves don't matter as in New Highs or the Advance Decline line... Read More
Don't Ignore This Chart! April 11, 2014 at 04:25 PM
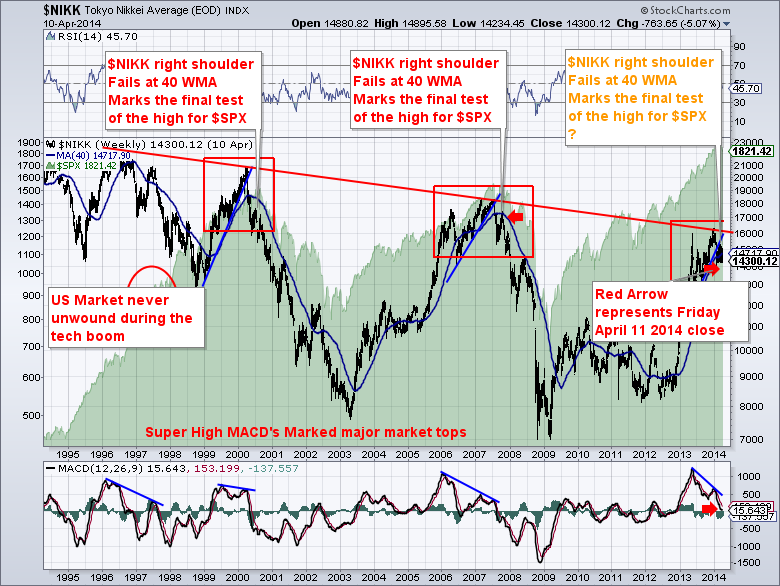
The $NIKK was a leading indicator at the market tops of 2000 and 2007. The $NIKK closed today at new lows after making a big divergent high. How could the $NIKK be a leading indicator? I think the underlying cause is the carry trade with the Japanese Yen... Read More
Don't Ignore This Chart! April 10, 2014 at 11:21 PM
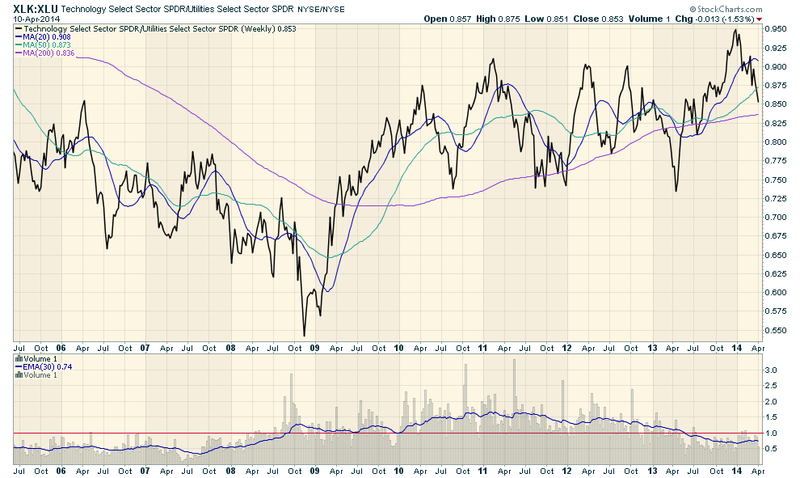
Here's a chart that you should definitely not ignore: (Click on the chart for a live version.) So this is a chart of the relative strength of the Technology sector (using XLK as a proxy) versus the Utilities sector (XLU)... Read More
Don't Ignore This Chart! April 10, 2014 at 04:25 AM
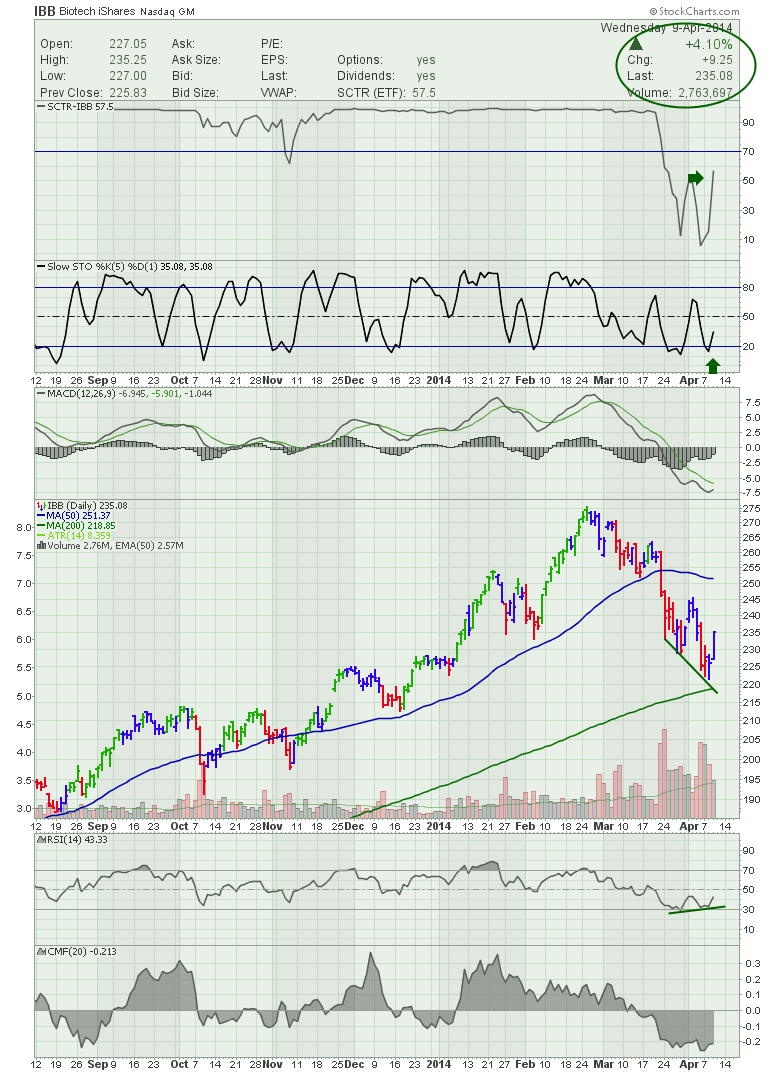
Biotechs launched on Wednesday even though the overall market started out with a relatively passive tone. The Dow up 75 was nothing to sneeze at but not remarkable. When the Fed minutes were released the market absolutely popped higher. The Nasdaq finished the day up 1... Read More
Don't Ignore This Chart! April 07, 2014 at 03:23 PM
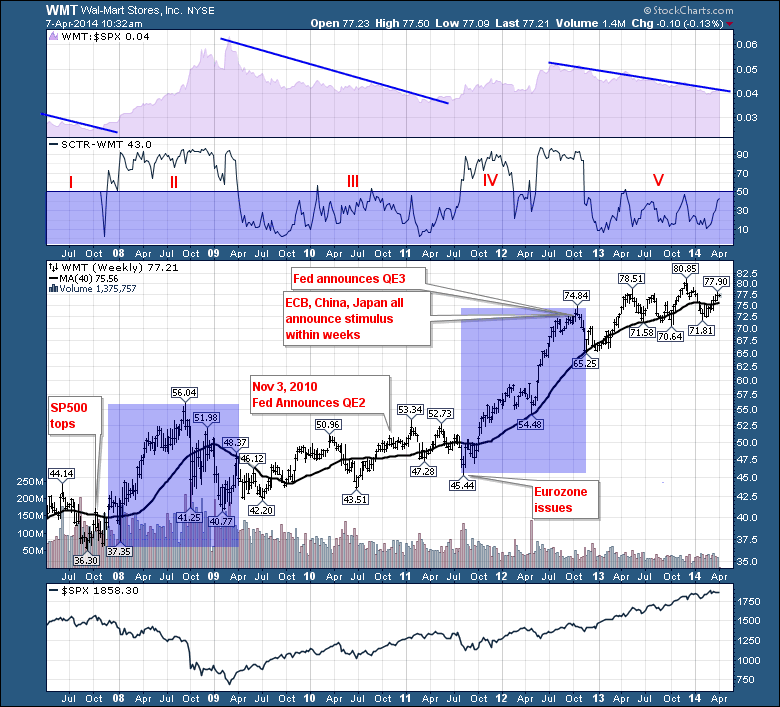
The Fed - Federal Reserve - has made massive accomodations over the last 4 years. Walmart WMT has been an interesting chart to watch. Lets lay it in here and analyze it with a bit of depth. First of all, the top purple shaded area plot is the SPURS - $SPX Relative Strength... Read More
Don't Ignore This Chart! April 04, 2014 at 06:20 PM
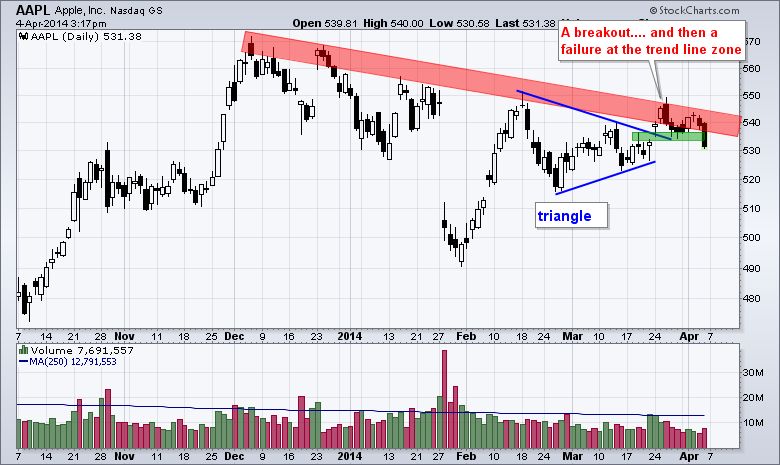
Apple (AAPL) appeared to be breaking out with a surge above triangle resistance in late March, but this breakout failed as the stock reversed in the trend line zone and broke back below 535 on Friday. Sometimes a failed signal is as value as a signal... Read More
Don't Ignore This Chart! April 04, 2014 at 02:39 AM
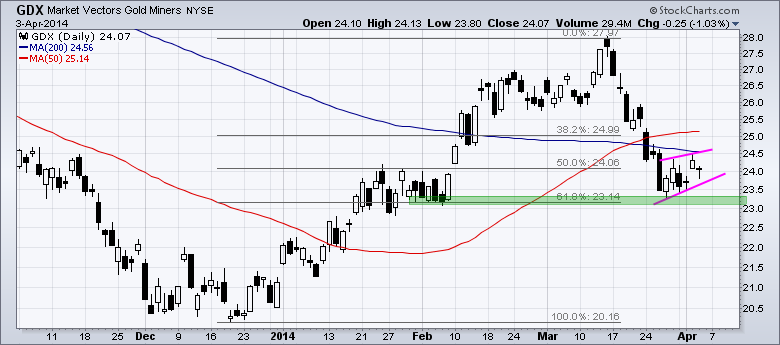
After breaking the 200-day and 50-day moving averages with a sharp decline, the Gold Miners ETF (GDX) consolidated with a small pennant. Notice that this consolidation is occurring near the 62% retracement and early February lows. This puts GDX at a critical juncture... Read More