Don't Ignore This Chart! January 31, 2016 at 11:56 AM
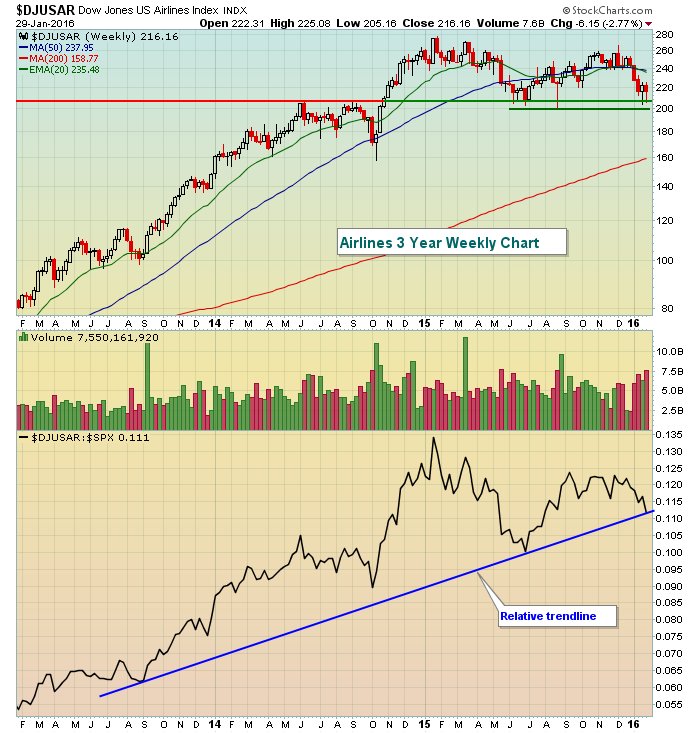
The Dow Jones U.S. Airlines Index ($DJUSAR) made a very significant breakout late in 2014 and after its peak in January 2015, the group has been doing everything possible to hold onto price support ever since... Read More
Don't Ignore This Chart! January 29, 2016 at 12:25 PM
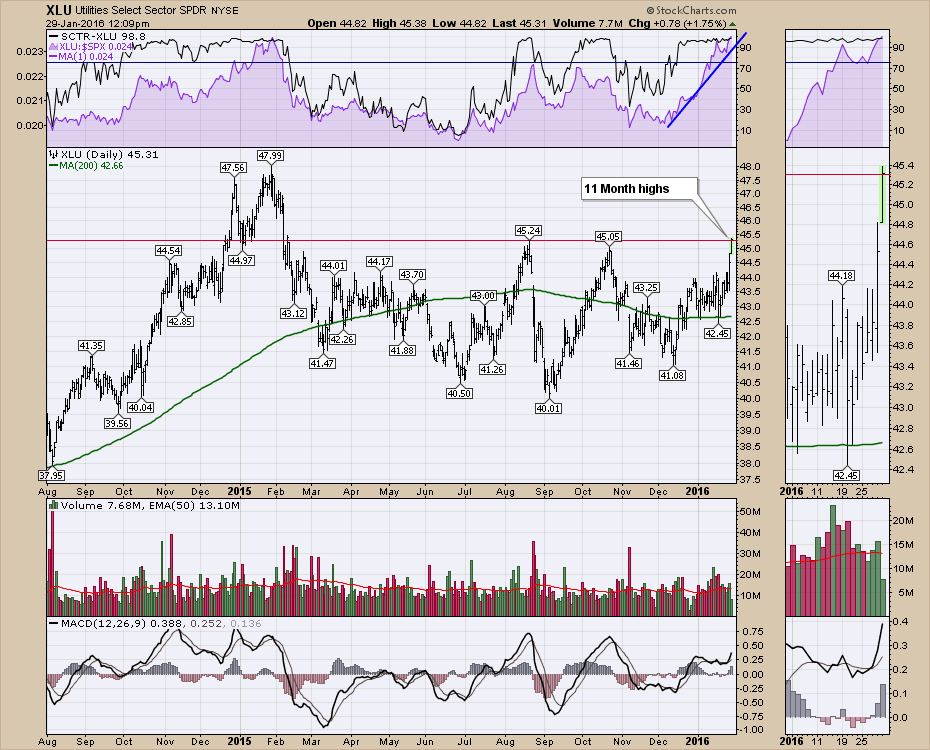
With all of the trend changes that started at the beginning of the year, one is just emerging and could end up being very popular. The Utilities Sector (XLU) popped to 11-month highs today... Read More
Don't Ignore This Chart! January 28, 2016 at 11:18 AM
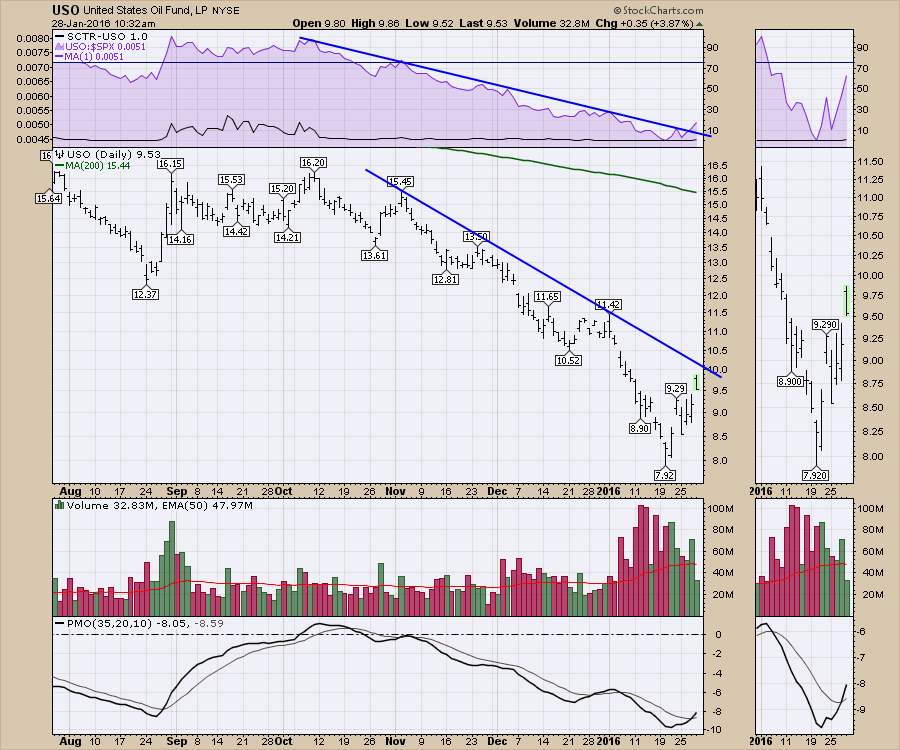
All of us old enough to remember John Wayne as the actor in the Hellfighters movie based on Red Adair's career of extinguishing blowouts might add some bourbon in their coffee this morning... Read More
Don't Ignore This Chart! January 27, 2016 at 12:08 PM
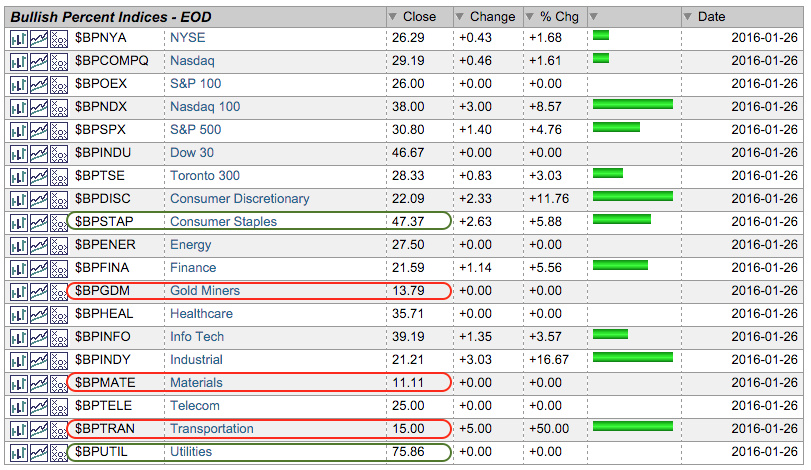
The selling pressure this year was broad enough to push all but one of the Bullish Percent Indexes below 50%, and most below 30%. Note that StockCharts tracks the Bullish Percent Index (BPI) for the ten sectors, several broad market indexes and the Gold Miners Index... Read More
Don't Ignore This Chart! January 26, 2016 at 01:14 PM
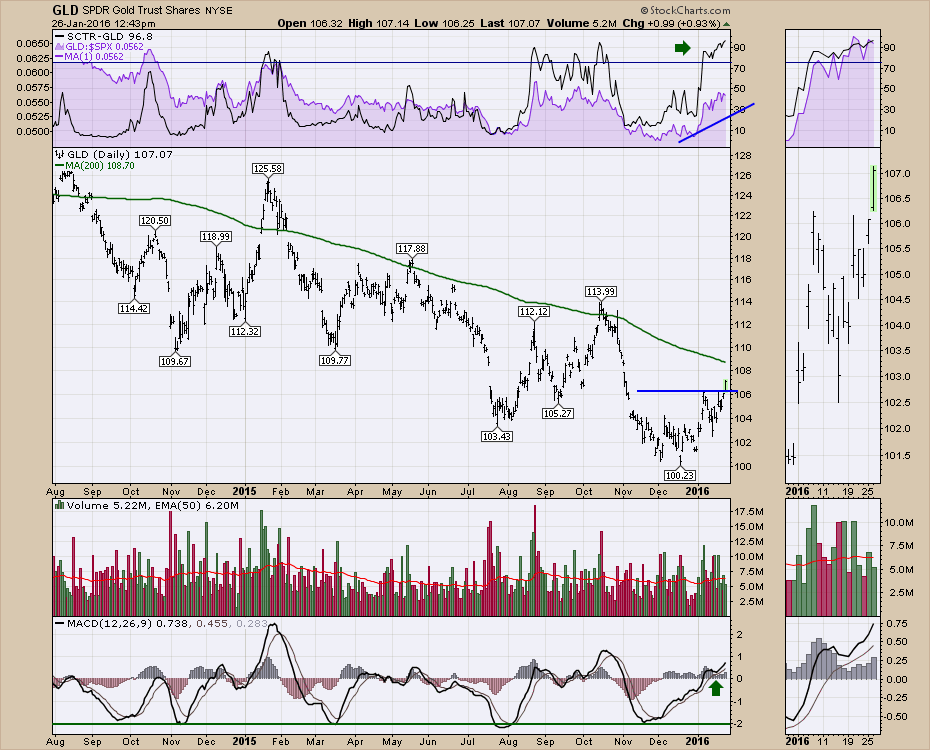
Last week on the Commodities Countdown webinar, I pointed out that there were a few signals suggesting Gold could start to run. Here is the link to that webinar. Commodities Countdown Webinar 20160121 Today, that looks to be underway... Read More
Don't Ignore This Chart! January 25, 2016 at 04:36 PM
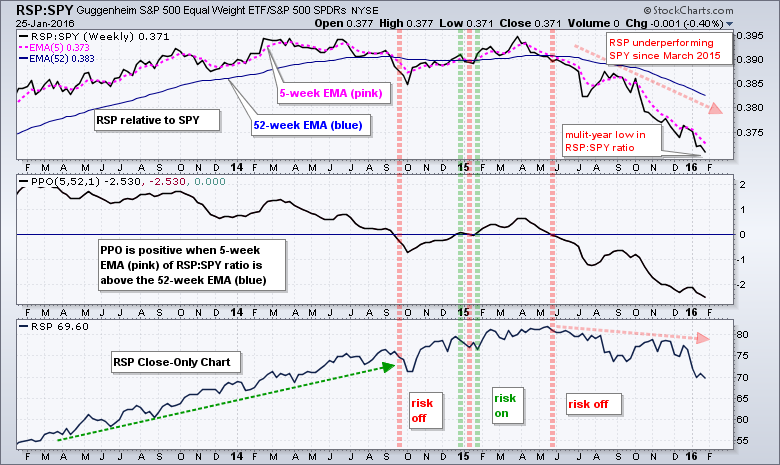
Among other ways, chartists can measure the risk appetite in the stock market by comparing the performance of the Equal-weight S&P 500 ETF (RSP) with the S&P 500 SPDR (SPY). RSP represents the average stock in the S&P 500 and the performance of small and mid caps... Read More
Don't Ignore This Chart! January 23, 2016 at 02:03 PM
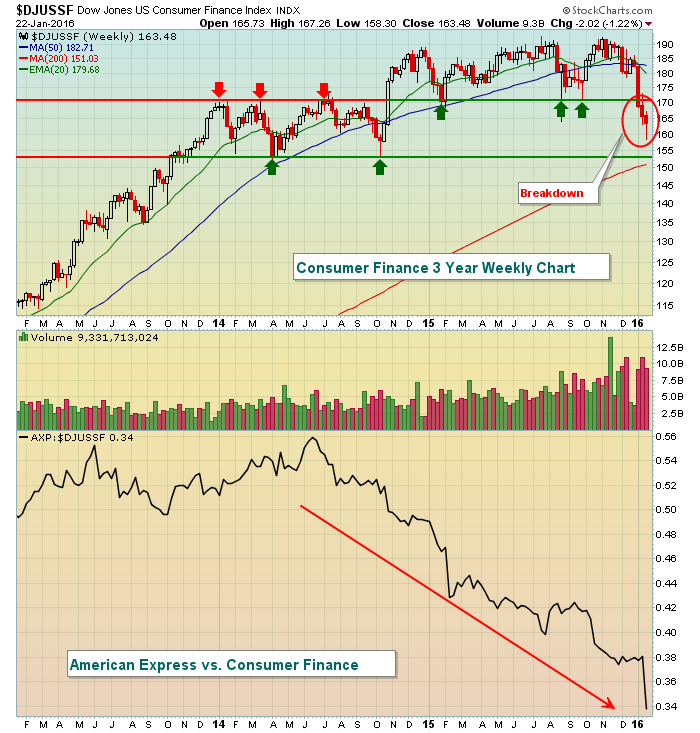
Consumer finance ($DJUSSF) recently broke below key price support at 170 and did so on heavy confirming volume. To make matters worse a key component - American Express (AXP) - disappointed Wall Street after Thursday's close with its quarterly earnings report... Read More
Don't Ignore This Chart! January 22, 2016 at 03:09 PM
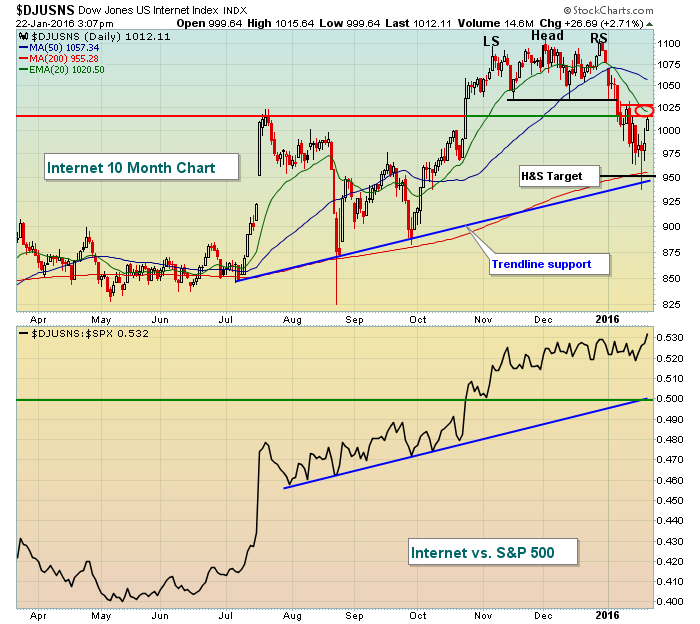
Much of the bull market was led higher by technology, particularly the Dow Jones U.S. Internet Index. So after the 2016 head & shoulders and long-term price breakdown, where might the current rally stall? The 1015-1025 range has proven in the past to be quite significant... Read More
Don't Ignore This Chart! January 21, 2016 at 03:01 PM
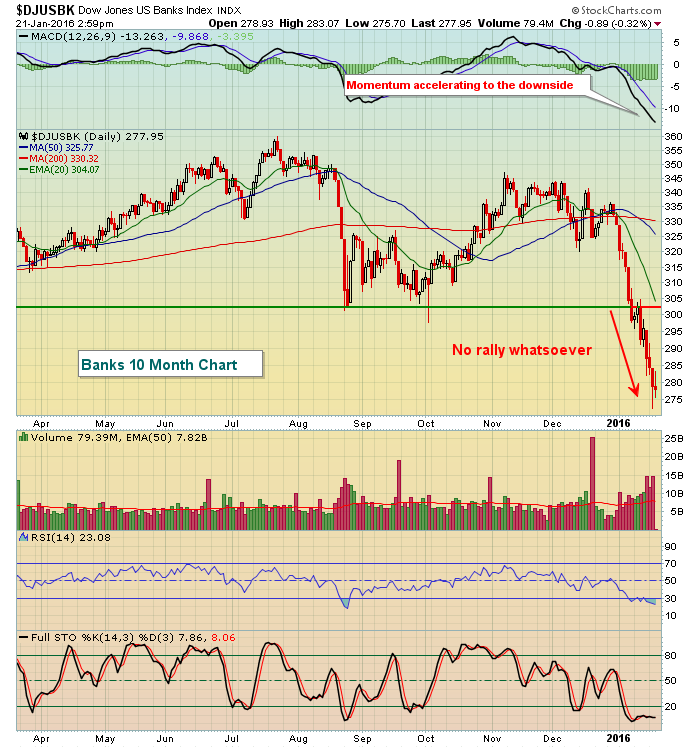
Banks ($DJUSBK) cannot catch a bid. Despite the market's attempt at a rally (finally!), no one appears to be intrigued by bank prospects... Read More
Don't Ignore This Chart! January 20, 2016 at 12:47 PM
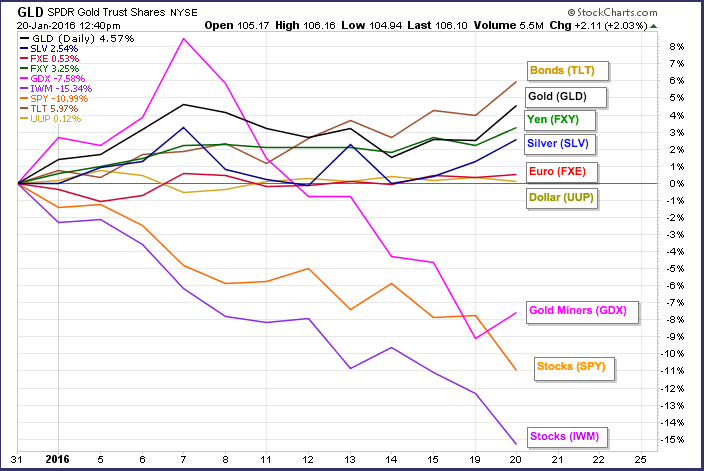
The Gold SPDR (GLD) and the Silver ETF (SLV) continue to attract money as alternatives to stocks and other commodities. GLD and SLV were down rather sharply in 2015, but both are up year-to-date in 2016. GLD is up over 4% and SLV is up just over 2%... Read More
Don't Ignore This Chart! January 19, 2016 at 06:10 PM
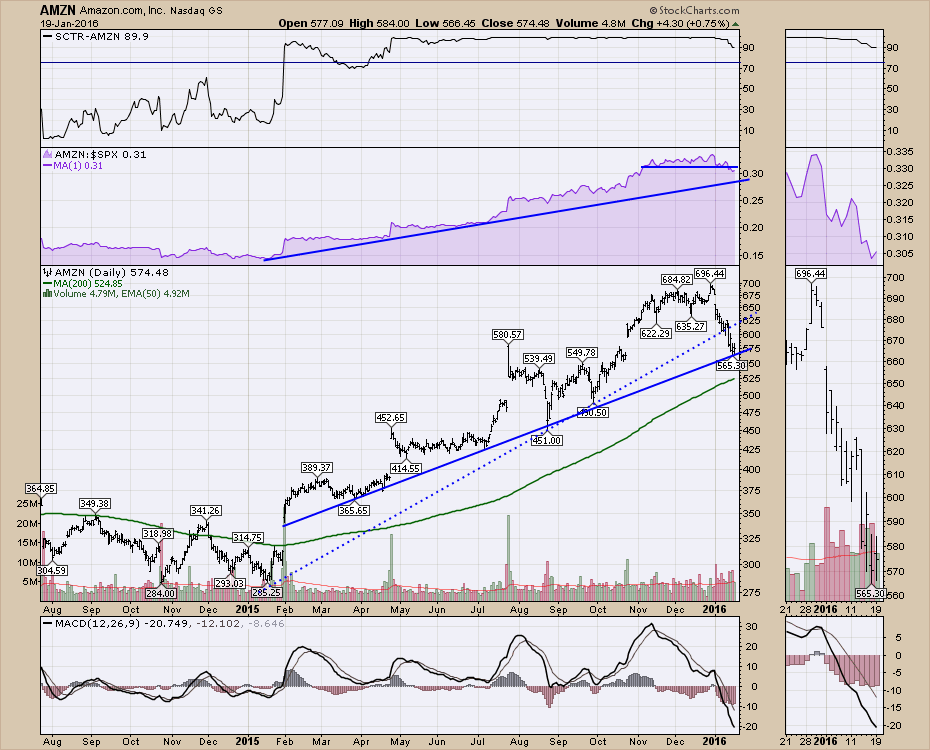
Amazon is becoming a much broader play than online retail and the stock has recently been reacting to the strength of the Amazon Web Services division results. I thought I would write about the drone driver and illustrate some of the points of confusion for technicians... Read More
Don't Ignore This Chart! January 17, 2016 at 07:37 PM
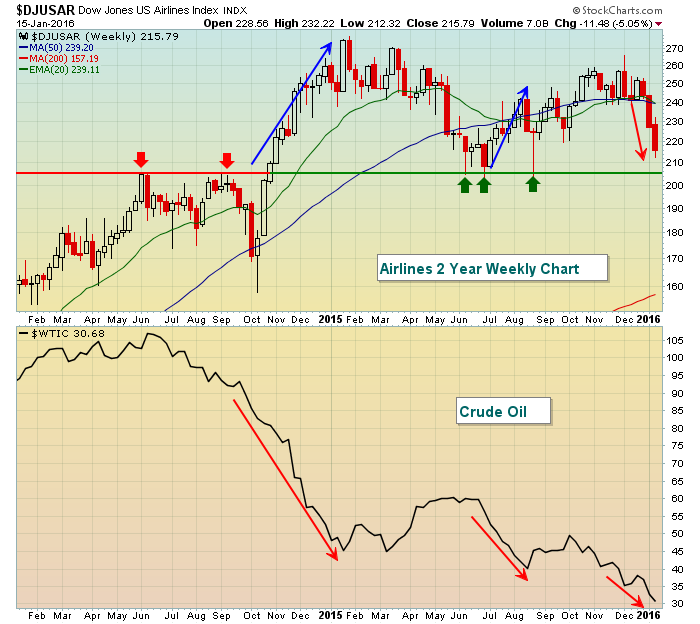
It would seem logical that falling crude oil prices ($WTIC) would help propel airlines ($DJUSAR) higher and rising crude oil prices would have the opposite effect. In the second half of 2014 and into early 2015, that was the case... Read More
Don't Ignore This Chart! January 15, 2016 at 03:08 PM
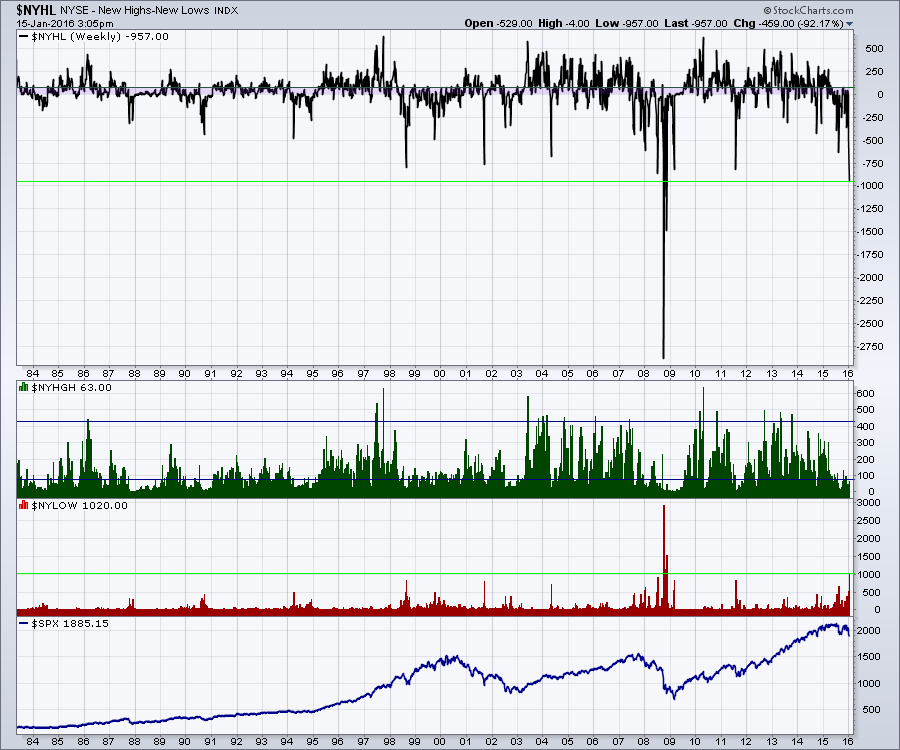
The market has been brutal. No doubt about it. The common question now is when will it end? I spent a lot of time on Thursday's webinar suggesting that the market was near extremes, but extremes can always become more extreme... Read More
Don't Ignore This Chart! January 14, 2016 at 04:29 PM
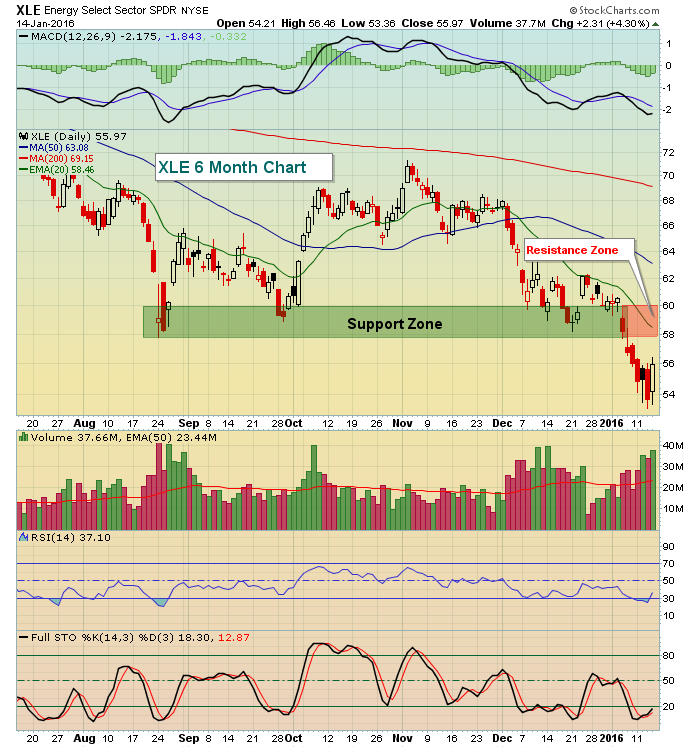
It's no secret that crude oil prices ($WTIC) have been tumbling over the past 18 months, but that has kept tremendous pressure on energy-related shares and the energy ETF (XLE). Crude oil managed to close back above $31 per barrel with the Dow Jones U.S... Read More
Don't Ignore This Chart! January 13, 2016 at 04:09 PM
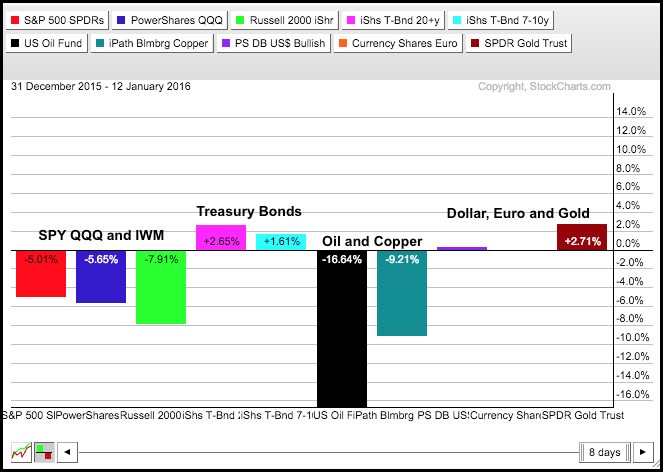
The year is young, but we are already seeing money move from relative risk (stocks) to relative safety (bonds). The PerfChart below shows the performance for ten intermarket ETFs year-to-date (12 January close)... Read More
Don't Ignore This Chart! January 11, 2016 at 11:42 PM
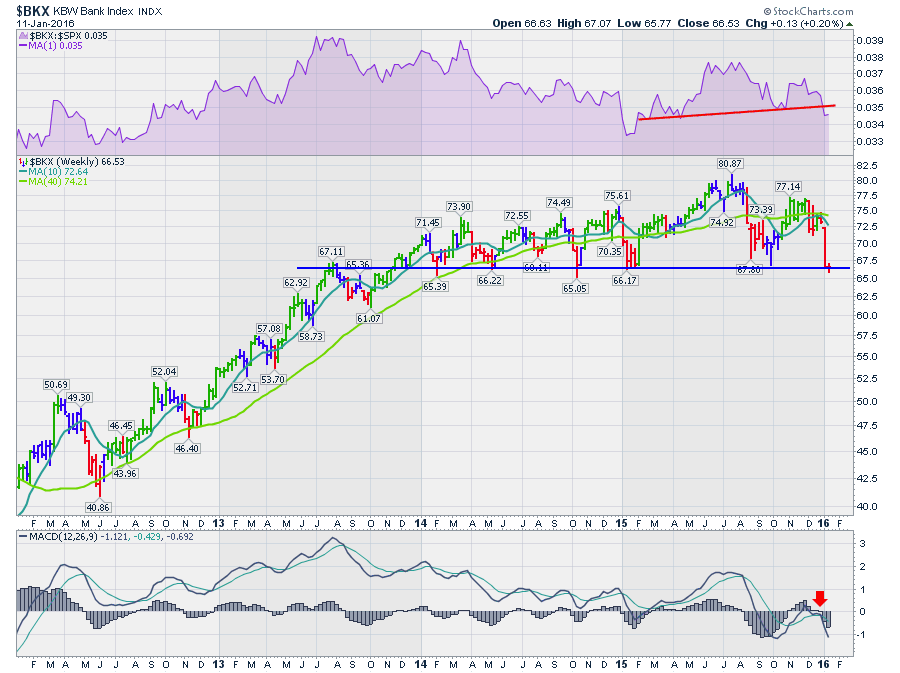
Much has been said that everything must be fine because the US Banks are holding up just fine. The Banking Index $BKX made new 52 week lows on Monday so that changes the narrative considerably in my mind... Read More
Don't Ignore This Chart! January 11, 2016 at 12:04 PM
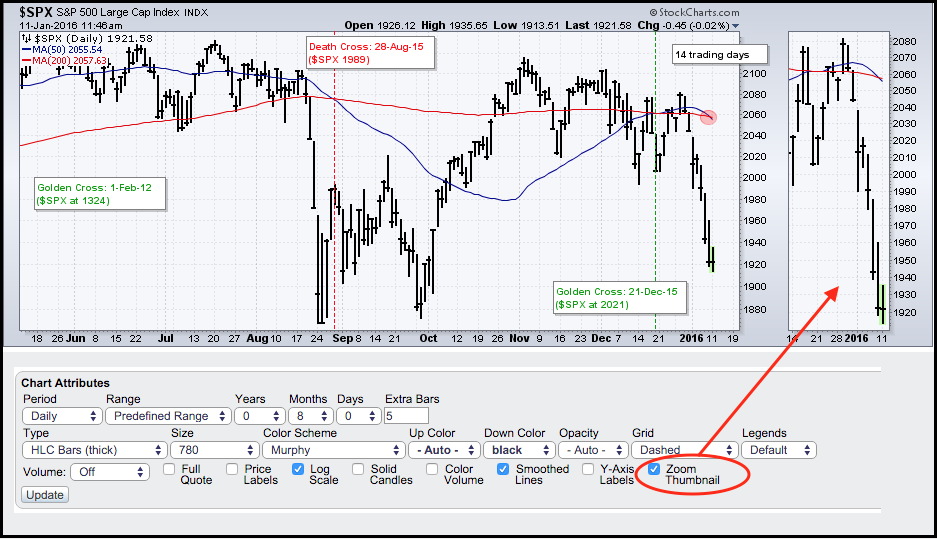
Stocks took it on the chin over the last two weeks with the S&P 500 falling over 7% in just seven trading sessions (30-Dec to 8-Jan). The depth of this decline forced the 50-day moving average down and it is currently below the 200-day moving average... Read More
Don't Ignore This Chart! January 09, 2016 at 10:15 AM
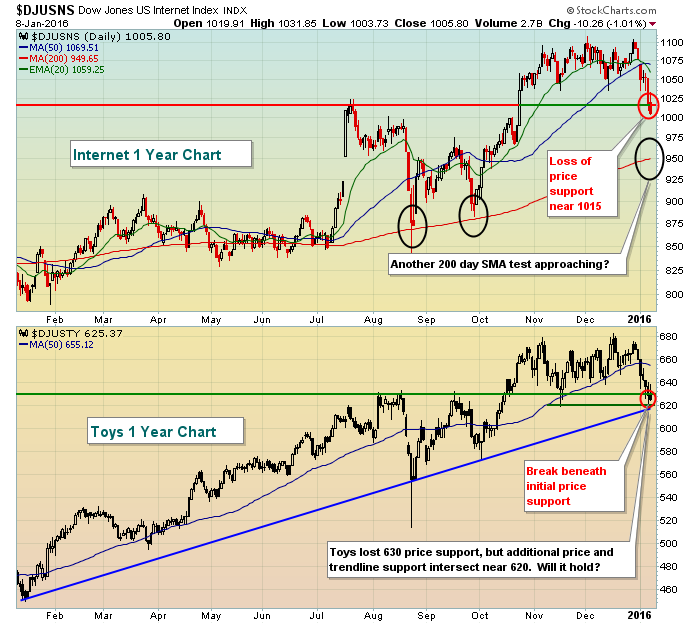
Over the past year, the Dow Jones U.S. Internet Index ($DJUSNS) has risen 23% while the only industry group to outperform the DJUSNS has been the Dow Jones U.S. Toys Index ($DJUSTY), which has risen 31%... Read More
Don't Ignore This Chart! January 07, 2016 at 01:18 PM
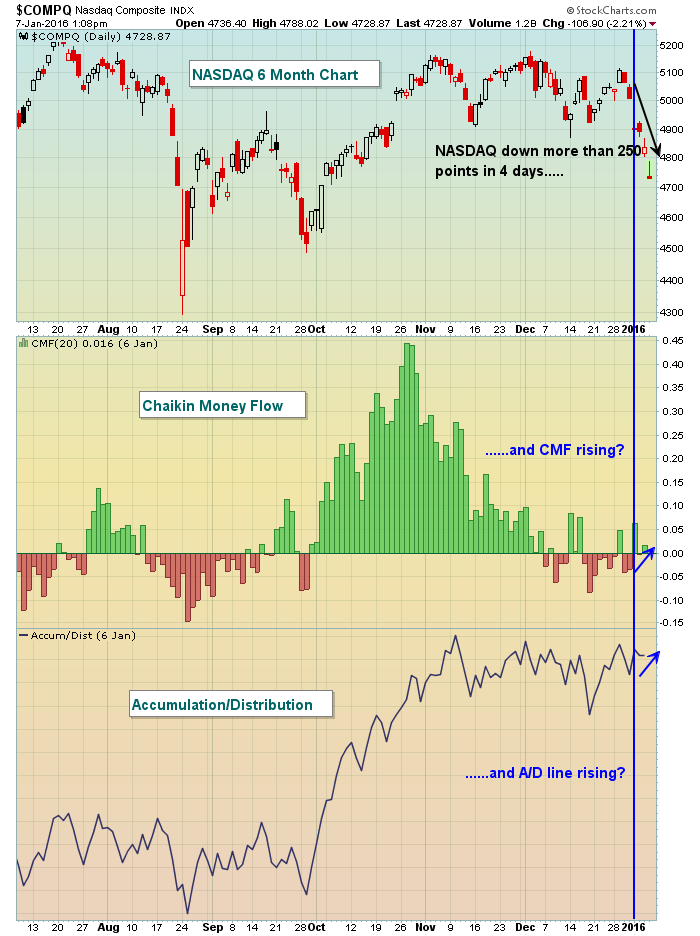
If you've ever used the Chaikin Money Flow (CMF) or Accumulation/Distribution (AD) as indicators to help gauge buying and selling pressure, just make a note that gaps to both the upside and downside are ignored in their calculations. Let's take the NASDAQ Composite as an example... Read More
Don't Ignore This Chart! January 06, 2016 at 11:47 AM
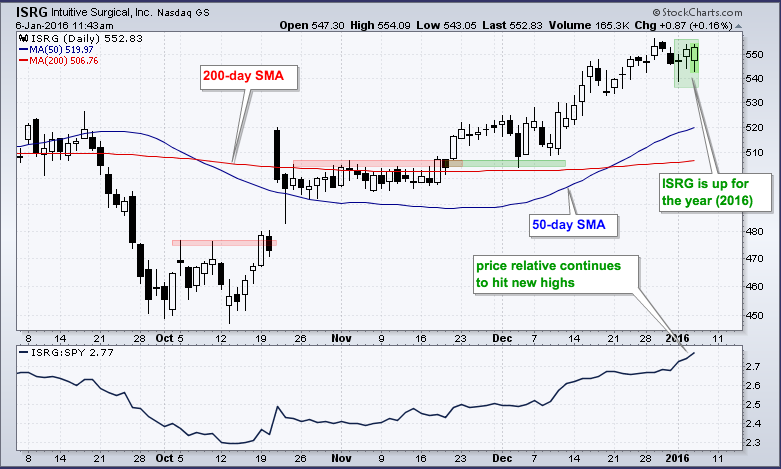
Not many stocks are currently up year to date and those that are show good relative strength in the face of broad selling pressure... Read More
Don't Ignore This Chart! January 05, 2016 at 03:54 PM
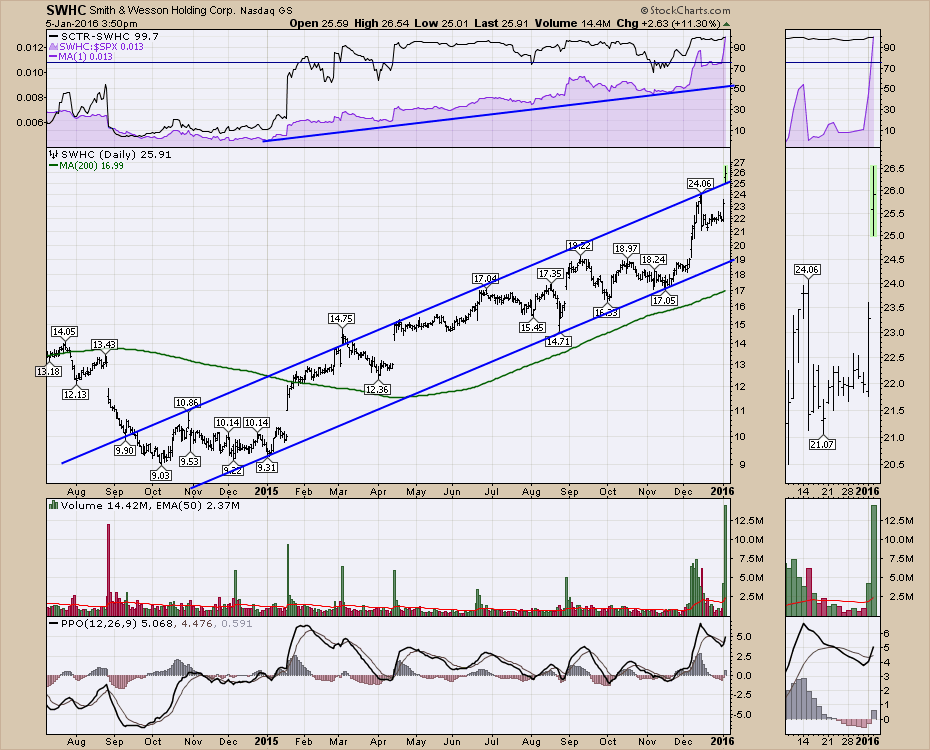
Smith & Wesson (SWHC) accelerated on extreme volume today as the White House proposed a new series of executive actions to curb gun violence. The stock has been a triple in the last year and the SCTR has outperformed with the ranking staying above 75 for most of the year... Read More
Don't Ignore This Chart! January 04, 2016 at 10:10 AM
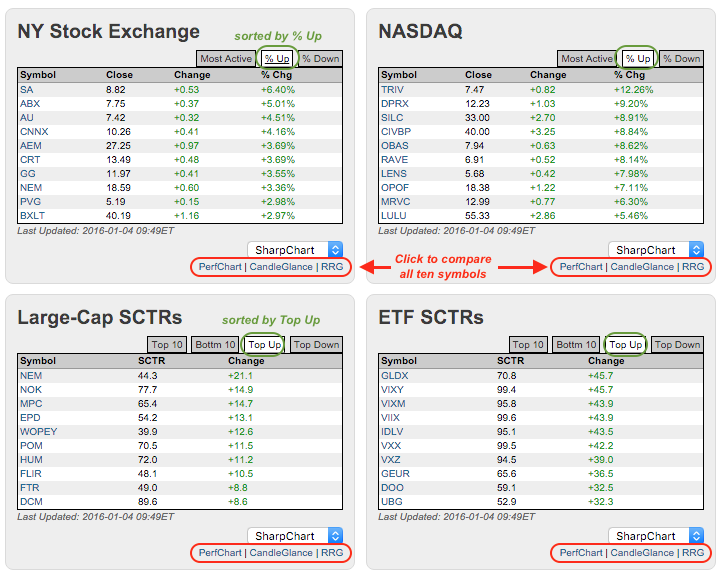
Stocks were hit hard on the open of the first trading day of 2016 with the vast majority falling, and falling sharply. There were a few pockets of strength and chartists can find these using the tables on the home page (midway down)... Read More
Don't Ignore This Chart! January 03, 2016 at 05:49 PM
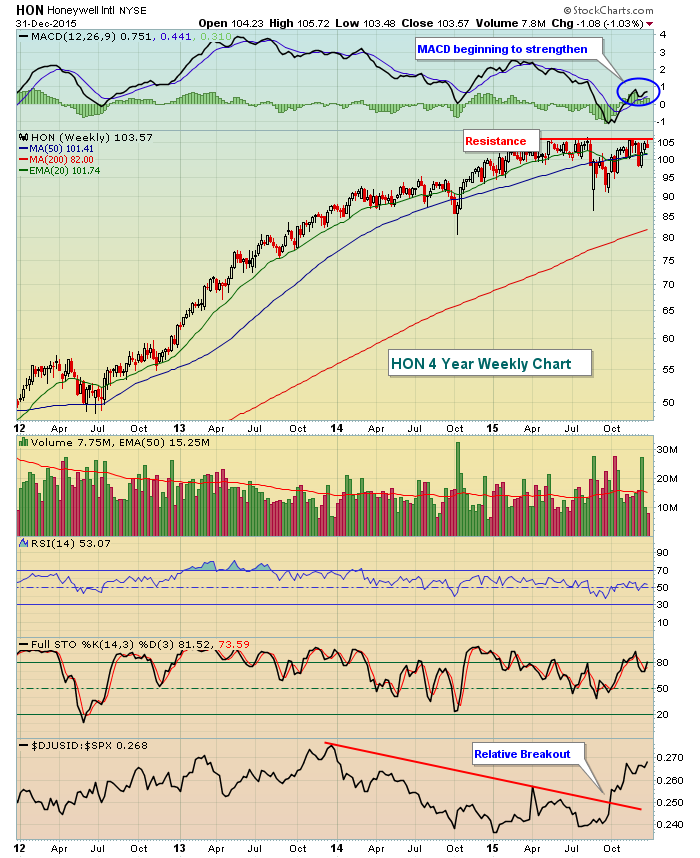
Honeywell (HON) is part of the diversified industrials ($DJUSID) that saw excellent relative strength in the fourth quarter of 2015. General Electric (GE) reported excellent quarterly results in October and moved to its highest level in 15 years last week... Read More