Don't Ignore This Chart! March 31, 2016 at 04:05 PM
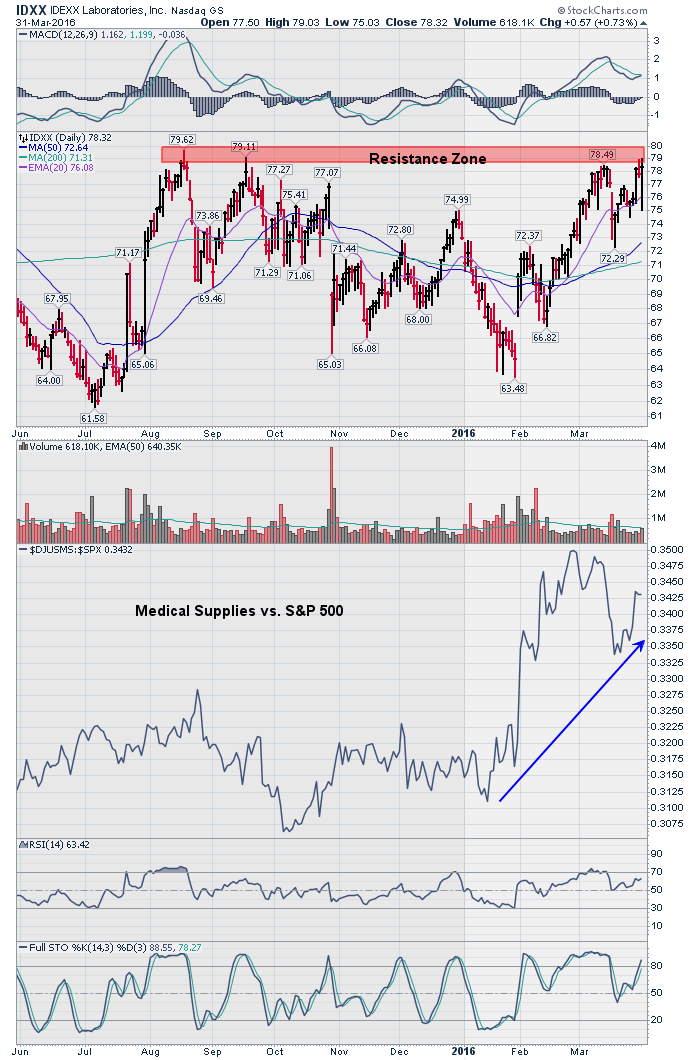
Earlier today, IDEXX Laboratories (IDXX) fell beneath its rising 20 day EMA but quickly recovered and is now on the verge of breaking above a quadruple top in the 79-80 range. Volume isn't huge, but it is increasing so a breakout should be respected... Read More
Don't Ignore This Chart! March 30, 2016 at 08:54 PM
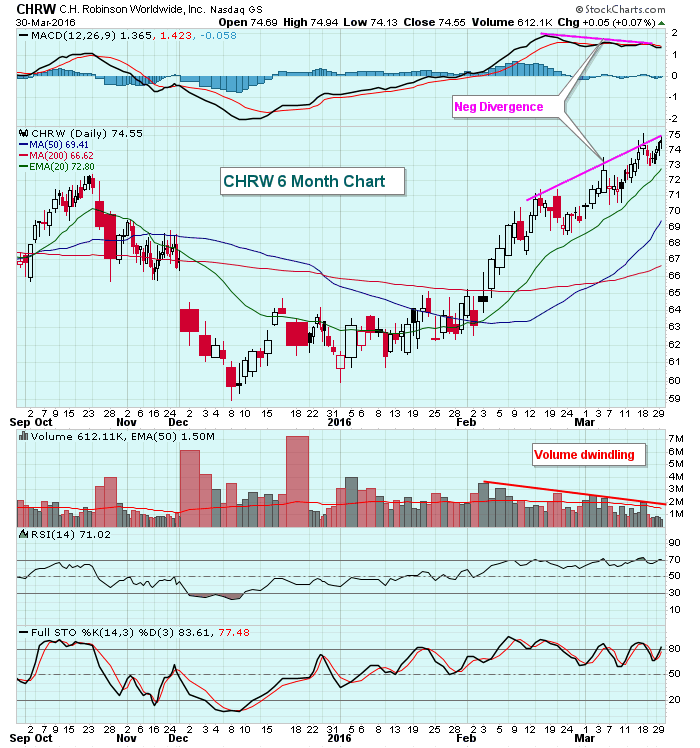
The rally in the S&P 500 has been impressive and truckers ($DJUSTK) have been among the best performing industry groups, rising 17% over the past three months. That actually places truckers as the leading industry group within the industrials over that time frame. C. H... Read More
Don't Ignore This Chart! March 29, 2016 at 11:30 AM
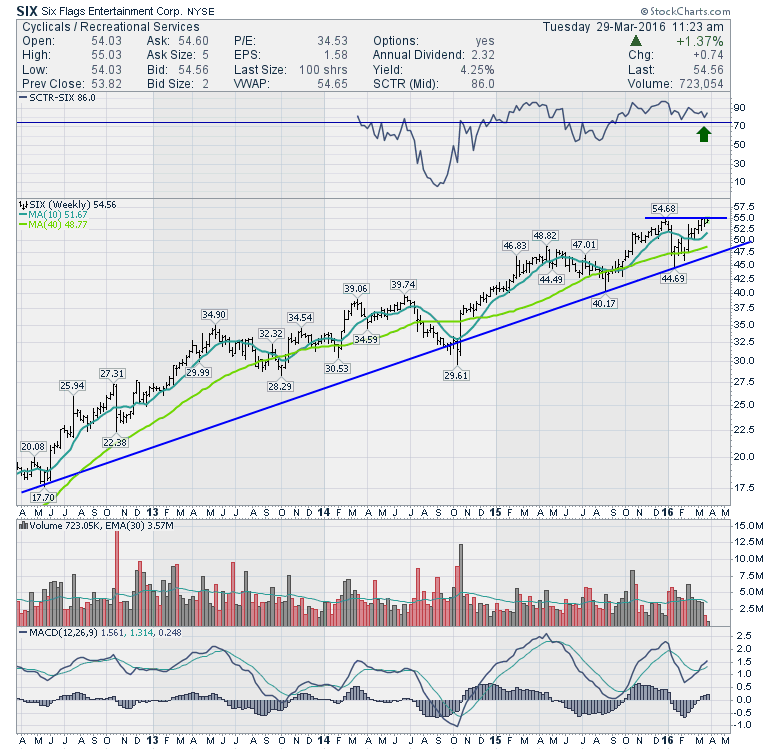
While the process of investing is commonly associated with a rollercoaster ride, the Six Flags Entertainment Corp. (SIX) continues a smooth and steady climb from bottom left to top right. After pulling back from the highs in December, the stock is breaking out once again... Read More
Don't Ignore This Chart! March 28, 2016 at 06:53 AM
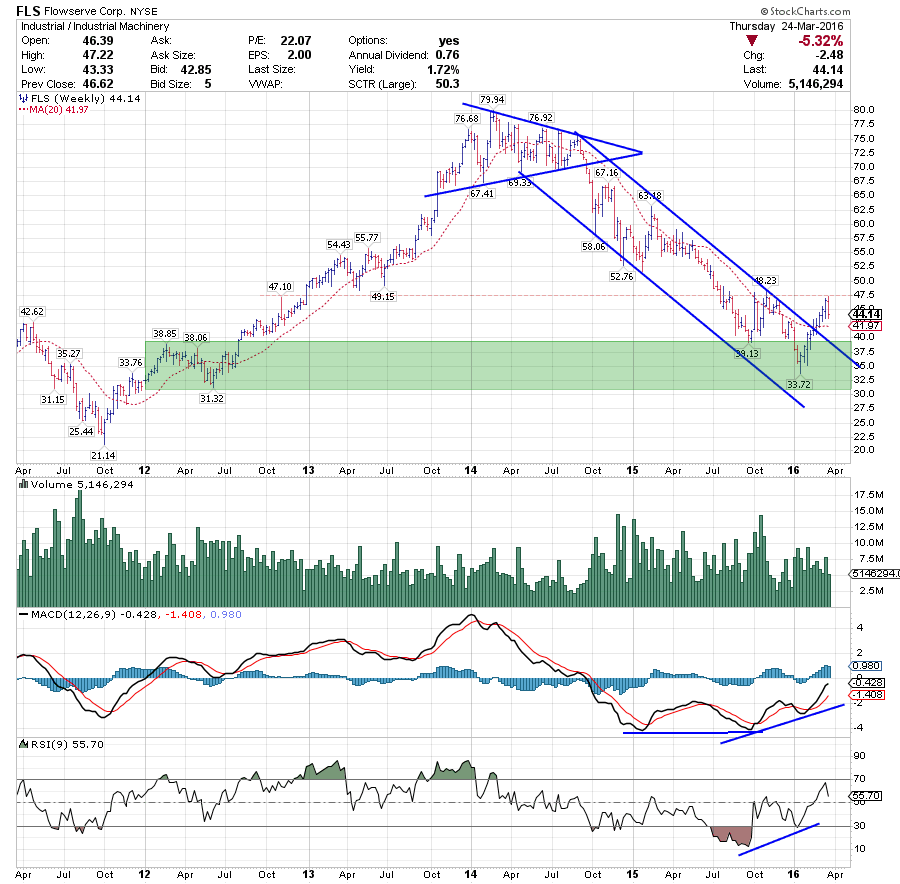
FLS is a stock that has been pretty much off the radar for two years as a potential long candidate, but this looks to be changing now! After breaking out of an almost perfect symmetrical triangle in 2014, FLS trended lower until the beginning of this year, when a low ($33... Read More
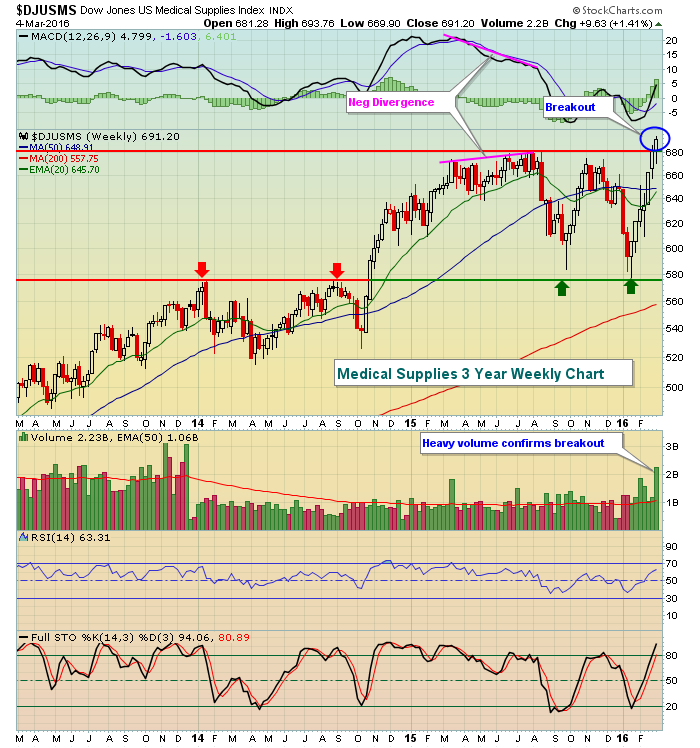
Don't Ignore This Chart! March 26, 2016 at 01:59 PM
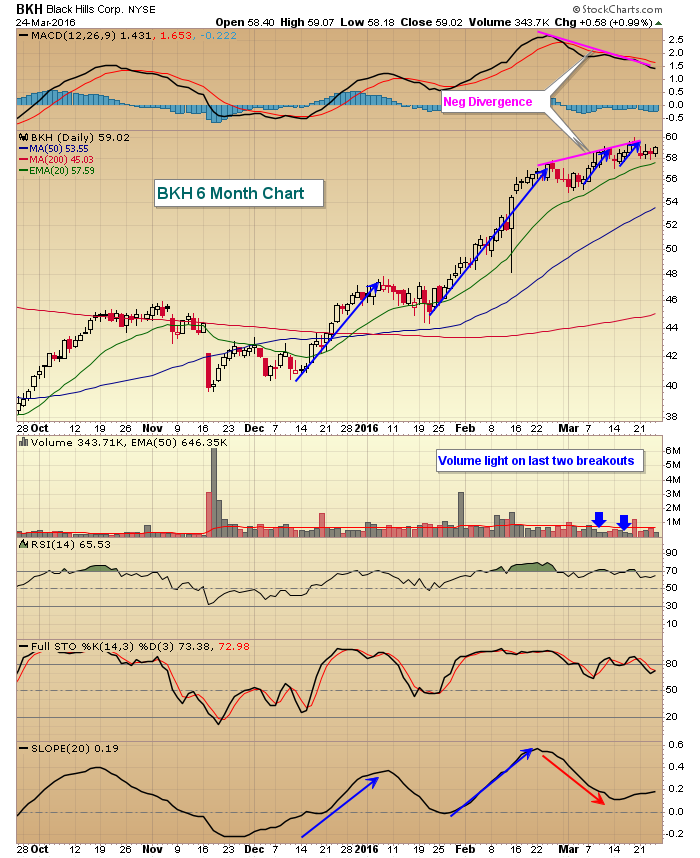
From a short- to intermediate-term trading perspective, slowing momentum to the upside is a warning sign if you're long. Slowing momentum can come in different forms, but I consider negative divergences on the MACD and weak volume on price breakouts to be two solid examples... Read More
Don't Ignore This Chart! March 25, 2016 at 10:38 PM
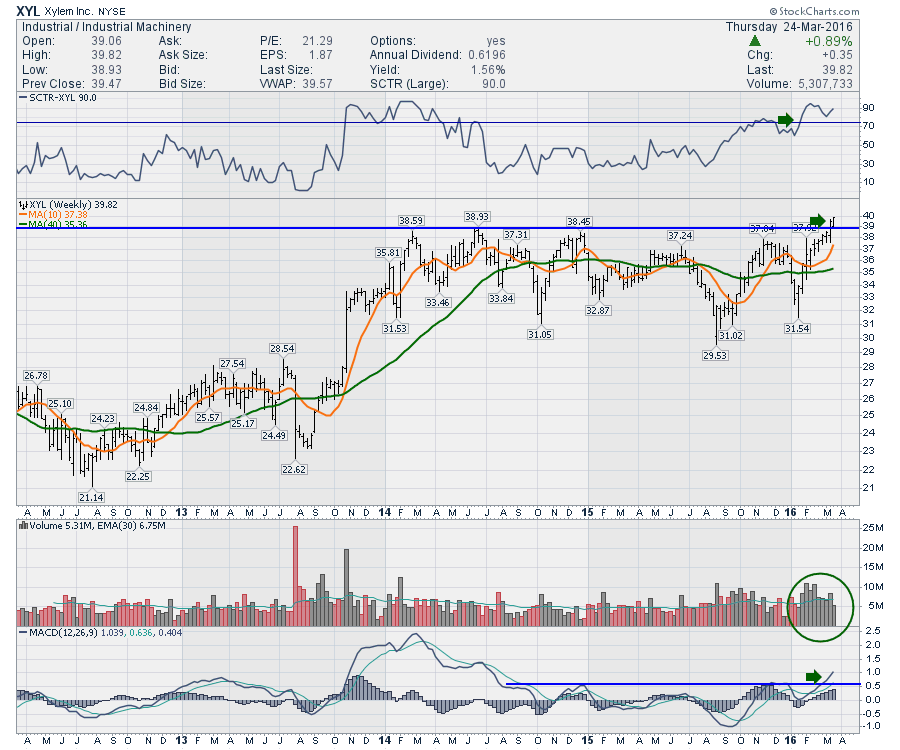
Xylem (XYL) is a provider of water solutions. The chart has been resisting breaking out through the $39.00 for some time. This week, the price action held above the previous high ($38.93) and went on to close at the highs... Read More
Don't Ignore This Chart! March 24, 2016 at 01:02 PM
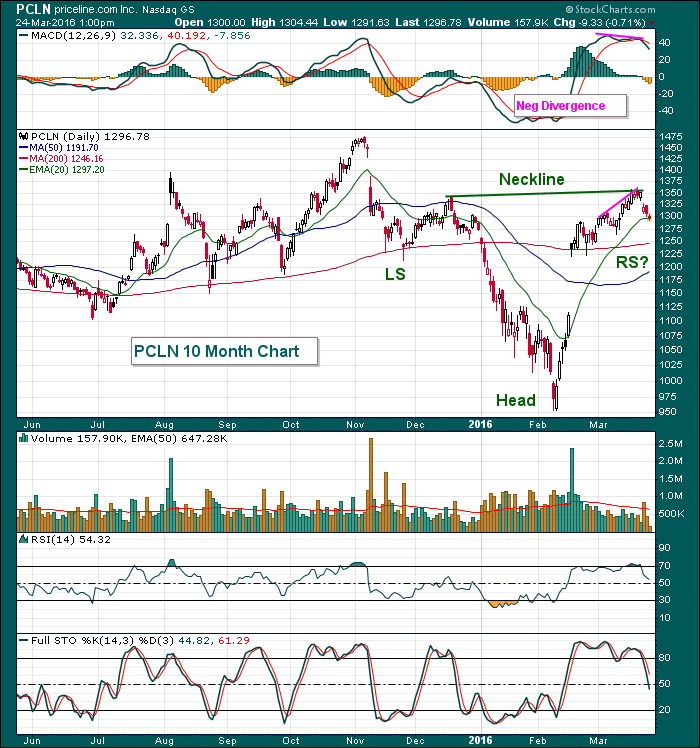
Priceline (PCLN) has seen lots of volatility over the past several months including sizable gaps higher and lower, but the technical picture remains bright... Read More
Don't Ignore This Chart! March 23, 2016 at 11:44 AM
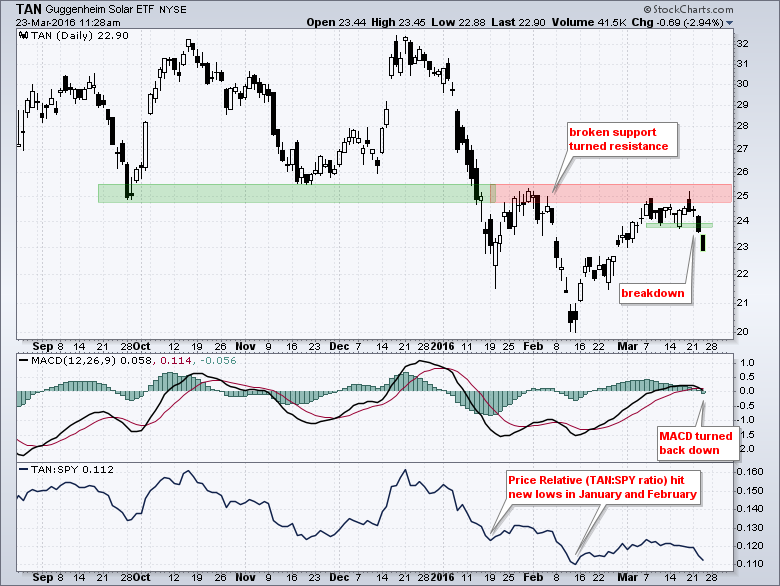
The Solar Energy ETF (TAN) has been one of the weakest industry group ETFs over the past year and that looks set to continue with the recent breakdown. The chart shows TAN bouncing with the market from mid February to mid March and hitting resistance near broken support... Read More
Don't Ignore This Chart! March 22, 2016 at 11:42 AM
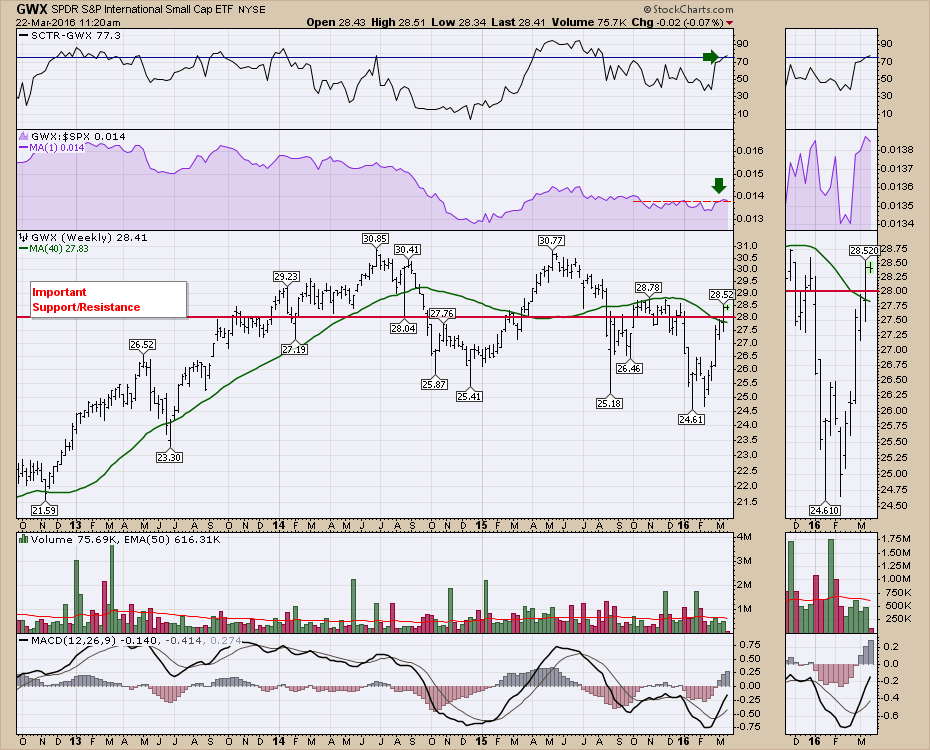
While the world tries to solve the riddle of global demand, the Internation Small Cap ETF (GWX) moved above resistance last week and needs to hold $28 to remain bullish. The chart shows some nice trends. The SCTR is trying to push above 75... Read More
Don't Ignore This Chart! March 21, 2016 at 05:45 PM
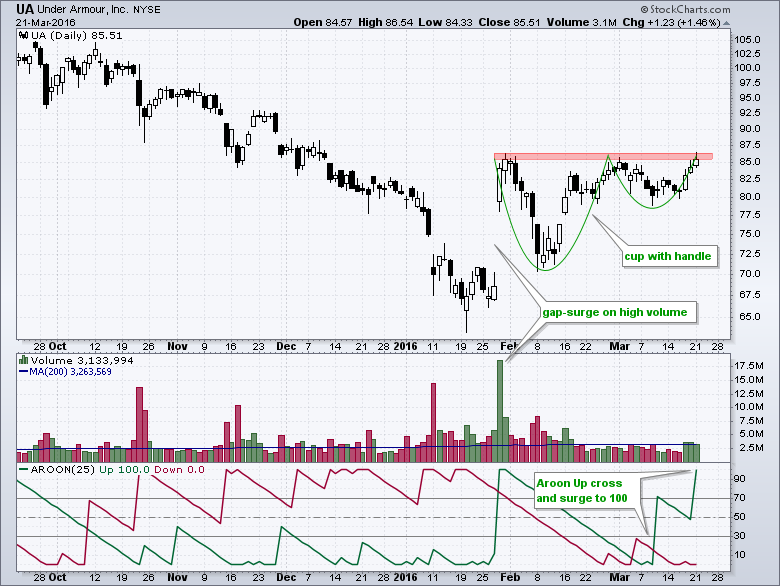
UA is attracting buying interest as March madness moves to the sweet sixteen. Note that UA sponsored 10 teams at the start of the tournament, including Utah and Notre Dame. On the price chart, the stock has a bullish cup-with-handle pattern taking shape... Read More
Don't Ignore This Chart! March 20, 2016 at 12:50 PM
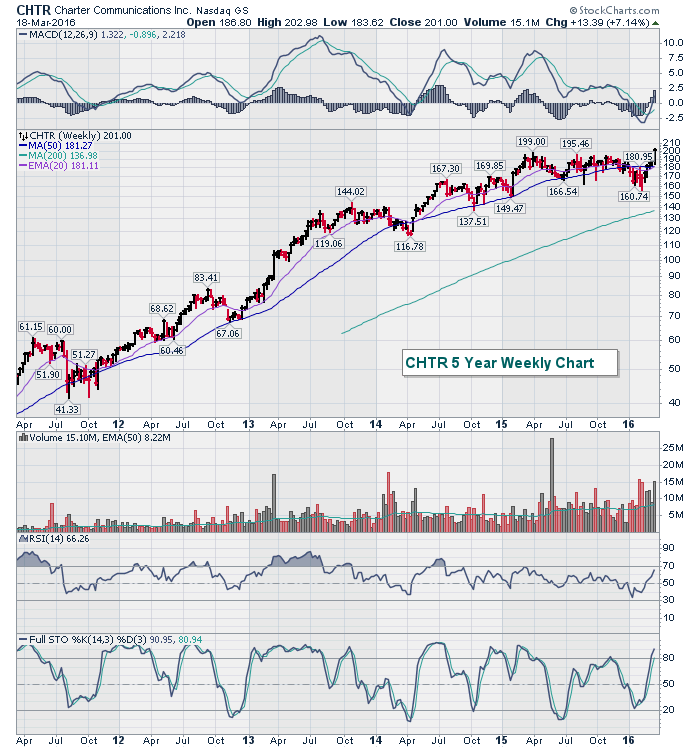
Despite all the market volatility and weakness over the past year, CHTR has held steady in its uptrend and has been consolidating throughout. It was awaiting a heavy volume breakout, but it's waiting no more... Read More
Don't Ignore This Chart! March 18, 2016 at 02:35 PM
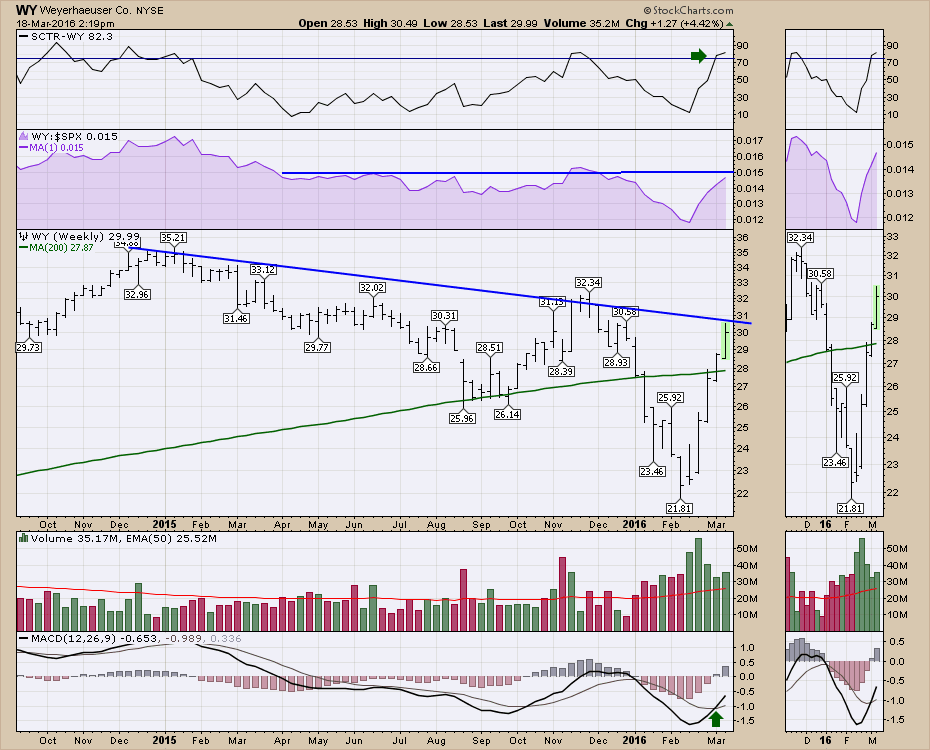
Weyerhaeuser (WY) has recently surged off the lows. This chart is interesting as the board price for lumber recently surged above a trend line by 10% in 3 days! The chart shows that this was the fastest advance in the last year and looks set to saw through the trend line... Read More
Don't Ignore This Chart! March 17, 2016 at 01:55 PM
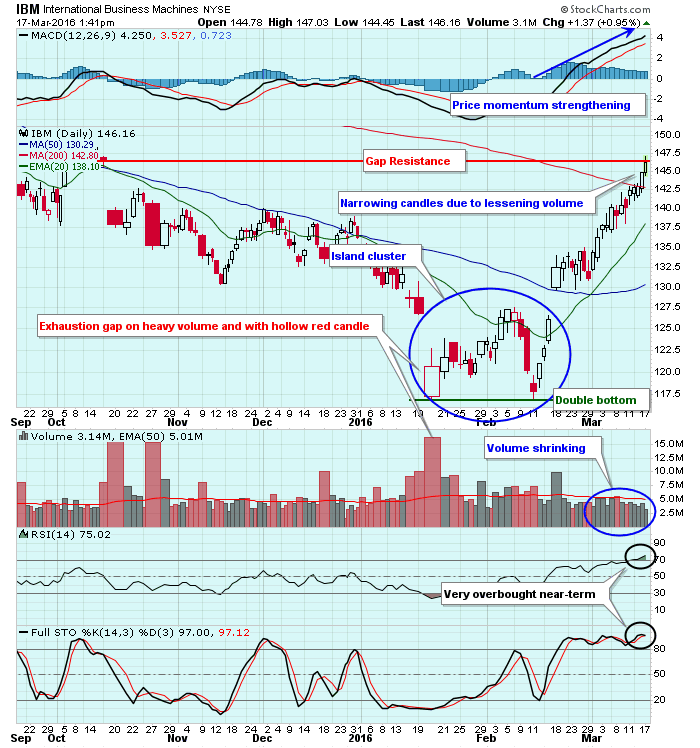
IBM had been under intense selling pressure and had lost more than 40% of its market cap from its March 2013 high to its early 2016 double bottom low near 117.00... Read More
Don't Ignore This Chart! March 16, 2016 at 12:45 PM
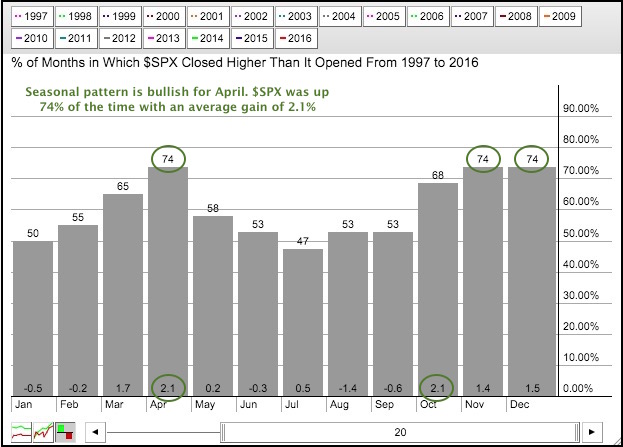
The chart below shows the seasonal patterns for the S&P 500 over the last twenty years. The bars show the percent of months that the S&P 500 closed positive and the numbers at the bottom show the average change. Three months stand out from the rest: April, November and December... Read More
Don't Ignore This Chart! March 15, 2016 at 04:20 PM
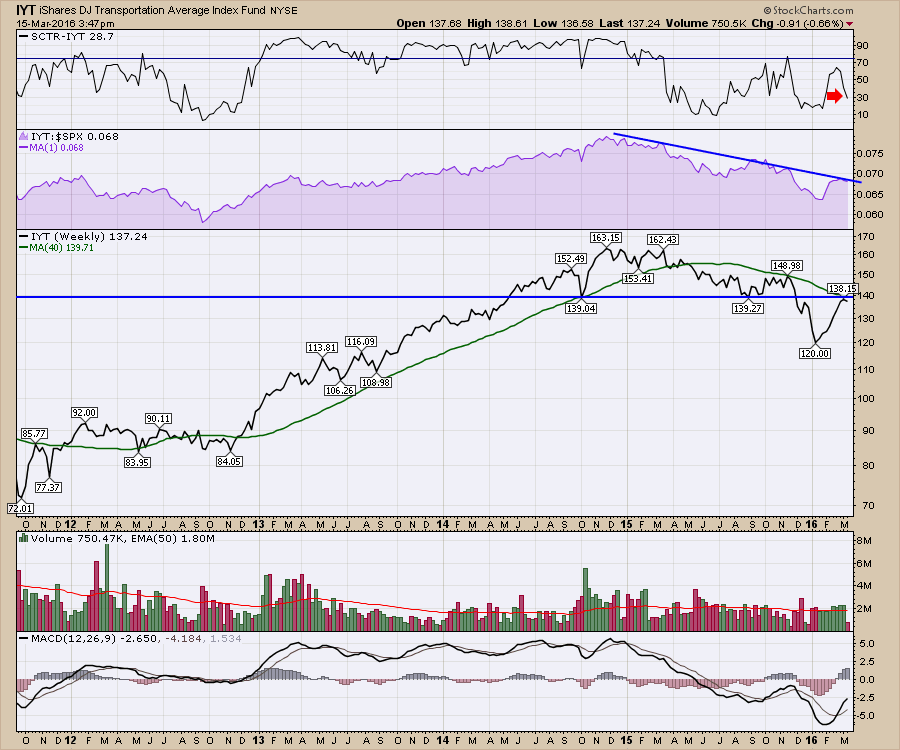
The Transport ETF (IYT) has been a great ETF for a technical analysis example. So far, it is carrying the typical information we would expect from a transportation ETF. This basic knowledge principle goes back to Charles Dow, the Father of the Dow Jones Industrial Average... Read More
Don't Ignore This Chart! March 14, 2016 at 01:17 PM
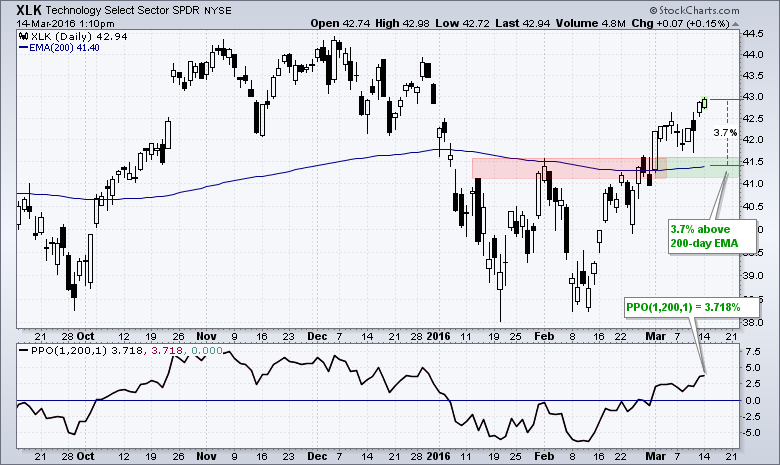
Chartists can measure relative performance by comparing the price to a moving average. In particular, I am going to measure the percentage above or below the 200-day EMA using the Percentage Price Oscillator (PPO)... Read More
Don't Ignore This Chart! March 13, 2016 at 06:18 PM
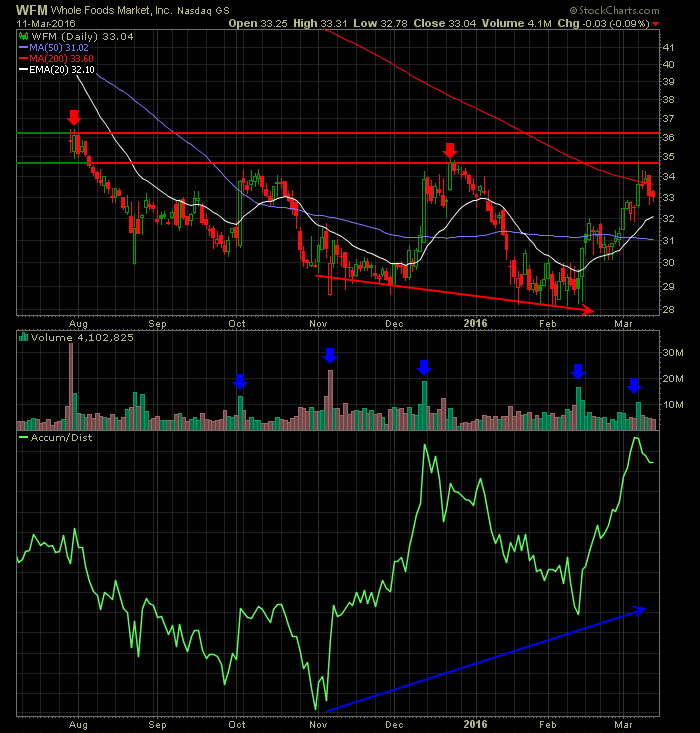
Whole Foods Market (WFM) has been trading in sideways fashion for the past several months and its long-term weekly chart isn't one of the strongest. But there are signs that better fundamental days lie ahead based on technical signs of accumulation... Read More
Don't Ignore This Chart! March 10, 2016 at 11:47 PM
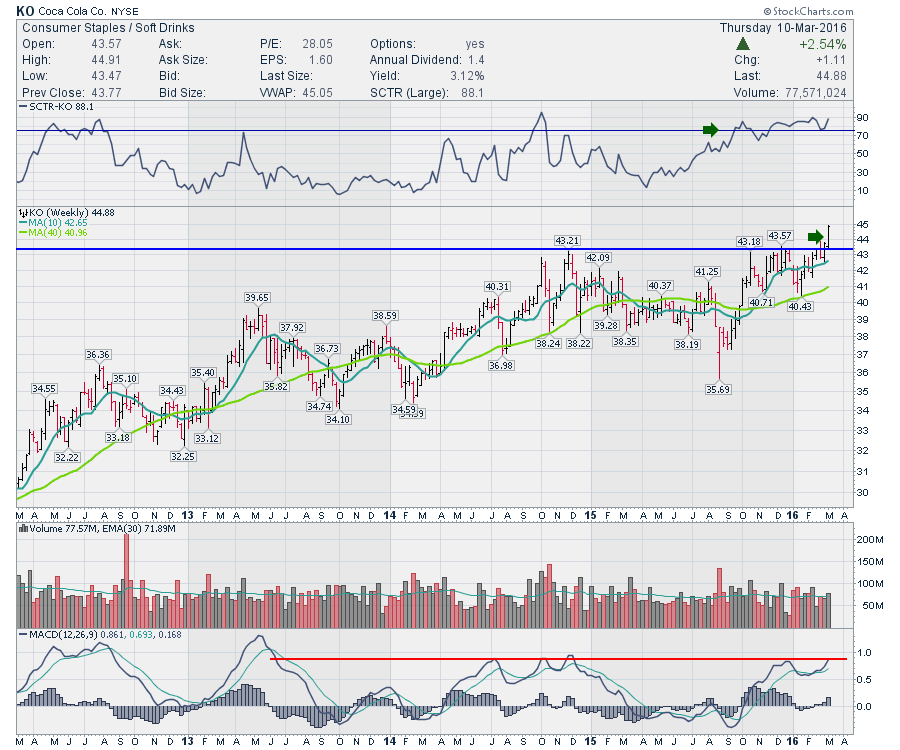
The new-highs list is littered with Consumer Staples and Utilities Companies. This week, Coca-Cola (KO) popped to new highs and the chart looks great. The SCTR is nice and high. The breakout looks like a textbook breakout... Read More
Don't Ignore This Chart! March 10, 2016 at 01:43 PM
The European Central Bank (ECB) announced its latest quantitative easing measures and though they initially moved global markets higher, the focus now seems to have turned to ECB President Draghi's comment that further interest rate cuts aren't likely... Read More
Don't Ignore This Chart! March 09, 2016 at 12:03 PM
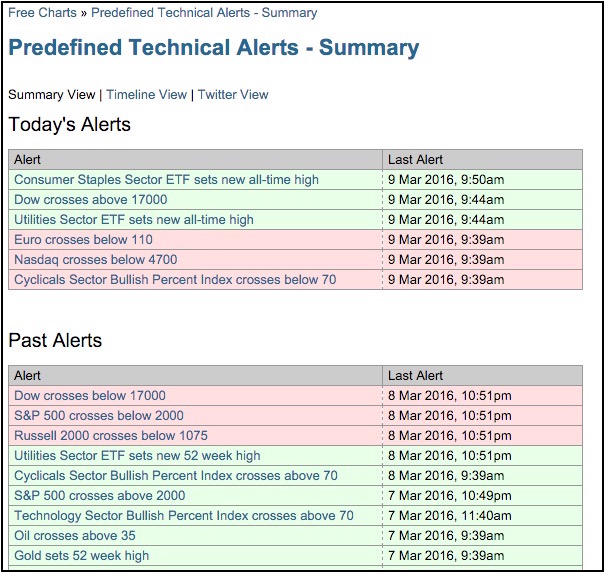
Two of the nine sector SPDRs hit new 52-week highs today (March 9th) - and I bet you can figure out which ones. The image below comes from the pre-defined technical alerts page. Notice that we had three bullish alerts (green) and three bearish (red)... Read More
Don't Ignore This Chart! March 08, 2016 at 11:12 AM
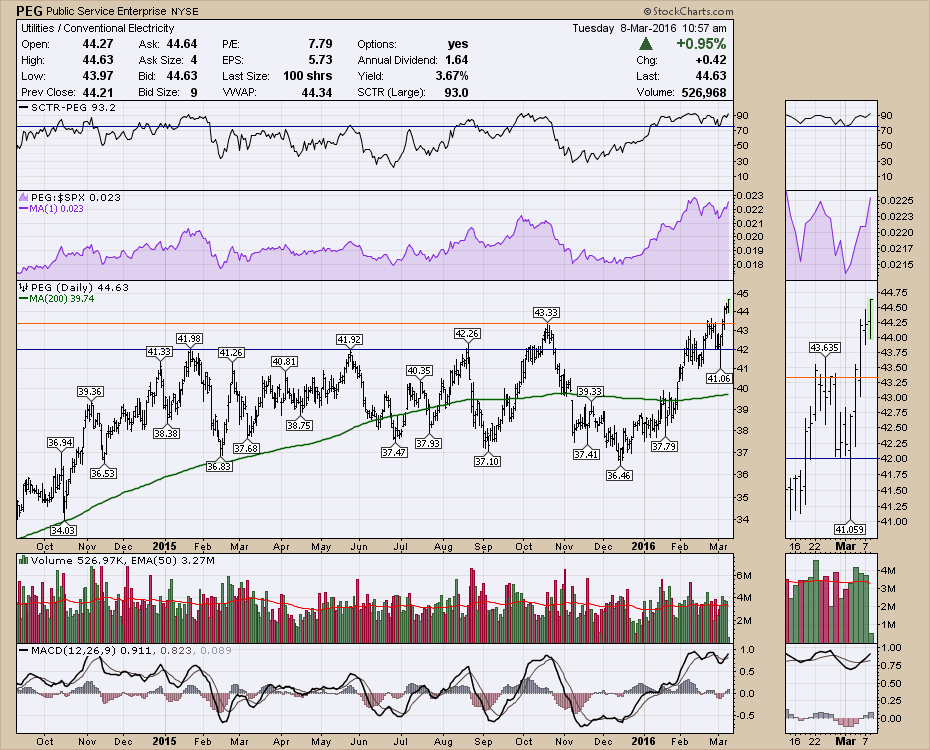
The ChartWatchers newsletter on the weekend had varying opinions on this rally starting a new bull market trend. With the wide range of perspectives on the market, it is always interesting to read how our market writers are analyzing the market... Read More
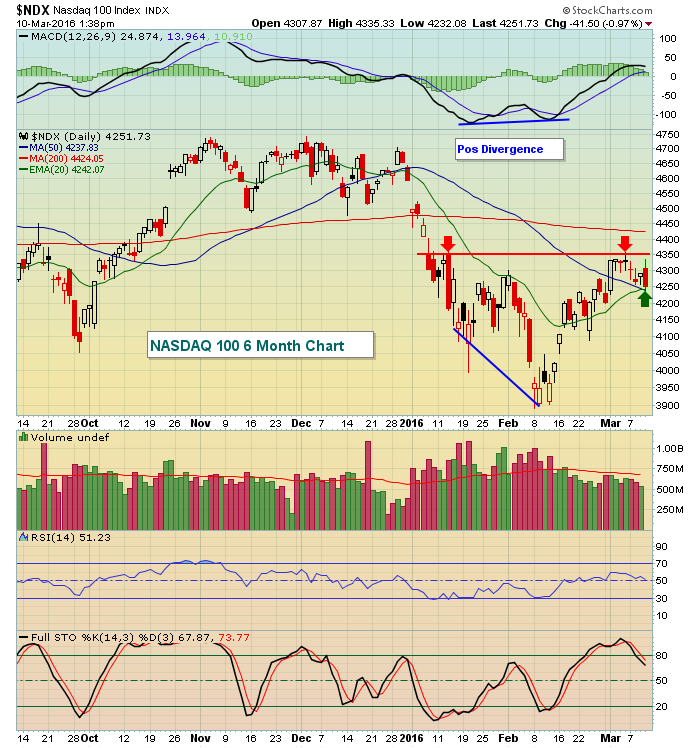
Don't Ignore This Chart! March 07, 2016 at 02:35 PM
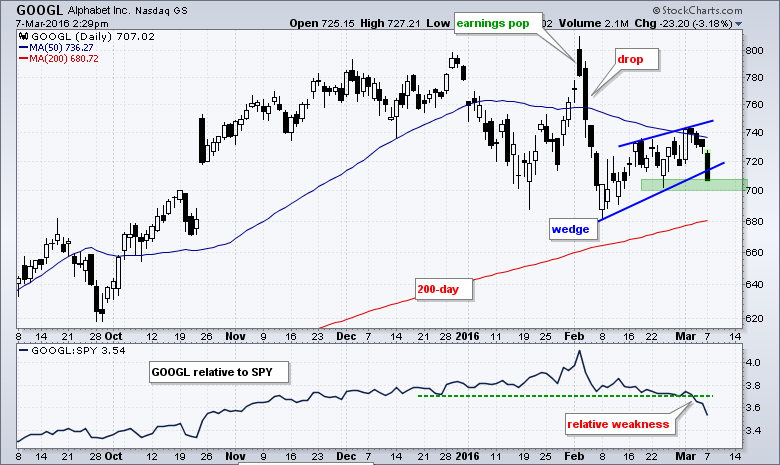
Alphabet (GOOGL) is weighing on the Nasdaq 100 ETF as it fails at the 50-day simple moving average and the price relative breaks down. The six month candlestick chart shows GOOGL surging to 800 after earnings and then immediately falling back below 700 in early February... Read More
Don't Ignore This Chart! March 06, 2016 at 04:41 PM
2016 has not been a very good year, although the rally the past few weeks has alleviated some of the earlier pain. I guess we should party like it's 1999.99 because that's where the S&P 500 closed on Friday... Read More
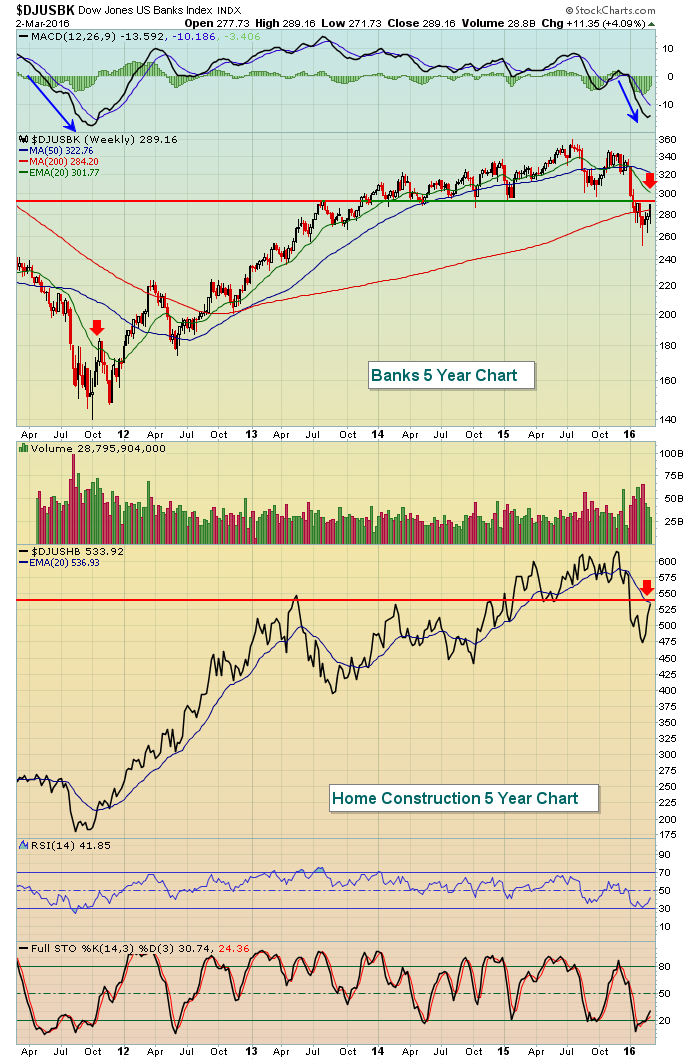
Don't Ignore This Chart! March 04, 2016 at 01:59 PM
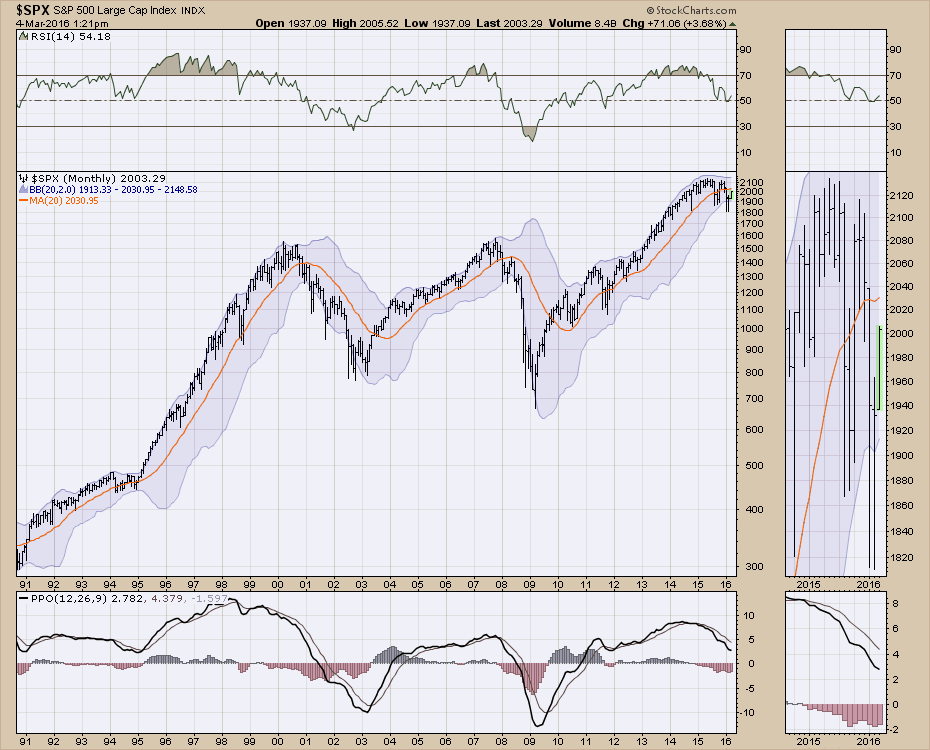
Well, it's another one of those rallies to remember. Is it a return to a new bull market? Some writers have suggested not hitting new highs for 10 months is still a bull market. I would like to use technicals to describe my version of the bull and the bear... Read More
Don't Ignore This Chart! March 03, 2016 at 07:10 AM
Tomorrow's nonfarm payrolls report is a really, really big deal. Maybe not so much from a fundamental perspective, but it certainly is from a technical perspective... Read More
Don't Ignore This Chart! March 02, 2016 at 11:45 AM
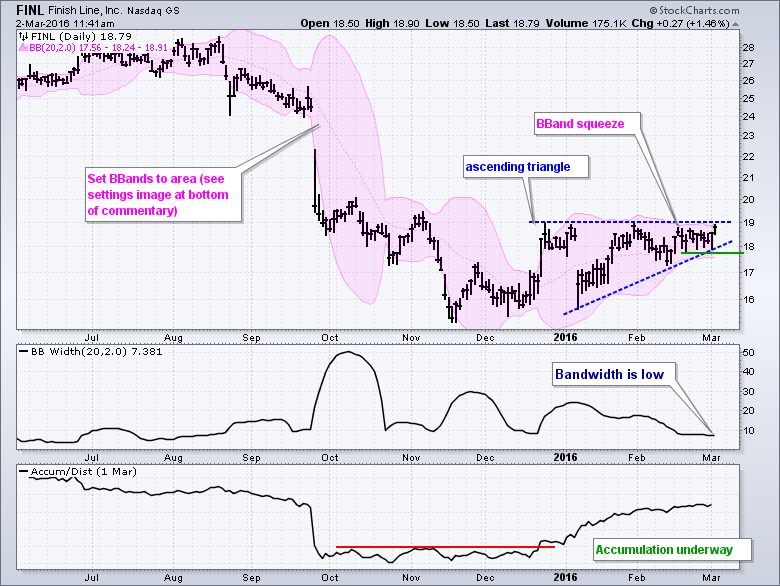
2015 was a rough year for Finish Line and the Retail SPDR (XRT) as both fell rather sharply. FINL was down over 20% and XRT fell over 8%. 2016 is shaping up a bit different because FINL is up around 2% year-to-date and XRT turned positive on Tuesday... Read More