Don't Ignore This Chart! March 31, 2017 at 02:44 PM
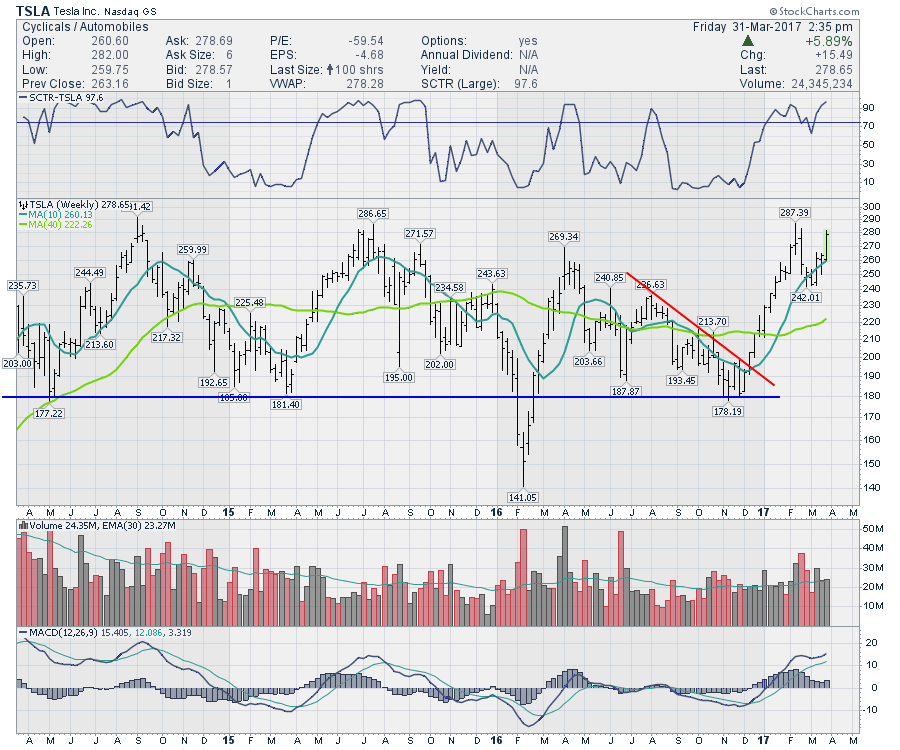
Tesla (TSLA) has been a range bound stock for years with a ton of media interest. For buy and hold investors, the last three years has been difficult. It's the rollercoaster ride that never ends. I wrote about Tesla when it was at its lows in December... Read More
Don't Ignore This Chart! March 30, 2017 at 11:47 PM
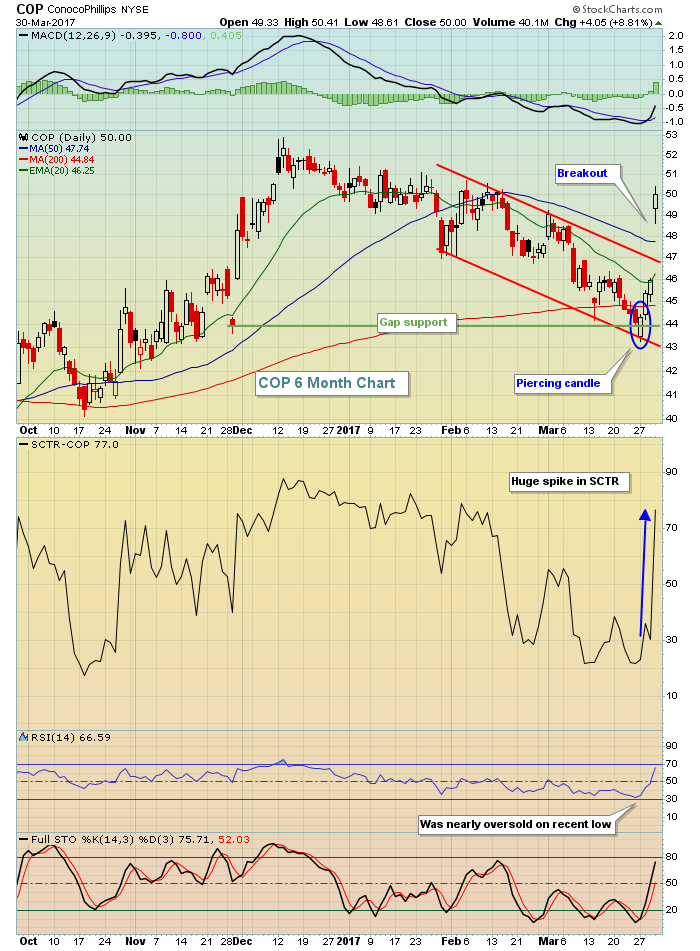
ConocoPhillips (COP) saw its SCTR soar nearly 47 points after an 8.81% increase in its stock price broke its four month downtrend. COP's strength began earlier this week on a reversing candle at gap support and culminated with today's breakout... Read More
Don't Ignore This Chart! March 29, 2017 at 06:29 AM
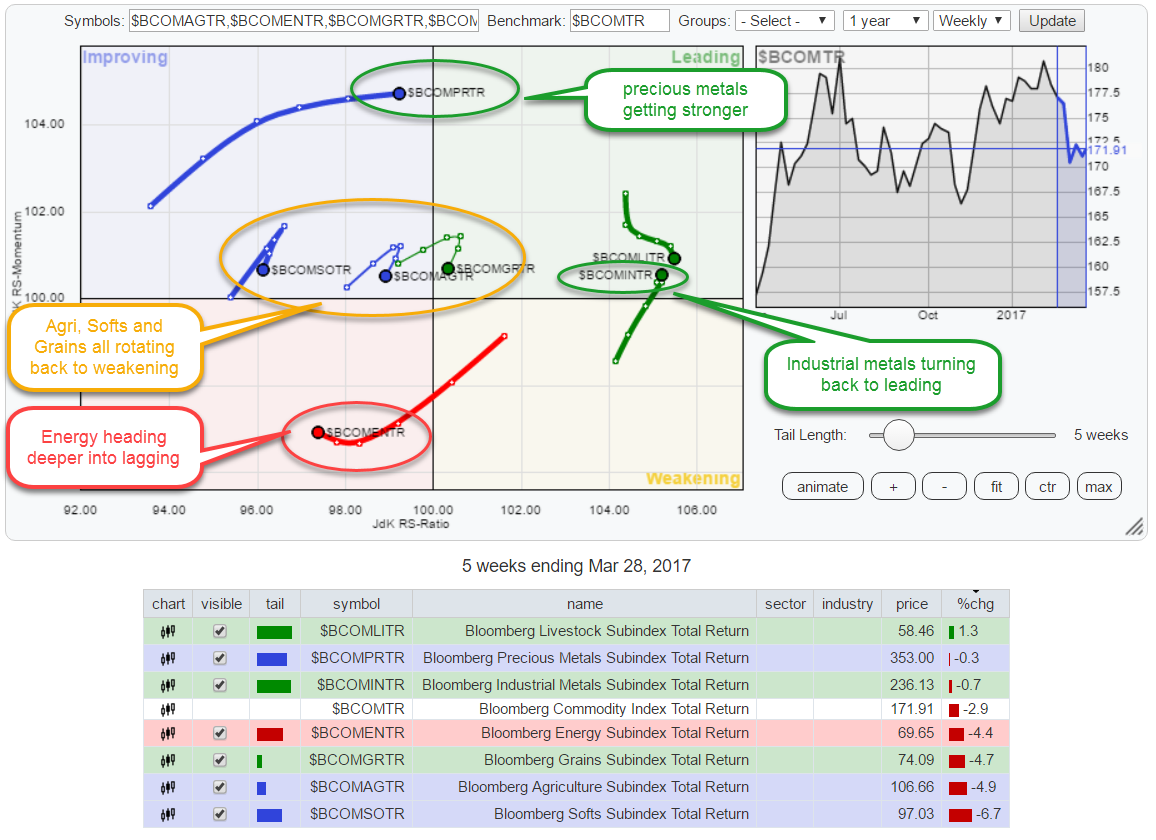
Most of the time Relative Rotation Graphs are used to visualize stock-related universes but please "Don't Ignore the fact" that RRGs can be used to visualize the rotation of any universe that holds comparable securities... Read More
Don't Ignore This Chart! March 28, 2017 at 12:23 PM
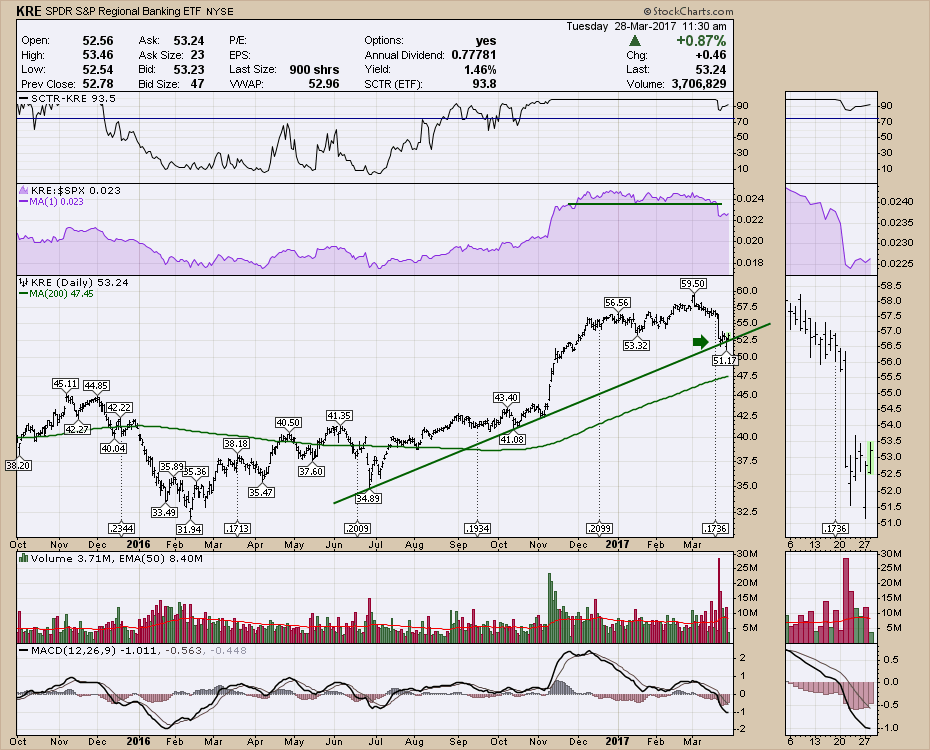
The Regional Bank ETF (KRE) is bouncing off the trend line today after testing below the trend line yesterday. This is a strategically important place on the charts for the regional banks... Read More
Don't Ignore This Chart! March 27, 2017 at 05:50 AM
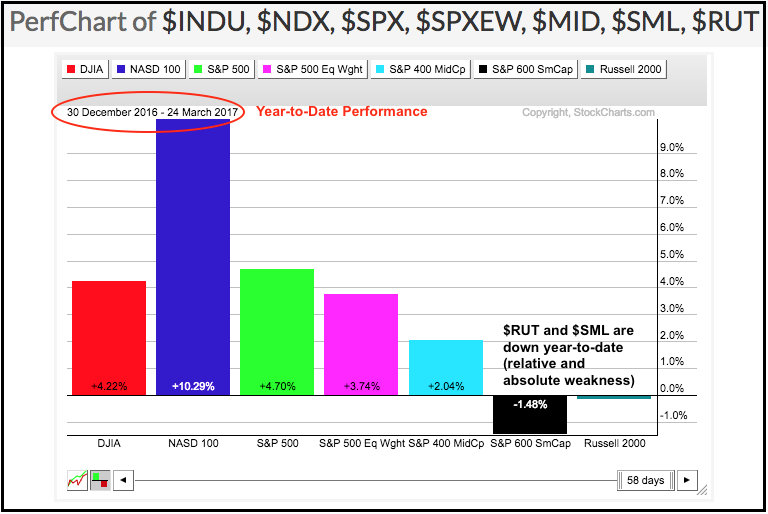
Small-caps are still leading the market since early November, but they are lagging in 2017 as year-to-date performance turned negative. The PerfChart below shows year-to-date performance for seven major stock indexes... Read More
Don't Ignore This Chart! March 26, 2017 at 10:19 PM
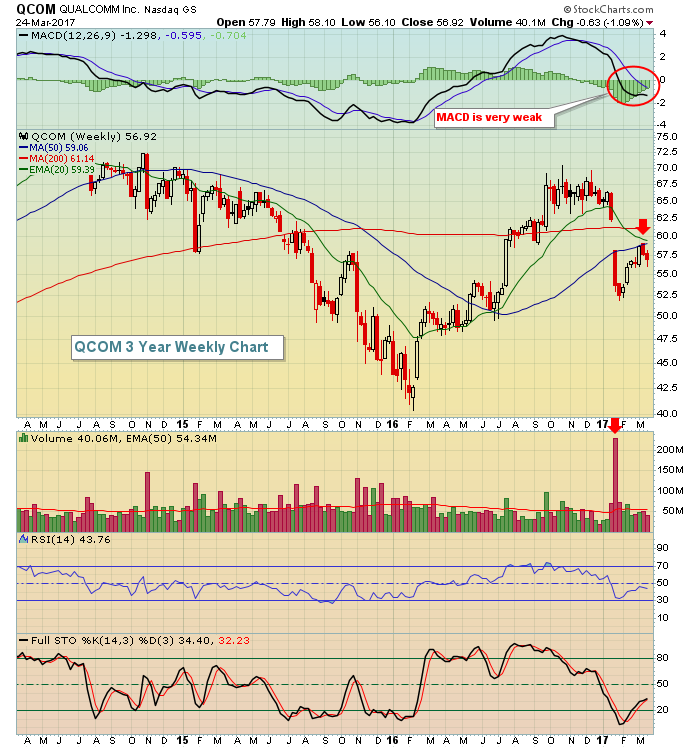
Stocks that combine poor fundamentals, technicals and seasonal weakness are probably stocks to avoid. QUALCOMM Inc. (QCOM) is one such stock as it was hit in January with multiple lawsuits and Apple's (AAPL) suit against QCOM really damaged the QCOM chart technically... Read More
Don't Ignore This Chart! March 24, 2017 at 01:40 PM
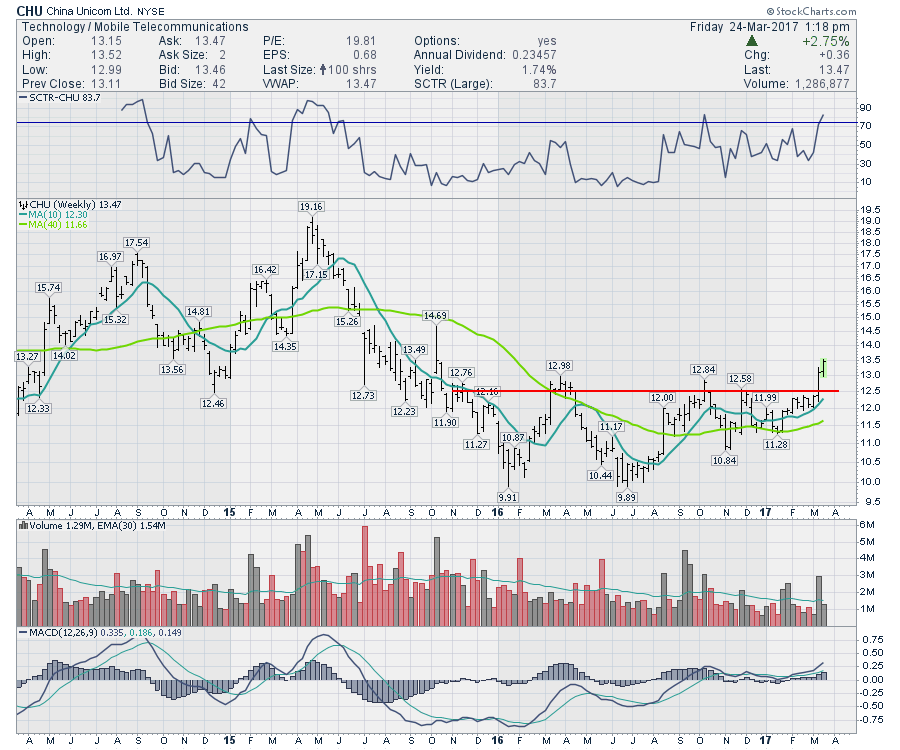
China Unicom (CHU) is a huge telecommunications company as it ranks 4th in the world for subscribers. This week it extended a breakout and pushed up to fresh new highs. The SCTR is at it's highest level in 2 years and is above 75, which I think is a big positive... Read More
Don't Ignore This Chart! March 23, 2017 at 07:37 PM
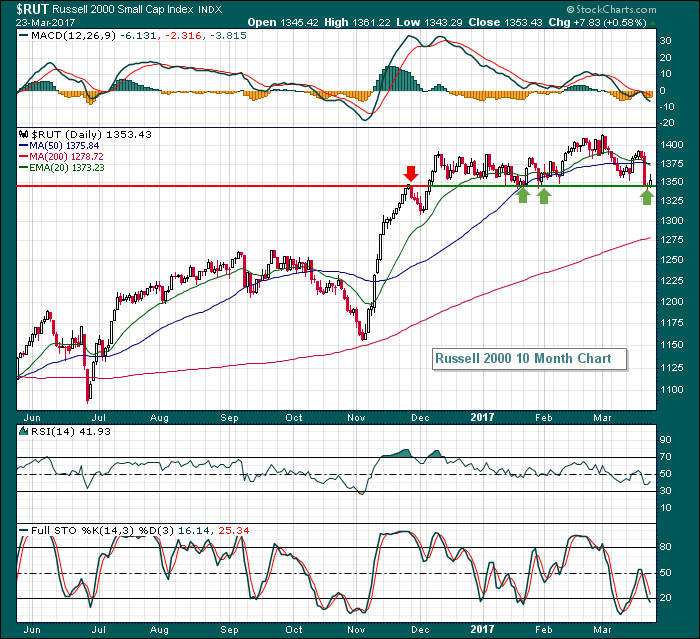
The Russell 2000 has been under selling pressure but is now testing key support on both its daily and weekly charts. There is a slight negative divergence that's present on its weekly chart, so that would be a signal of possible weakness ahead... Read More
Don't Ignore This Chart! March 22, 2017 at 12:34 PM
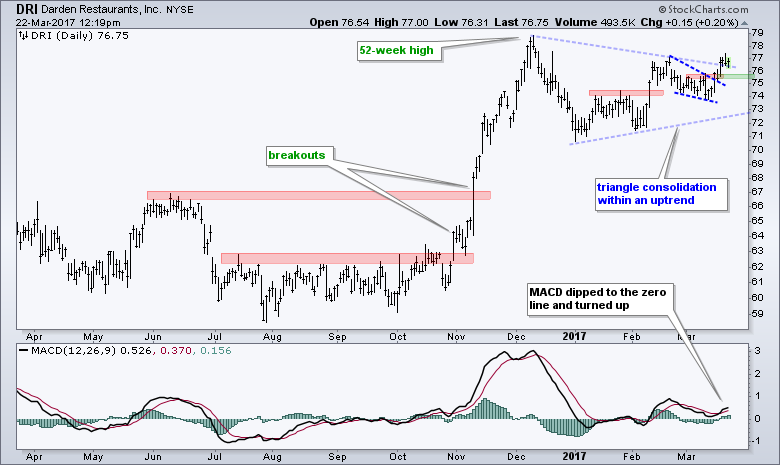
Stocks got hammered on Tuesday with the S&P 500 falling the most this year (1.24%) and breaking below its March low. Even with the seemingly big decline, the index is still just 2.25% from an all time high... Read More
Don't Ignore This Chart! March 22, 2017 at 11:10 AM
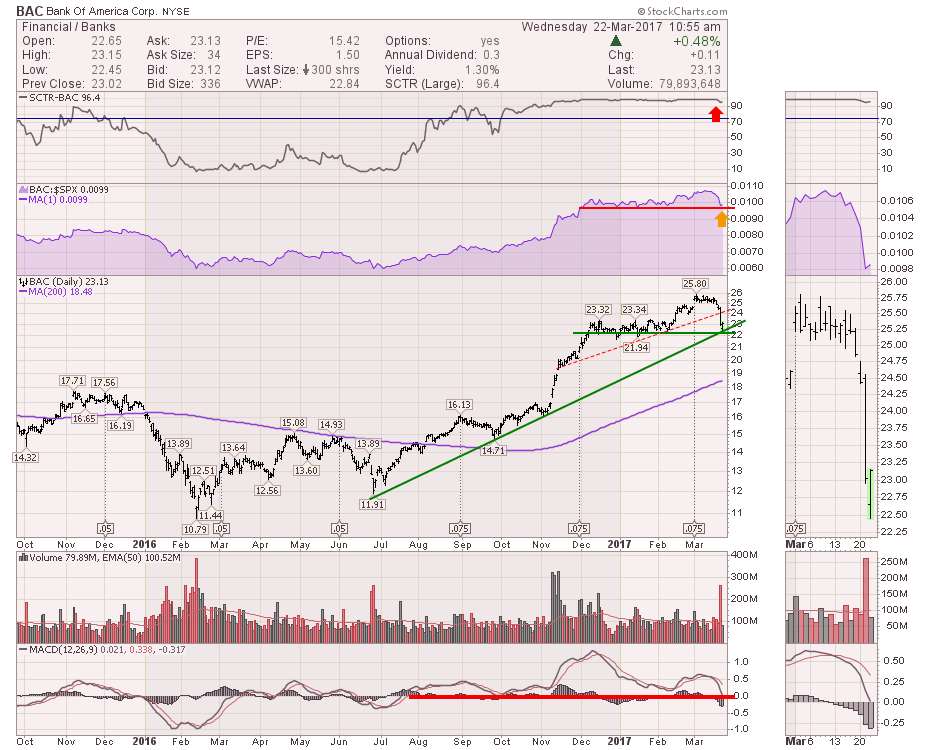
Bank Of America has been a top performing stock for the last 9 months. It has continually worked its way higher. Tuesday's price action marked a significant reversal as the stock is now testing horizontal support for the last three months... Read More
Don't Ignore This Chart! March 20, 2017 at 01:22 PM
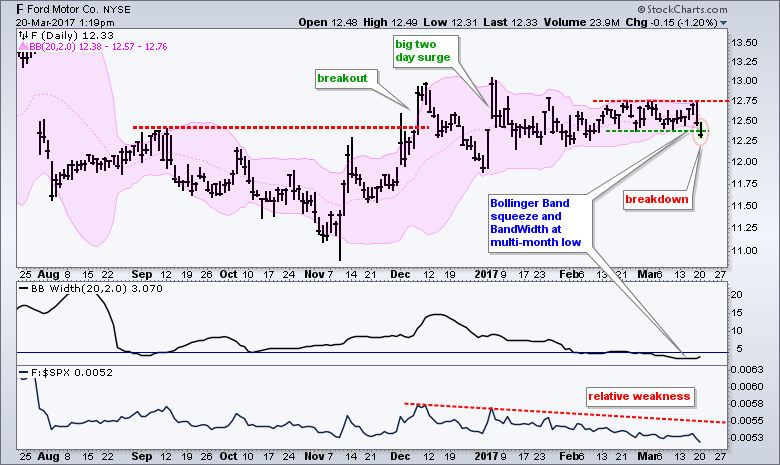
Ford (F) looked as if it was simply consolidating after a sharp surge and breakout, but this consolidation strung out and the stock broke to the downside on Monday. The chart shows Ford breaking above the September high with a surge in November-December... Read More
Don't Ignore This Chart! March 17, 2017 at 11:44 AM
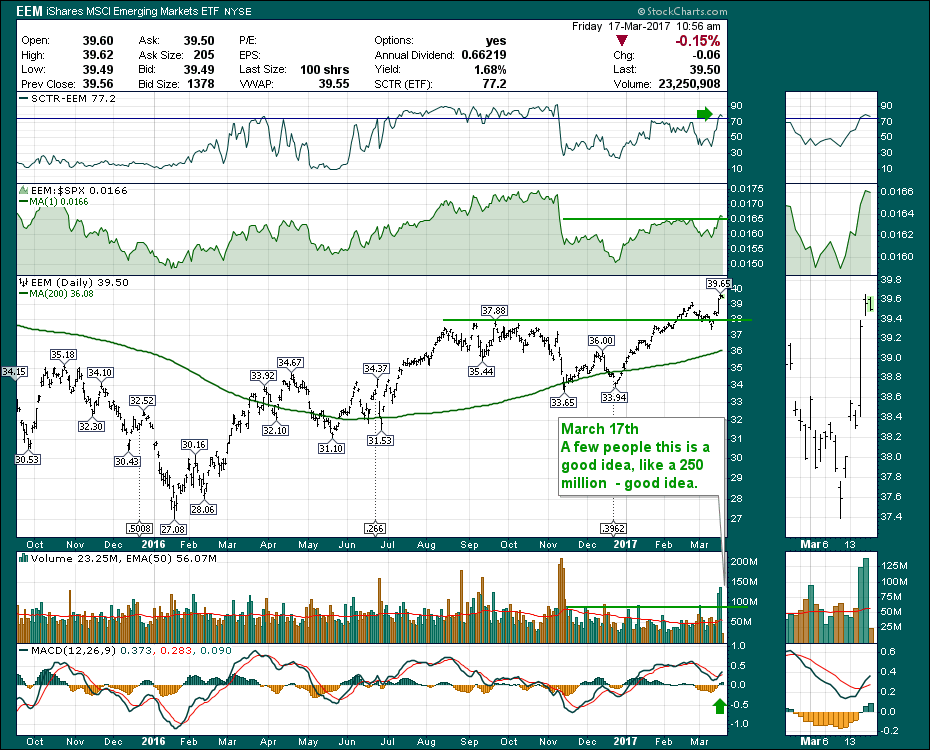
I know it was Fed day Wednesday, and Quadruple Witching Options Expiration Day today. I know it's St. Patrick's Day and they'll be partying around the world with green beers and Shamrocks. So in the world of StockCharts, we need to get on the St... Read More
Don't Ignore This Chart! March 16, 2017 at 01:15 PM

Oracle Corp (ORCL) needed a solid earnings report last night after the closing bell to reach all-time highs and it delivered exactly that. ORCL posted both top line and bottom line (.63 vs ... Read More
Don't Ignore This Chart! March 15, 2017 at 12:22 PM
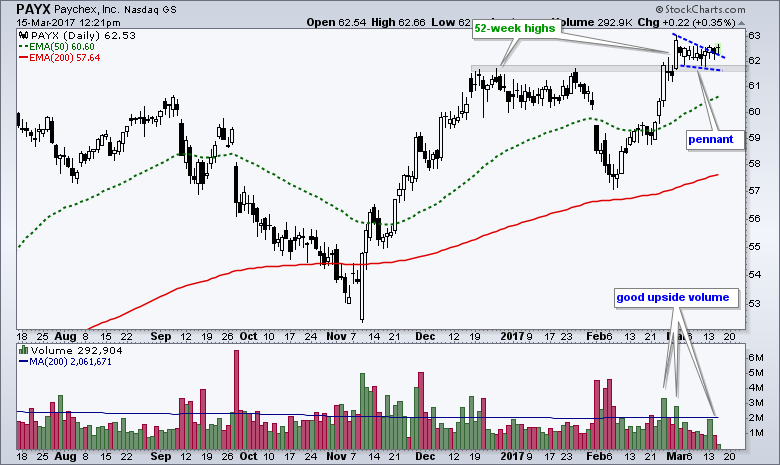
Flags and pennants are continuation patterns, which means their bias depends on the direction of the prior move. A flag or pennant after a surge is a bullish continuation pattern that represents a rest within the uptrend... Read More
Don't Ignore This Chart! March 14, 2017 at 09:07 PM
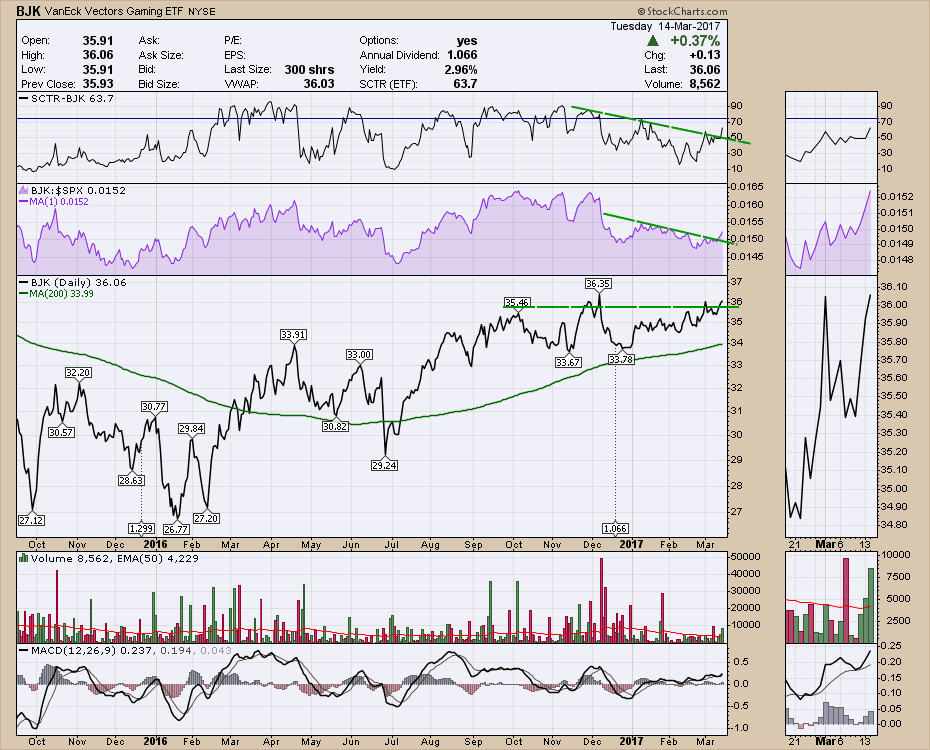
Gaming ETF (BJK) has been consolidating for a while. Today, while the market was under pressure, BJK pushed higher and looks set to hit new highs. It has had one close slightly higher than todays levels back in December 2016... Read More
Don't Ignore This Chart! March 13, 2017 at 01:12 PM
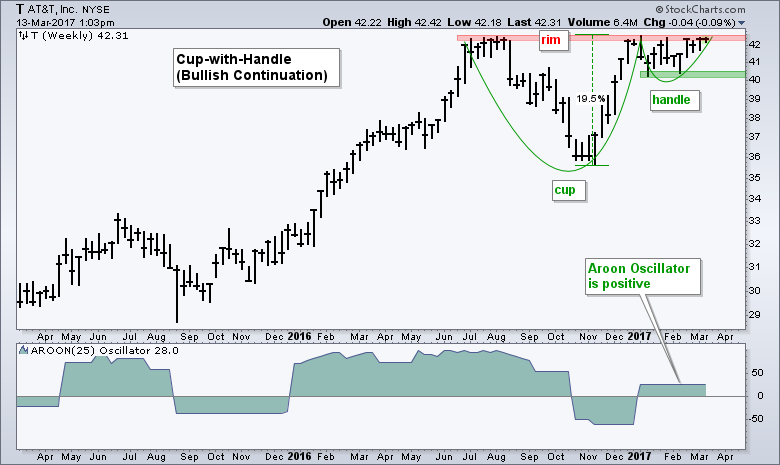
The cup-with-handle is a bullish continuation pattern that forms as part of a bigger uptrend. There are three parts to this pattern. First, a cup forms as prices correct and rebound to form a "V" or "U" shape... Read More
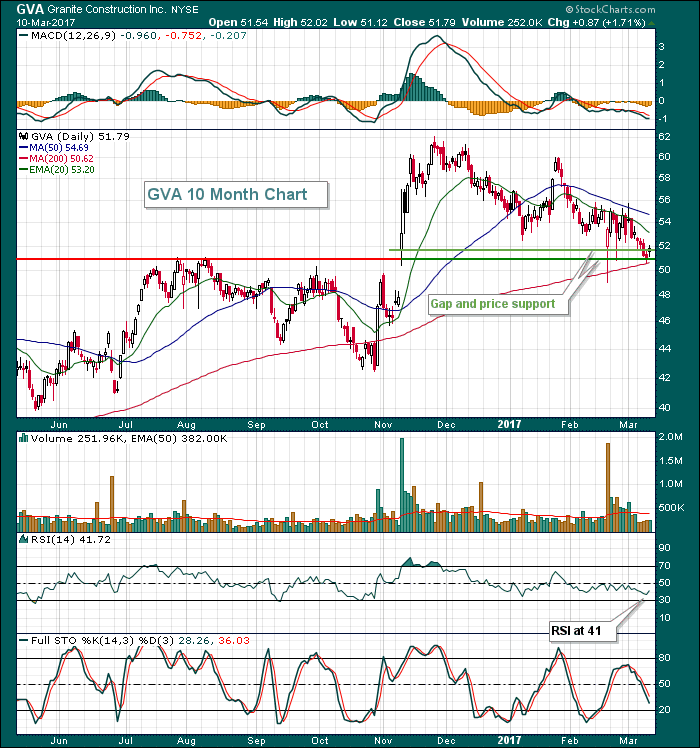
Don't Ignore This Chart! March 12, 2017 at 09:53 PM
The Dow Jones U.S. Heavy Construction Index ($DJUSHV) is currently testing its rising 20 week EMA and is near key support in its four month sideways consolidation range from 440-480... Read More
Don't Ignore This Chart! March 10, 2017 at 02:10 PM
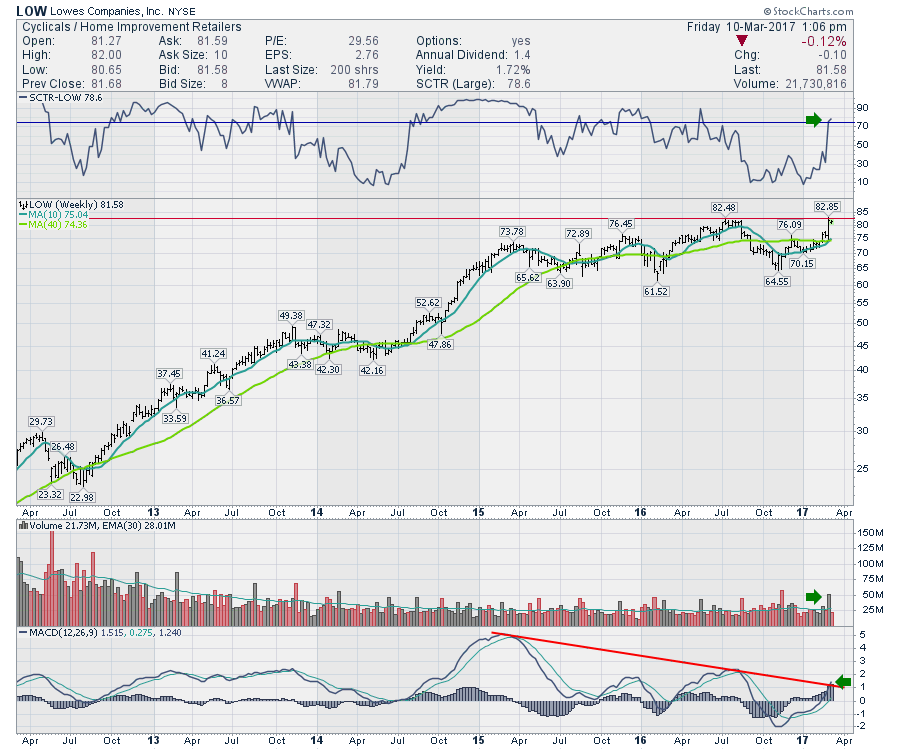
Last week, Lowes (LOW) gapped up and touched a fresh high above the 2016 highs. This week it has consolidated in a range but is holding up nicely as the markets wobbled. The 50 Million shares of volume for the week was the highest positive week candle in 3 years... Read More
Don't Ignore This Chart! March 08, 2017 at 09:36 AM
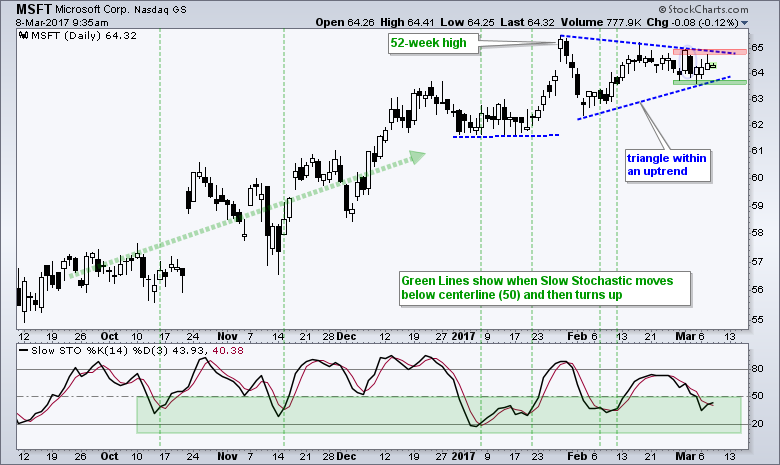
It always piques my interest when a stock bucks the broader market. Note that SPY and QQQ closed lower the last two days and Microsoft (MSFT) closed higher... Read More
Don't Ignore This Chart! March 07, 2017 at 11:04 PM
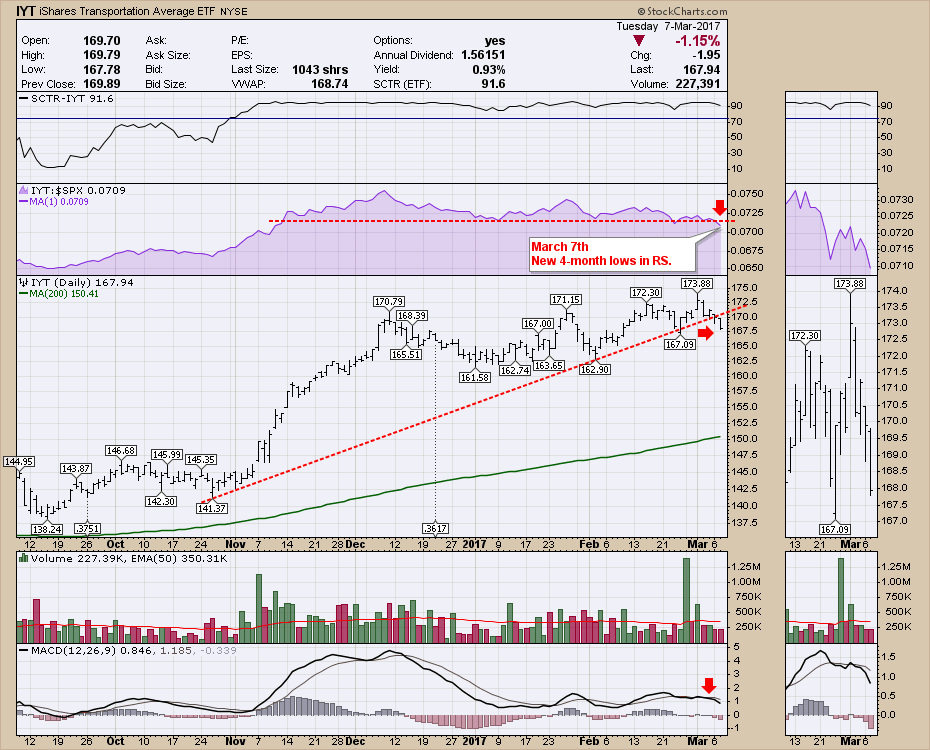
The Transports (IYT) made a subtle break in the Post - Election uptrend today. A couple of things show up here. The SPX Relative Strength is at 4-month lows today. The price has not made much progress since the December 8th high in the energy stocks... Read More
Don't Ignore This Chart! March 06, 2017 at 10:20 AM
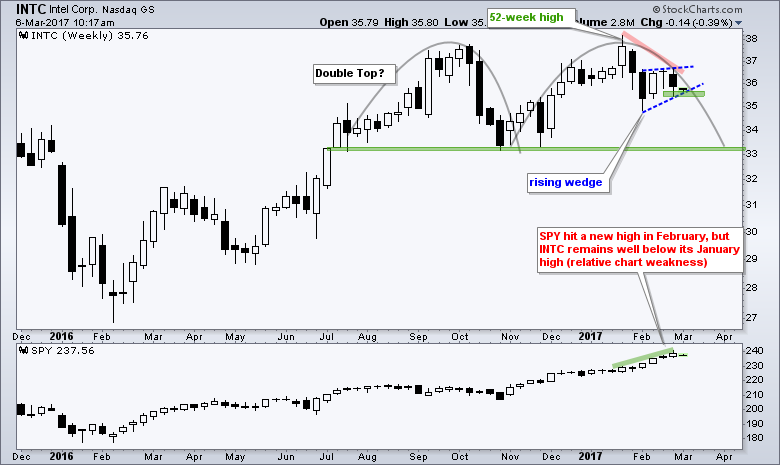
Intel is not keeping pace with the broader market and chartists should watch the bearish wedge for signs of further weakness. There are two patterns at work on the price chart... Read More
Don't Ignore This Chart! March 03, 2017 at 10:04 AM
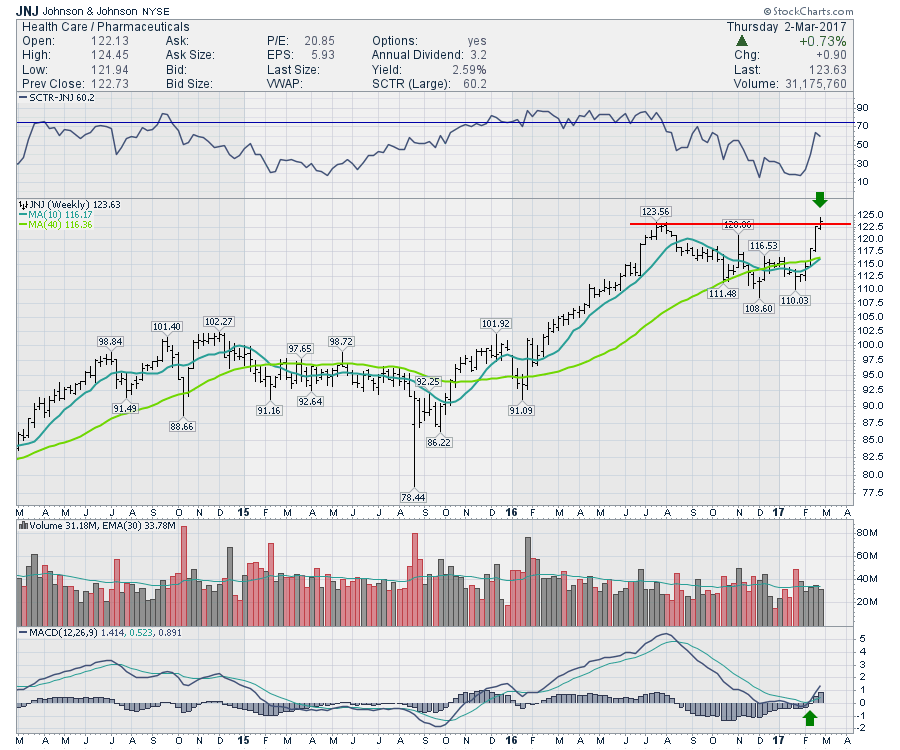
JNJ pushed above and closed at a new all time high so far this week. WIth the market under some selling pressure on Thursday, JNJ still closed above previous All Time Highs... Read More
Don't Ignore This Chart! March 02, 2017 at 02:53 PM
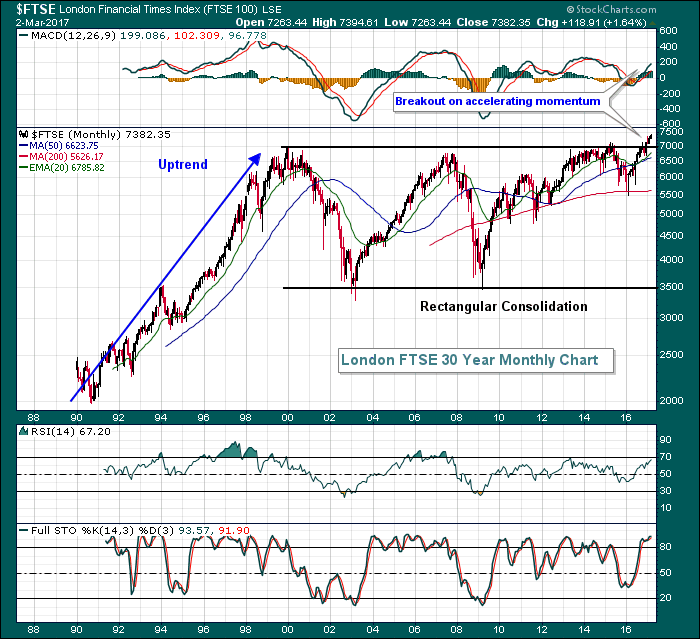
The London Financial Times Index ($FTSE) had sideways consolidated for 17 years after topping back in 2000. That consolidation period has ended in a big way in 2017 and this index appears poised for a very significant rise... Read More
Don't Ignore This Chart! March 01, 2017 at 12:16 PM
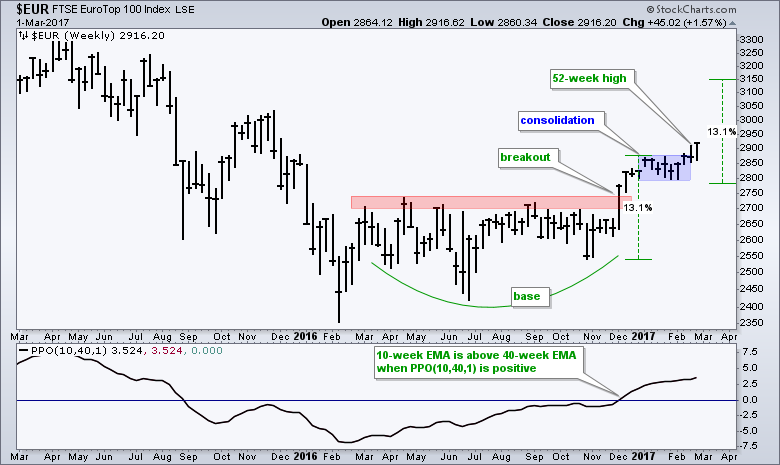
The EuroTop 100 ($EUR) has further room to run after breaking out of a bullish continuation pattern. The price chart shows the index basing from March until November and then breaking above a major resistance zone in early December. After a 13... Read More