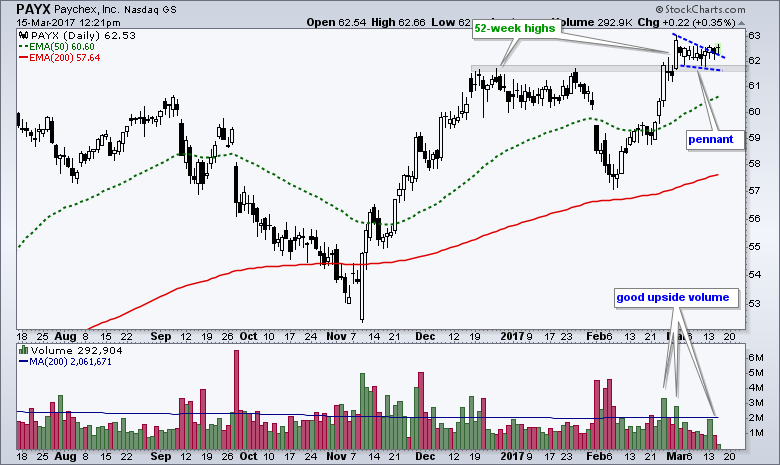
Flags and pennants are continuation patterns, which means their bias depends on the direction of the prior move. A flag or pennant after a surge is a bullish continuation pattern that represents a rest within the uptrend. An upside break signals an end to this consolidation and a resumption of the bigger uptrend. These are short-term patterns for more aggressive traders. The chart below shows Paychex with a classic high-and-tight pennant. Notice that the stock hit 52-week highs in December and March, and the 50-day EMA is above the 200-day EMA. The surge from ~57.5 to ~63 (~9%) created a short-term overbought situation and the stock worked this off with a trading range. PAYX recently broke pennant resistance and it looks like the uptrend is set to continue. A break below the pennant low would call for a re-evaluation.
****************************************
Thanks for tuning in and have a great day!
--Arthur Hill CMT
Plan your Trade and Trade your Plan
*****************************************