The Utilities SPDR (XLU) surged as the S&P 500 fell below its 50-day SMA on Wednesday. Overall, notice that the 50-day EMA crossed the 200-day EMA in mid December and the ETF hit a 52-week high in late March. XLU is the strongest of the nine sectors since November 30th (+12.84%) and it is even up more than XLK (+11.61%). On the price chart, it looks like XLU is breaking out of a pennant formation. The March-April lows are used to set support in the 50-50.50 area.
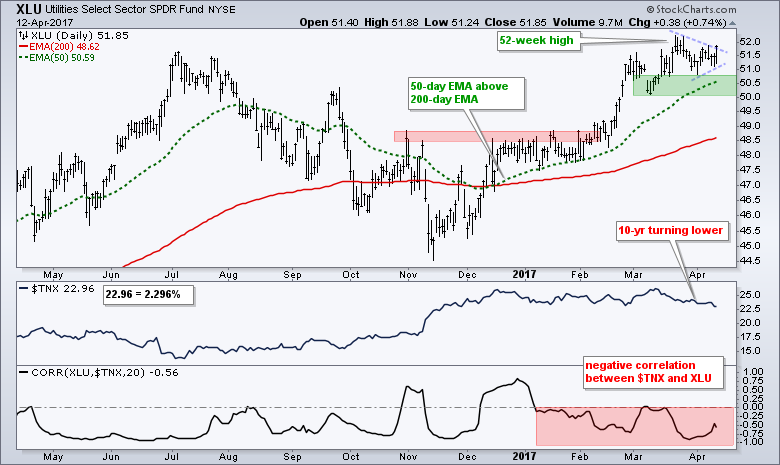 Chartists looking for a reason can point to the 10-yr T-Yield ($TNX), which dipped below 2.3% for the first time this year. The indicator window shows the Correlation Coefficient ($TNX, XLU) in negative territory since the early part of January. This means they move in opposite directions. Expect utilities to continue higher as long as the 10-yr yield moves lower.
****************************************
Thanks for tuning in and have a great day!
--Arthur Hill CMT
Plan your Trade and Trade your Plan
*****************************************