The Swiss Franc ($XSF) made a meaningful break of the downtrend this week. The correlation of the Swissie to other asset classes is worth noting.
Reviewing some of the history on the chart, 2011 shows the Swiss Franc at the summit of a Matterhorn peak with major momentum going in. But the sudden plummet soon after aligned closely with a meaningful top and plummet in Gold. Interesting enough, the Yen in the lower panel would need another couple of months to top out and roll over.
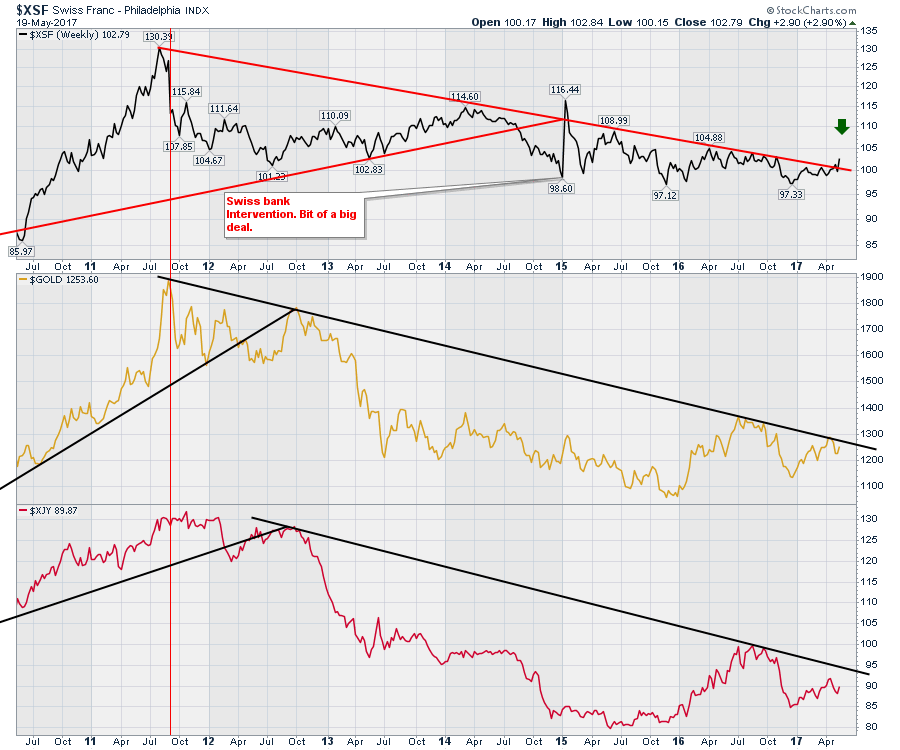
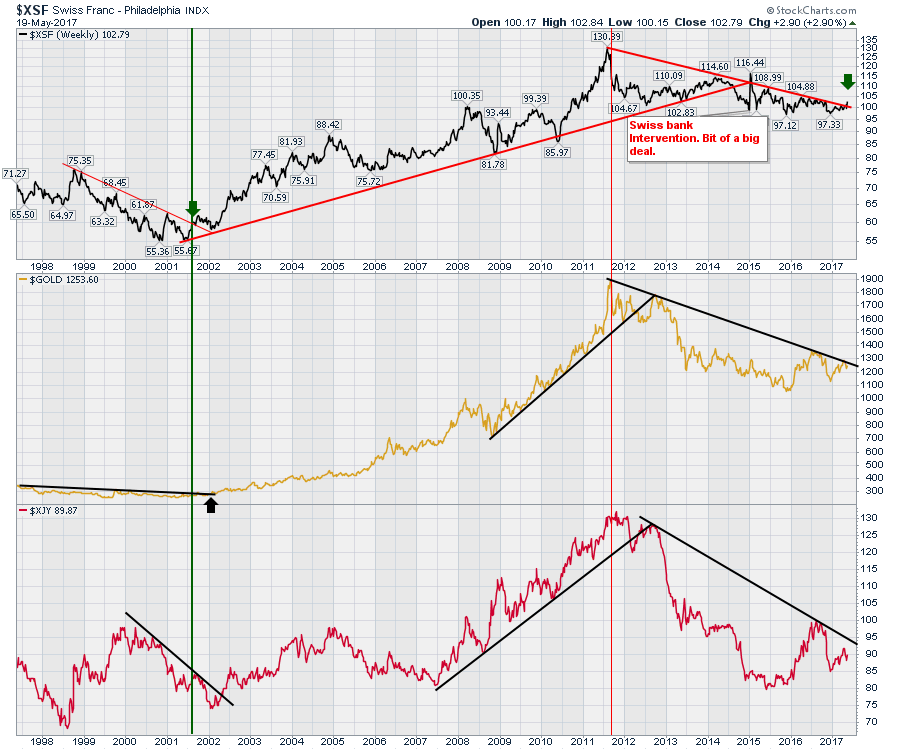
If this break in the Swiss Franc is worth noting, we should start to see other asset classes affected. When I look farther back on the chart, there is some interesting data there as well.
You may remember the big bull run in Commodities that started back in the early 2000's. It also matched up quite nicely with $GOLD and the Yen then.
 This trend line break on the Swiss France looks meaningful and should not be ignored. Keep watching to see if its a false breakout by clicking on these charts to see live updates over the coming weeks. If the same setup plays out, you'll want to be watching Gold Miners intently.
If you missed the Commodities Countdown recording for this week, you can find all of the market review videos on my Vimeo Channel. Feel free to hit the follow button on the right.
Good trading,
Greg Schnell, CMT, MFTA.
