British Petroleum (BP) has been wobbling higher while oil has had a series of lower highs over the course of 2017. This week, BP has pushed to new two year highs.
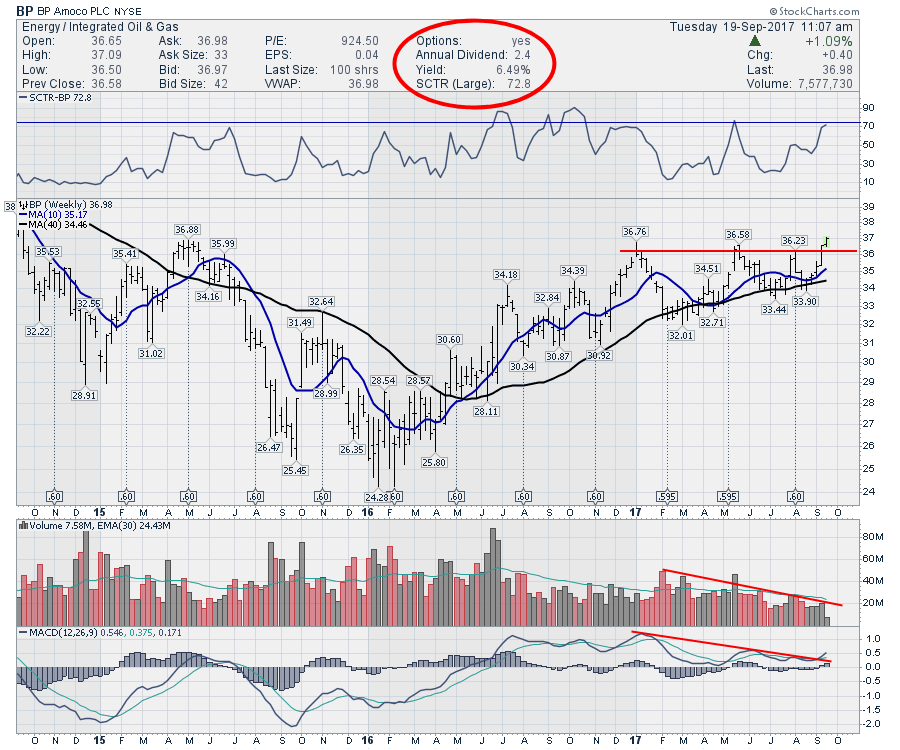
With an astounding dividend yield of 6% and superb price action on the stock, this chart looks great. The MACD is breaking out above a trend line and volume has slowed while the ascending triangle builds.
Check out a host of new videos posted this past week on the StockCharts.com Vimeo channel.
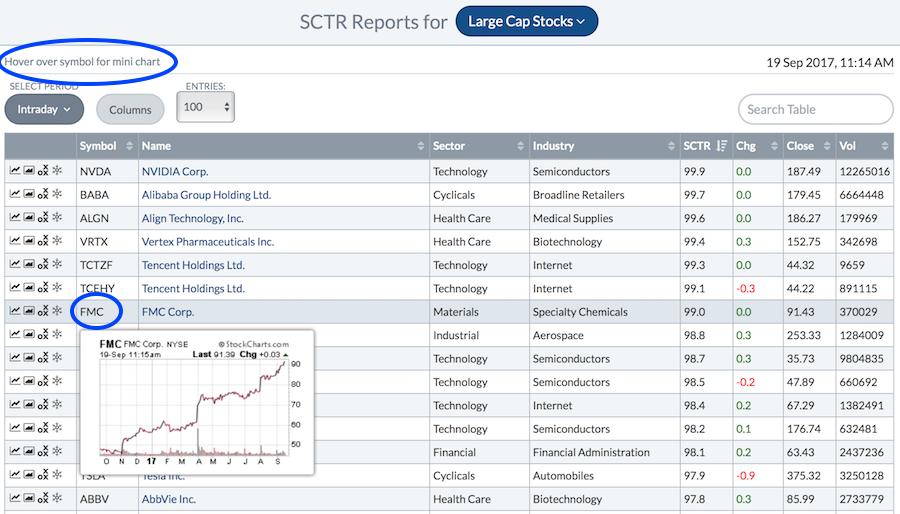
Check out the new mini charts when you hover over a stock ticker symbol on the Summary page in your chartlist as well as the SCTR ranking page! Woot Woot...This is nice!
 Good trading,
Greg Schnell, CMT, MFTA

About the author:
Greg Schnell, CMT, MFTA is Chief Technical Analyst at Osprey Strategic specializing in intermarket and commodities analysis. He is also the co-author of Stock Charts For Dummies (Wiley, 2018). Based in Calgary, Greg is a board member of the Canadian Society of Technical Analysts (CSTA) and the chairman of the CSTA Calgary chapter. He is an active member of both the CMT Association and the International Federation of Technical Analysts (IFTA).
Learn More