Don't Ignore This Chart! January 31, 2018 at 11:52 AM

The chart for CBS Corp (CBS) is already bad news and the news could get even worse. First and foremost, the long-term trend is clearly down as the stock hit a 52-week low in early November and remains below the falling 200-day SMA... Read More
Don't Ignore This Chart! January 29, 2018 at 11:08 AM

Norwegian Cruise Line (NCLH) broke out of a long consolidation and looks poised to hit new highs soon. The long-term trend is up as the stock surged to new highs with a 50+ percent advance from November 2016 to August 2017... Read More
Don't Ignore This Chart! January 27, 2018 at 10:54 AM
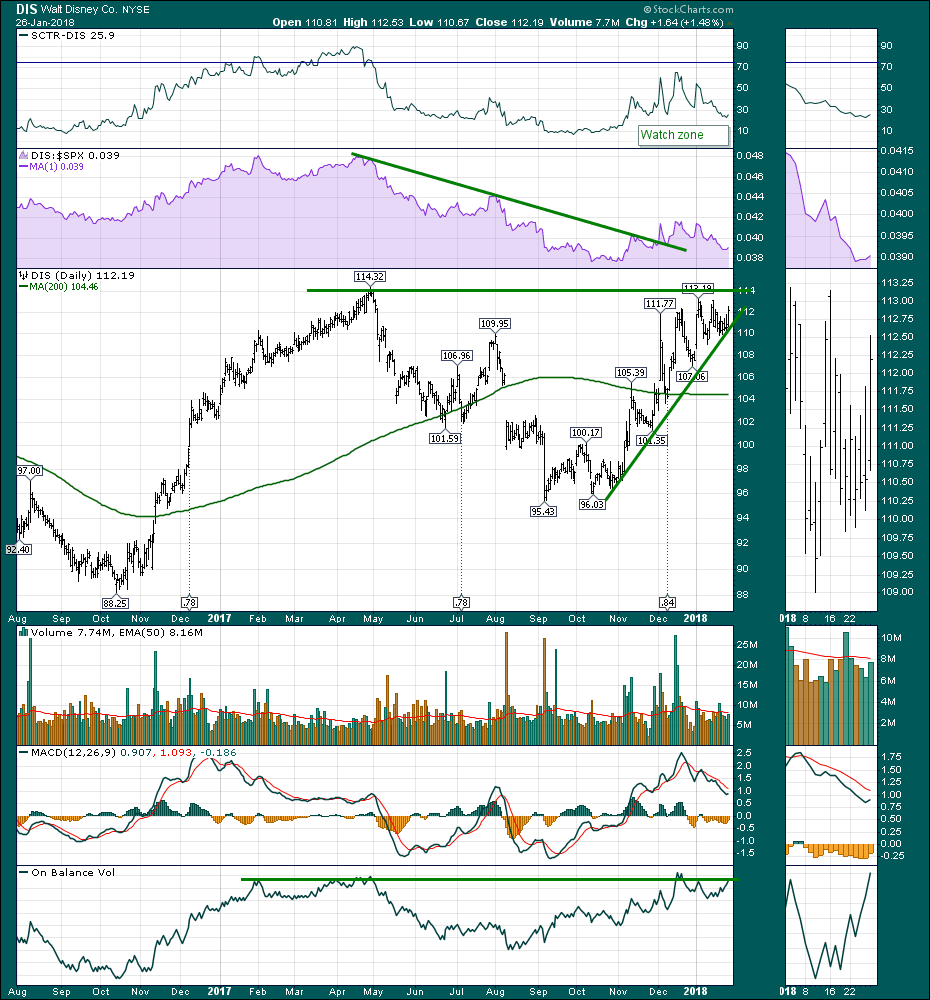
As Disney (DIS) approaches meaningful resistance, it is a good time to evaluate if the run in Disney looks in trouble here... Read More
Don't Ignore This Chart! January 25, 2018 at 08:44 PM
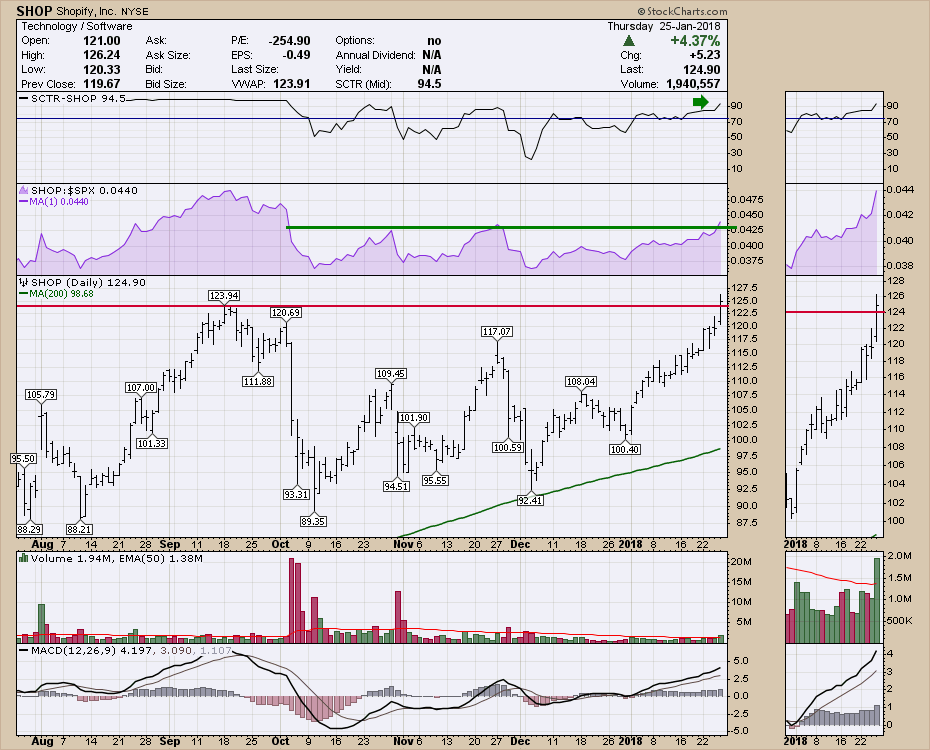
Shopify (SHOP) made new 52 week highs today in the mid-cap area of the market. This is a company that owns software to build websites for selling merchandise through. In early 2017 it made a tremendous move higher and levelled off for 6 months... Read More
Don't Ignore This Chart! January 24, 2018 at 10:15 AM
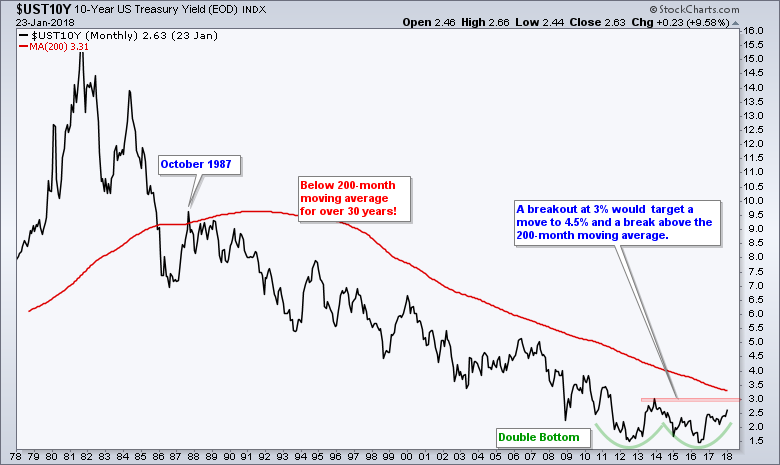
The 10-year Treasury Yield peaked near 16% in 1982 and fell as a secular bear market took hold for over 30 years. After stabilizing the last few years, the 10-year Yield traced out a large bullish reversal pattern and confirmation would end the secular bear market... Read More
Don't Ignore This Chart! January 23, 2018 at 11:37 PM
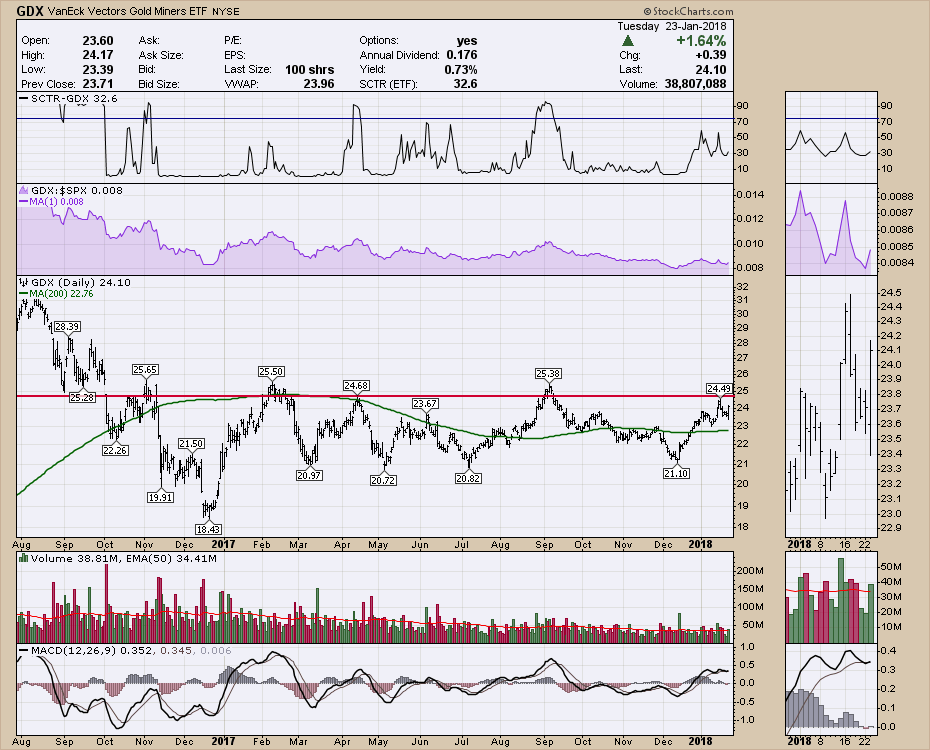
The Gold Miners ETF (GDX) is at a critical level. This sets up for an important test to break out or fail in the next few weeks. Today, the GDX ETF surged after opening lower. Looking at the chart demonstrates why the next move is so important... Read More
Don't Ignore This Chart! January 22, 2018 at 11:59 AM
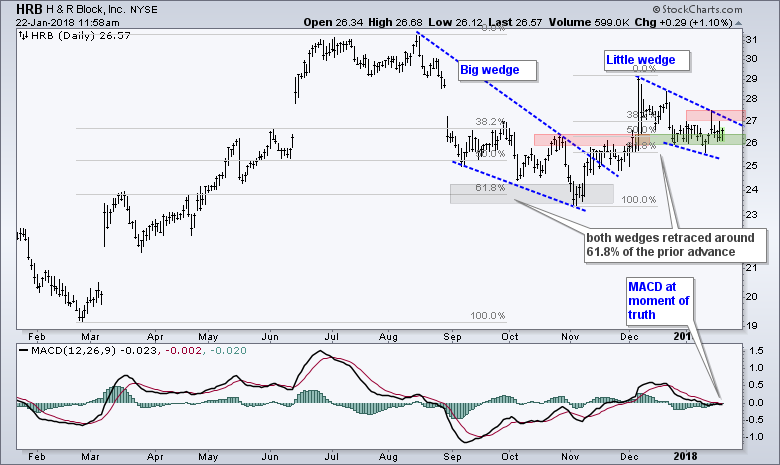
The chart for H&R Block (HRB) shows two corrective patterns, one confirmed and one working. First, HRB retraced around 61.8% of the February-August advance and formed A big wedge. The wedge pattern and the retracement amount are typical for corrections after a sharp advance... Read More
Don't Ignore This Chart! January 18, 2018 at 06:55 PM
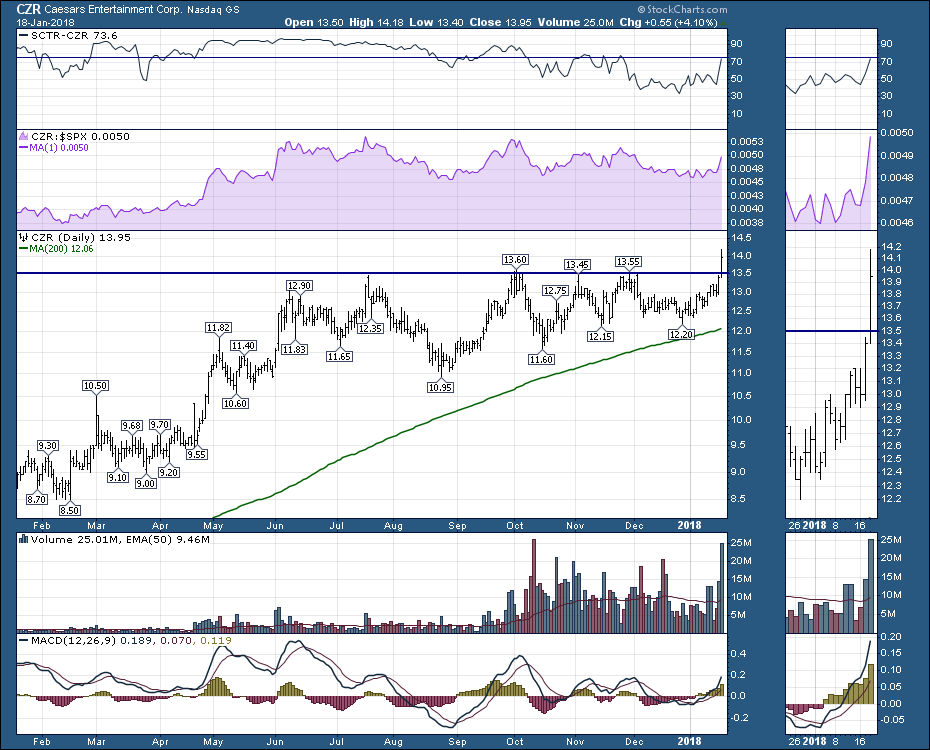
Caesars Entertainment (CZR) made a beautiful breakout on high volume Thursday. It has continually tested this $13.50 level since July 2017. Today, the chips were all placed on Caesar's side of the table. The volume surged to 25 million shares... Read More
Don't Ignore This Chart! January 17, 2018 at 01:53 PM
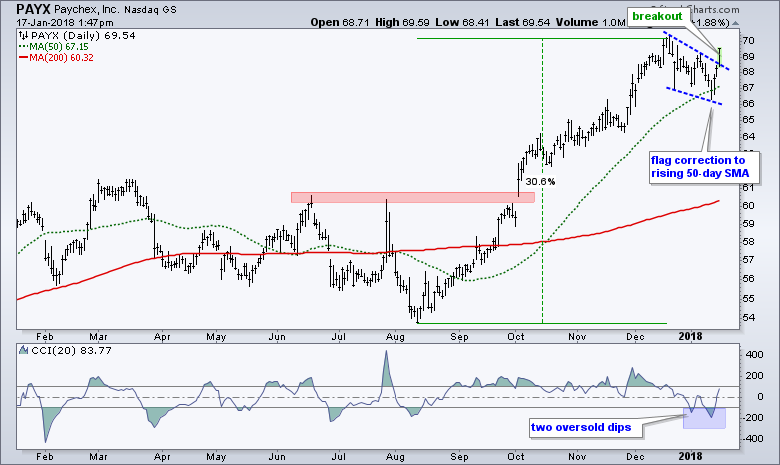
PayChex (PAYX), which has nothing to do with Chex cereal, ended its correction with a three-day surge and wedge breakout. First and foremost, the long-term trend is up as the stock broke out in early October and hit a 52-week high in December... Read More
Don't Ignore This Chart! January 17, 2018 at 01:11 AM
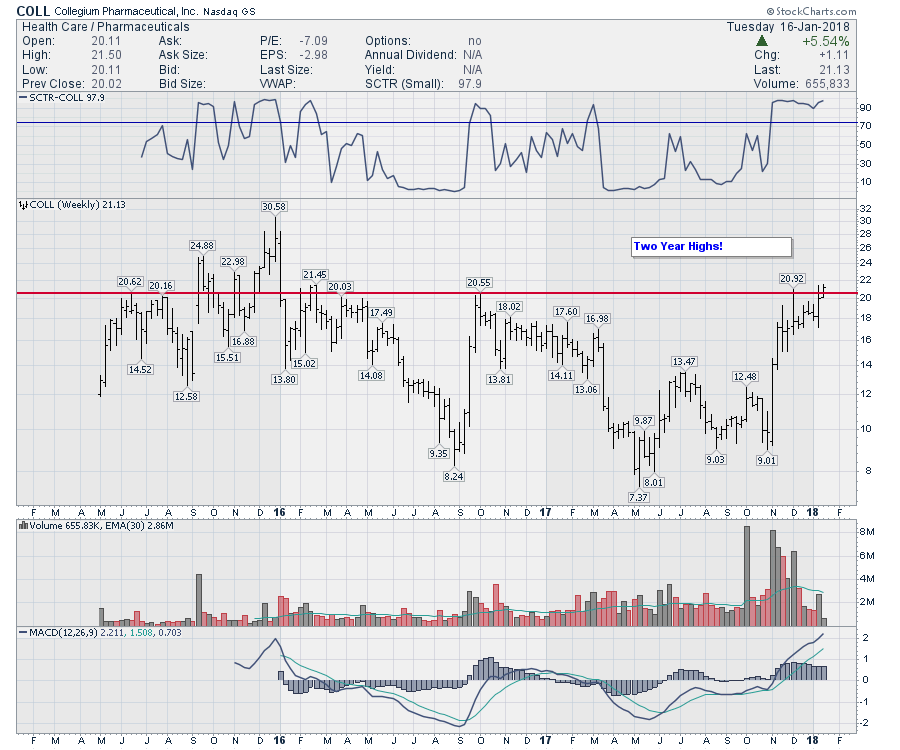
Collegium Pharma (COLL) is pressing two year highs after IPO'ing three years ago. The stock has built a nice base and looks like it is ready to turn higher. While this stock has come a long way since November, the current level suggests a major change in trend for the stock... Read More
Don't Ignore This Chart! January 12, 2018 at 11:10 AM
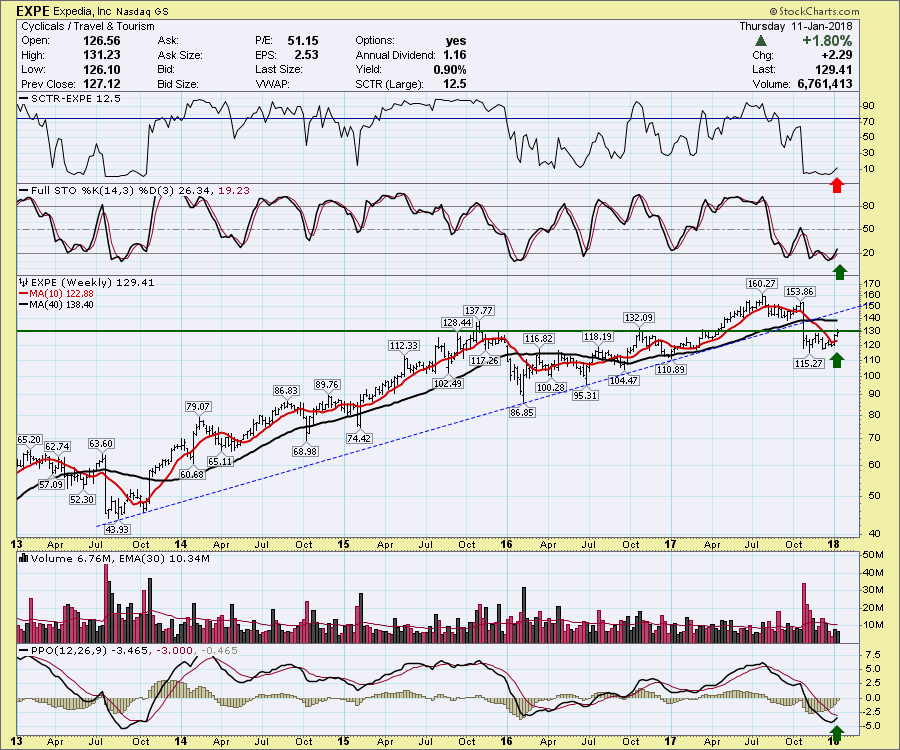
Expedia is at a huge point of reckoning here. Will this be a perfect opportunity or bad weather ahead? First of all, this $130 level was huge resistance before. When Expedia broke through, it soared to the upside. Recently, the stock had a terrible week losing 20%... Read More
Don't Ignore This Chart! January 12, 2018 at 09:10 AM
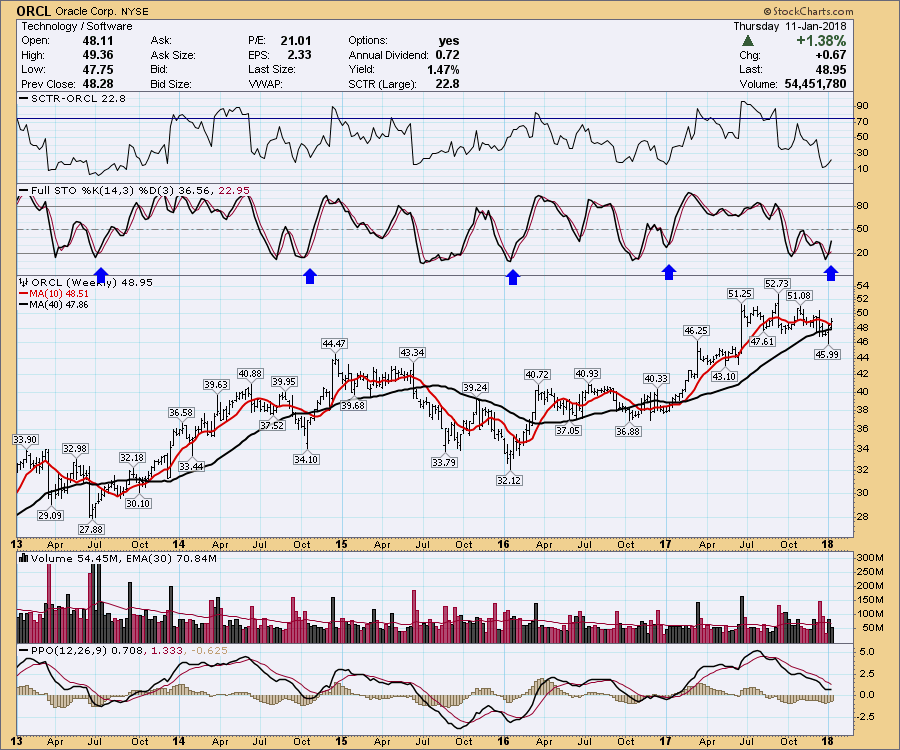
Oracle stock (ORCL) has been languishing lately, but the stock showed up this week on one of my weekly scans. When I started to look more deeply, I noticed that signals on the Full Stochastics panel usually need to double bounce or double dribble... Read More
Don't Ignore This Chart! January 10, 2018 at 12:10 PM
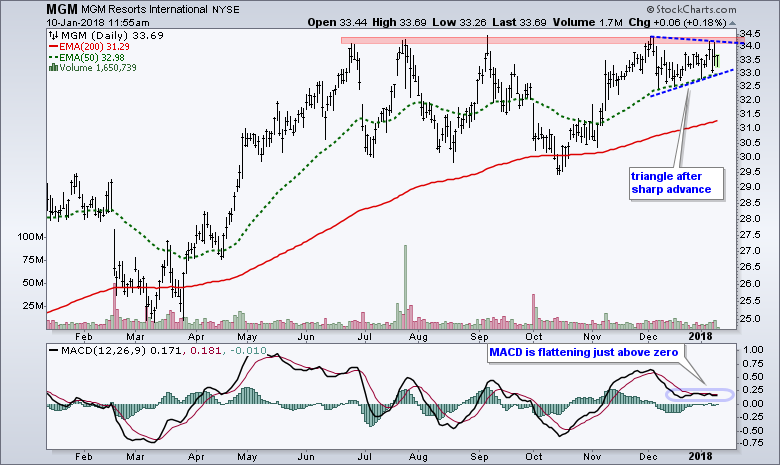
MGM Resorts (MGM) is gearing up for a resistance challenge and the speculator in me expects a breakout. First and foremost, MGM is in a long-term uptrend with the September 7th spike marking a 52-week high... Read More
Don't Ignore This Chart! January 09, 2018 at 05:36 PM
As the market absorbs the early days of 2018, there is a huge movement underlying the market. The bonds are breaking down, the $USD has completed a base and is starting to rise, and commodities like Gold and Silver are starting to soften... Read More
Don't Ignore This Chart! January 08, 2018 at 11:37 AM
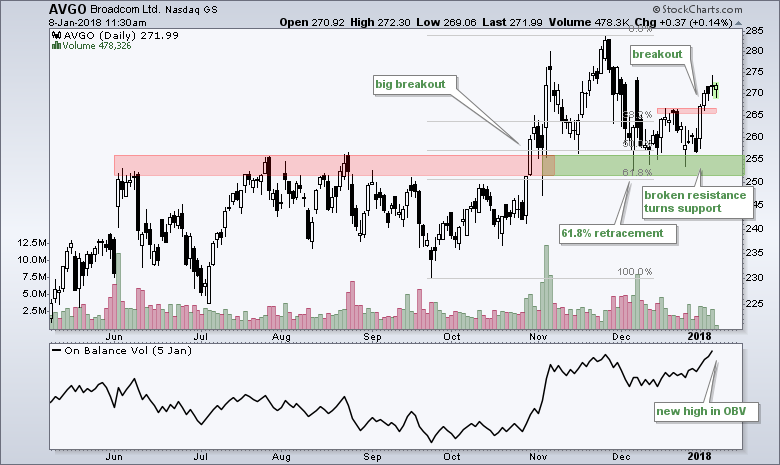
Broadcom (AVGO) fell on hards time in December with a decline to the breakout zone, but this zone ultimately held and it looks like the uptrend is ready to resume... Read More
Don't Ignore This Chart! January 06, 2018 at 09:36 AM
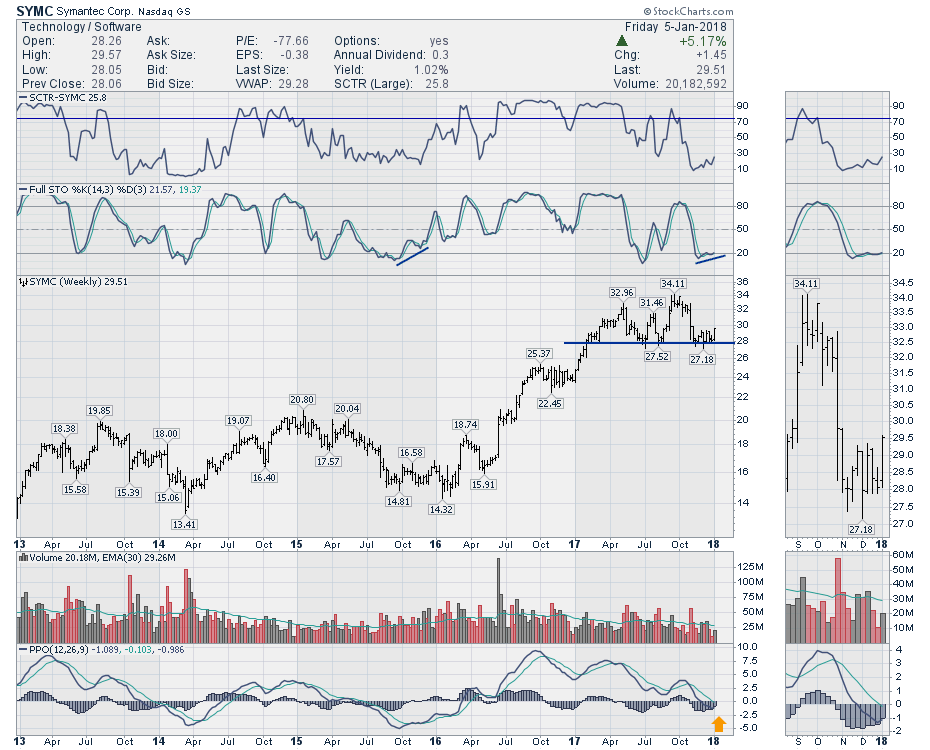
Symantec (SYMC) spent 18 months rising off the lows of 2016. But since February of 2017, it has continually tested, found support at and held $28.00. This week the stock pushed off that level one more time. There are good reasons to look at a trade here... Read More
Don't Ignore This Chart! January 04, 2018 at 02:57 PM
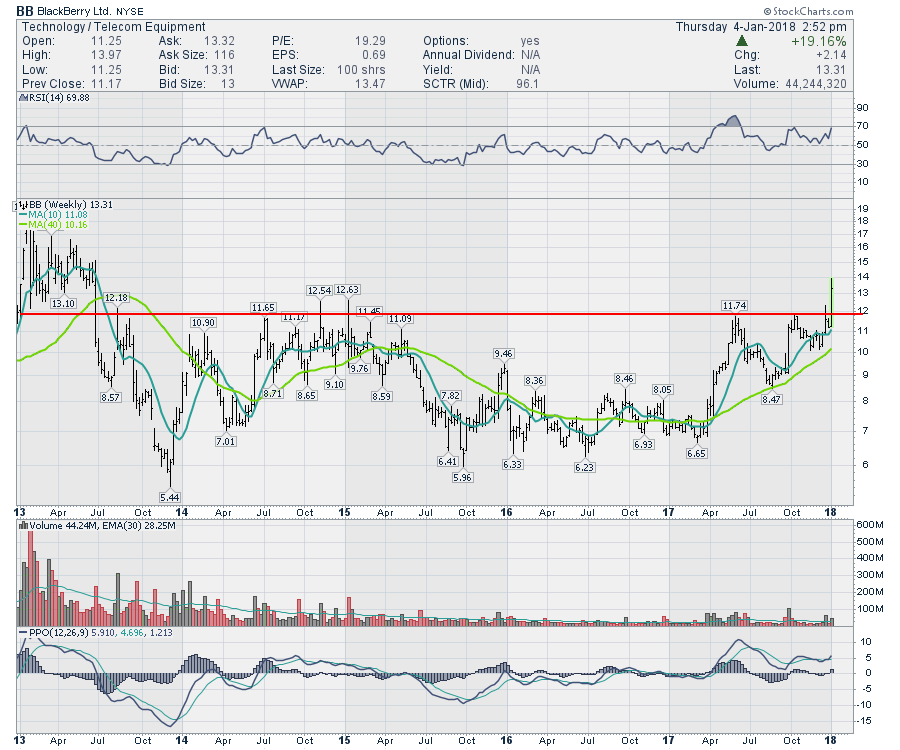
Blackberry (BB, BB.TO) looks like it is Back To The Future. The stock has been associated with a massive fall from grace in the wake of the Apple iPhone. But a couple of things have happened since those days... Read More
Don't Ignore This Chart! January 03, 2018 at 05:50 AM

The five FAANG stocks, Facebook, Apple, Amazon, Netflix and Google (Alphabet), started the year strong as three moved back above their 50-day SMAs on Tuesday. Alphabet and Amazon were already above their 50-day SMAs so this means all five are back above these key moving averages... Read More
Don't Ignore This Chart! January 02, 2018 at 08:56 PM
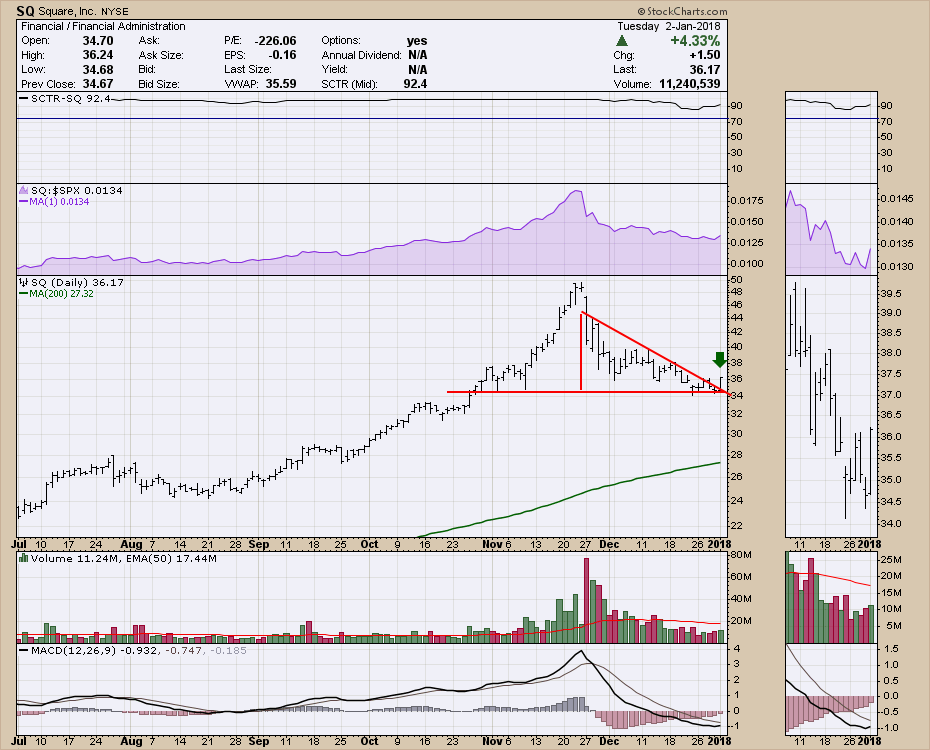
Square had a fabulous 2017. It ended the year with a bit of a pullback, but it might just be a nice opportunity. Square has formed a nice triangle right at a nice support level from early November. All of the payment system stocks had a good year last year... Read More