 The CME Group (CME), which has a number of volatility-based futures products, runs a variety of futures and options exchanges including the CME, CBOT, NYMEX and COMEX.
While the S&P 500 fell 8.82% over the last two weeks, CME Group actually gained ground and advanced 1.09%. CME was one of 21 stocks in the S&P 500 that closed higher over the last ten trading days. I will include a list of these stocks at the end of this blog post.
The price chart shows a long-term uptrend with a 52-week high six days ago. In addition, the 50-day EMA (green) is above the 200-day EMA (red) and price is above both exponential moving averages.
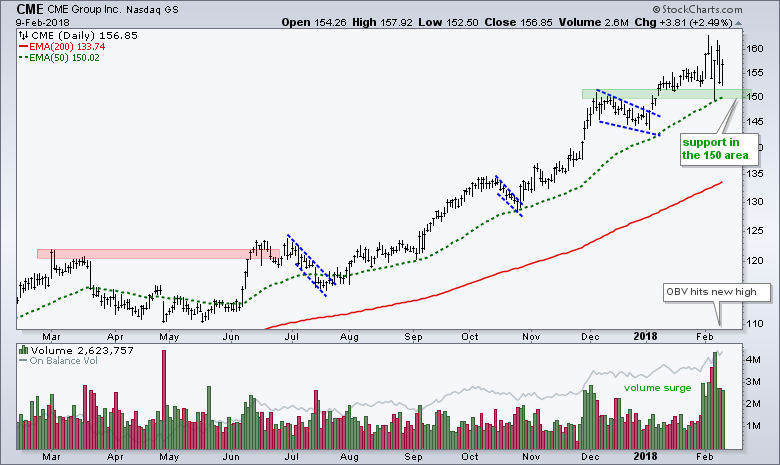
Trading did turn volatile for CME over the last six days, but this was not enough to affect the overall uptrend. Broken resistance turned into support in the 150 area and the stock bounced off the rising 50-day EMA.
The indicator window shows volume surging over the last seven days with five up days (green) and two down days (red). The gray line shows On Balance Volume (OBV) moving to a new high this month and this affirms strong buying pressure.
Plan Your Trade and Trade Your Plan.
- Arthur Hill, CMT
Senior Technical Analyst, StockCharts.com
Book: Define the Trend and Trade the Trend
Twitter: Follow @ArthurHill