 Dow component Disney (DIS) is feeling the heat today with a triangle break and move below the 200-day moving average.
Disney has been one of the weaker stocks in the Dow Industrials over the last few years. The stock peaked way back in August 2015 and formed lower highs the last 2+ years. Most recently, the January high peaked below the April 2017 high.
The stock appears to be breaking down with the third move below the falling 200-day SMA and a triangle break. This is not the most symmetrical or picture-perfect triangle, but the shaded area marks a consolidation and the stock broke through this consolidation.
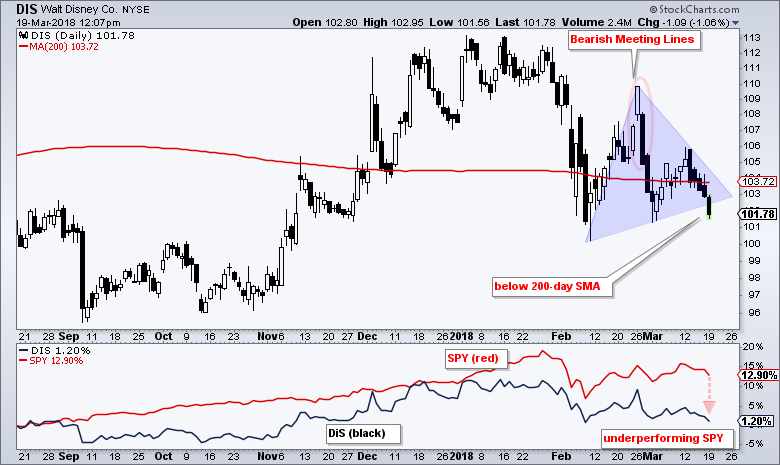
Candlestick aficionados can note a rare meeting lines candlestick pattern on February 26th and 27th. The open of the long white candlestick (108) is equal to the open of the long black candlestick.
The indicator window shows the performance line for Disney and SPY over the last seven months. SPY is up a handsome 12.89%, but Disney is up less than 2% and seriously underperforming.
Plan Your Trade and Trade Your Plan.
- Arthur Hill, CMT
Senior Technical Analyst, StockCharts.com
Book: Define the Trend and Trade the Trend
Twitter: Follow @ArthurHill