US Bancorp lagged the broader market the first half of the year, but managed to firm from March to June and lead with a breakout in July.
The chart shows USB falling from 57 to 49 with a sharp decline from late January to late March. The stock managed to firm after this decline and traded in the 48 to 52 range for over three months.
Signs of buying pressure began to appear with the island reversal at the end of May. This reversal occurred with a surge in upside volume and upside volume continued to outpace downside volume in June and July.
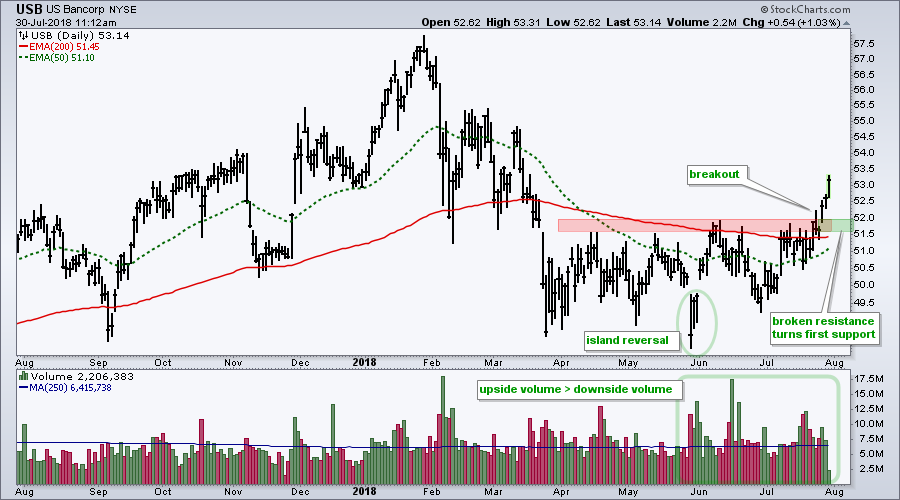
With a sharp advance the last three days, the stock broke above resistance and this is a bullish event. The breakout zone in the 51.5-52 area turns into the first support zone to watch. There is sometimes a throwback to prior resistance and this can offer a second chance to partake in the breakout.
Plan Your Trade and Trade Your Plan.
- Arthur Hill, CMT
Senior Technical Analyst, StockCharts.com
Book: Define the Trend and Trade the Trend
Twitter: Follow @ArthurHill