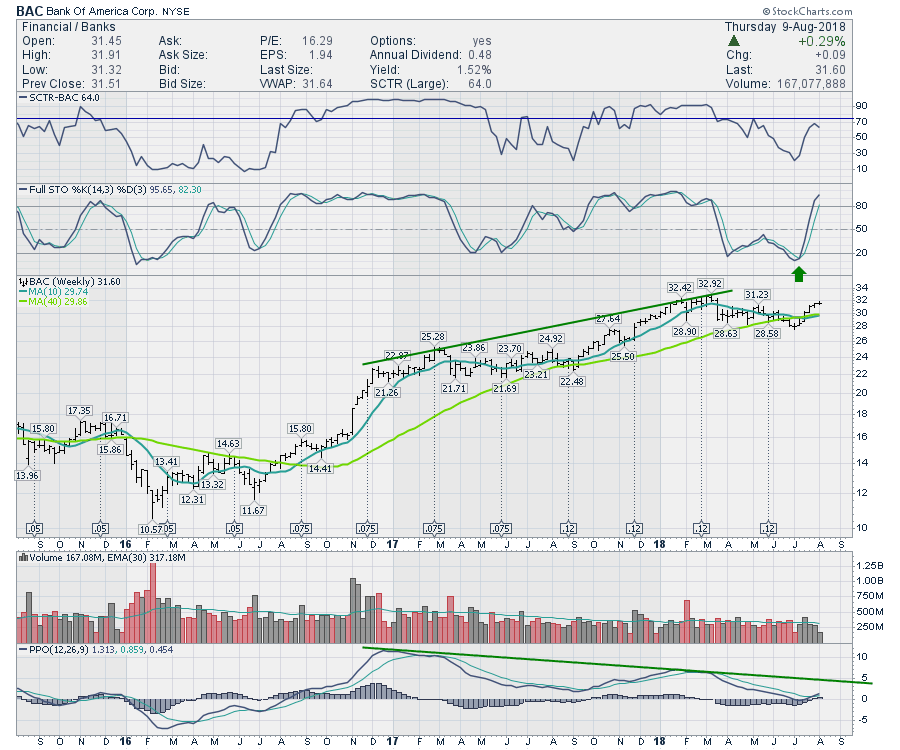
Bank of America (BAC) is approaching the highs hit back in March. This is technically an important setup for the stock. In the big picture, the March 2018 high had a lot less momentum than the March 2017 high as shown by the PPO indicator.
As the stock rallies up to the old highs, the PPO momentum is bouncing off the zero level. This can mean the stock is making a reset in momentum and starting its next run. However, a failure to make a higher high in momentum would suggest caution for the bulls. The green trend line on the PPO is an important place to watch the price action of the stock.
I mentioned on The Final Bar recording that a lot of the stocks in different industry groups are all over the map. Some breaking out to new highs while in the same industry group, some are struggling below the 200 day moving average. Typically when the leadership stocks in a given industry are so disparate, it is a good time to be mindful that your trade does not have broad industry support. While JPM is even closer to new all time highs, C, WFC, and USB are all significantly lower than their previous peak and hovering just above the 40 week moving average. With leading industry groups like the Broker / Dealer stocks below the 40 week moving average, it adds even more caution. If BAC can break through, great. Technically, it is not a slam dunk that this will be easy to do.
For my Chartcon 2018 presentation, I'll be focusing in on some key trading ideas and the reference chart will be Goldman Sachs. Be sure to catch it live tomorrow morning!
The Final Bar show I mentioned above is posted here for your convenience.
Below is the Commodities Countdown video that walks through the commodities set up right now.
Below is the recording of The Canadian Technician Video. This video shows some great examples of how breadth breaks down before the markets weaken.
Don't forget to register for Chartcon 2018. It starts tomorrow morning, bright and early!
If you are missing intermarket signals in the market, follow me on Twitter and check out my Vimeo Channel often. Bookmark it for easy access!
Good trading,
Greg Schnell, CMT, MFTA
Senior Technical Analyst, StockCharts.com
Author, Stock Charts for Dummies
Want to read more from Greg? Be sure to follow his two StockCharts blogs:
Commodities Countdown and The Canadian Technician
