It is always hard to bet against the mouse house. The world enjoys the magic of Disney everywhere. With the plan for Disney to deliver its own over the top service, all eyes are on Disney to see if that can work. If any one company has the content to do it, it is probably Disney.
Let's look at the chart, because Disney made fresh new all time highs when dividends are included on Friday.
so This chart has multiple things that make it bullish. The stock has been outperforming since early October. While the rest of the market pulled back, Disney held up very well. That is really bullish. We can see this also broke a three year down trend in relative strength as well as new 52-week highs in relative strength. Very bullish when the stock did not drop like the indexes. The price has been consolidating for four years and has been in a $20 range for the last two. That is very bullish overall. The recent price action which is continually stretching the ceiling suggests this base is about to be left behind.
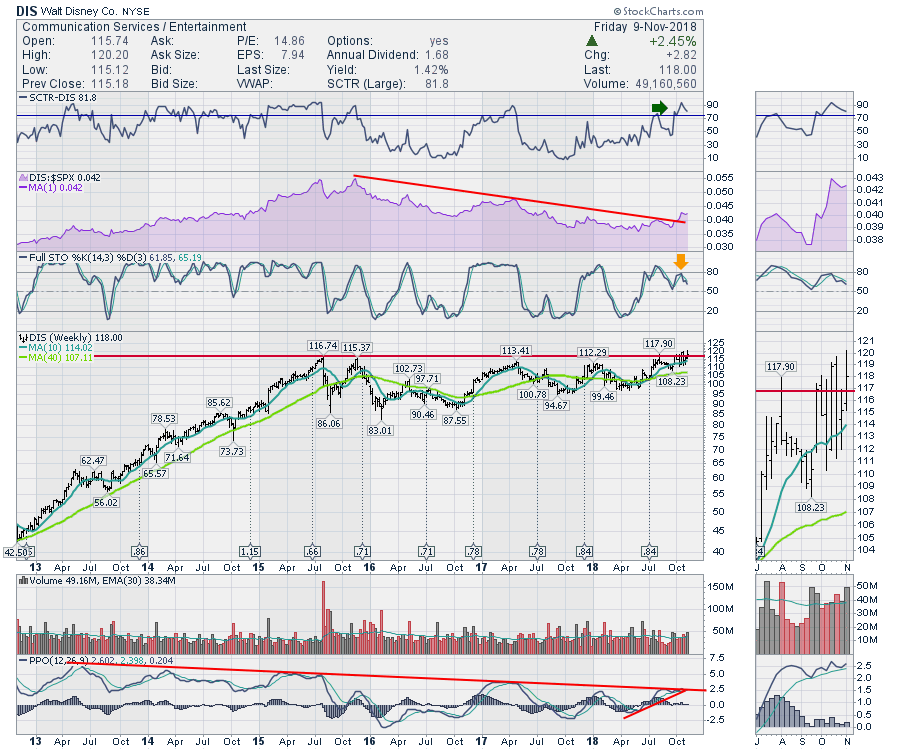 One thing to watch on Disney is the momentum trend shown on the PPO. It looks like it wants to push higher in terms of momentum but it is up against this declining momentum line. Be careful if the momentum starts to roll over here. The reason this trend line exists at all is the momentum continually peaks just when investors thought the stock could go on to new highs.
You can also see Arthur Hill's commentary on the short term setup in this article for members. Disney close up. One of the best values on the internet is the editorial content on StockCharts.com.
The Canadian Technician video shows the bounce off the late October lows in Canada. Canada is back below the 2008 highs. Tough ten years for investors.
Here is this week's broad market review video. This also demonstrates the new Market Summary video and how to get to it.
This video covers off some of the recent price action since the late October lows. It also covers the areas where we may expect resistance through the upcoming week. The drop in oil has been huge and this is discussed on the video.
If you are looking for a small gift, you might have family or friends that would like to learn more about the basics of charting. The first section of the book walks through all the chart settings to get the charts you want. The second section is why you might use charts for investing and the third section is putting it all together.
Click here to buy your copy today! Stock Charts For Dummies.
If you are missing intermarket signals in the market, follow me on Twitter and check out my Vimeo Channel often. Bookmark it for easy access!
Good trading,
Greg Schnell, CMT, MFTA
Senior Technical Analyst, StockCharts.com
Author, Stock Charts for Dummies
Hey, have you followed me on Twitter? Click the bird in the box below!
Want to read more from Greg? Be sure to follow his StockCharts blog:
The Canadian Technician
