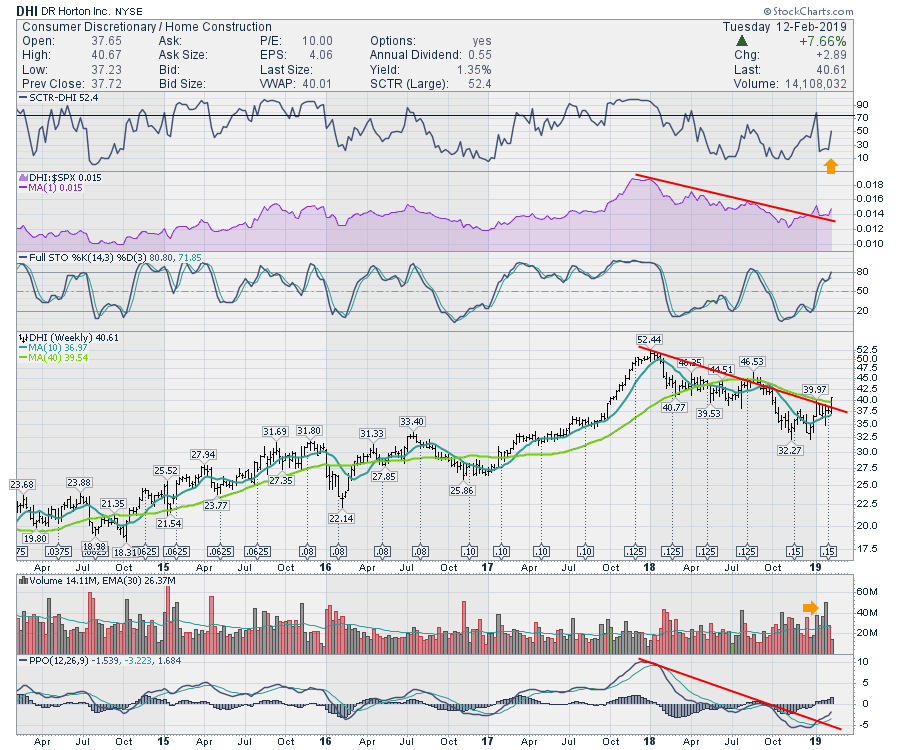
D.R. Horton (DHI) has been in a year-long down trend. Yesterday, on the back of a broad move by the indexes higher, DHI broke above a long downtrend line. It's early in the week, but this would be the first close above the trend line in a year if we can stay at these levels through Friday.
A couple of promising signs are starting to show up on the chart. Starting at the bottom, the Percentage Price Oscillator (PPO) displays momentum and has broken the down trend, suggesting this breakout was going to occur. The Full Stochastics are surging above 80%, which is very bullish. DHI spent the whole of 2017 above 50%. The relative strength shown in purple also broke the down trend a few months ago. On Tuesday, price surged above the 40-week moving average, the first time since the 2nd quarter of 2018.
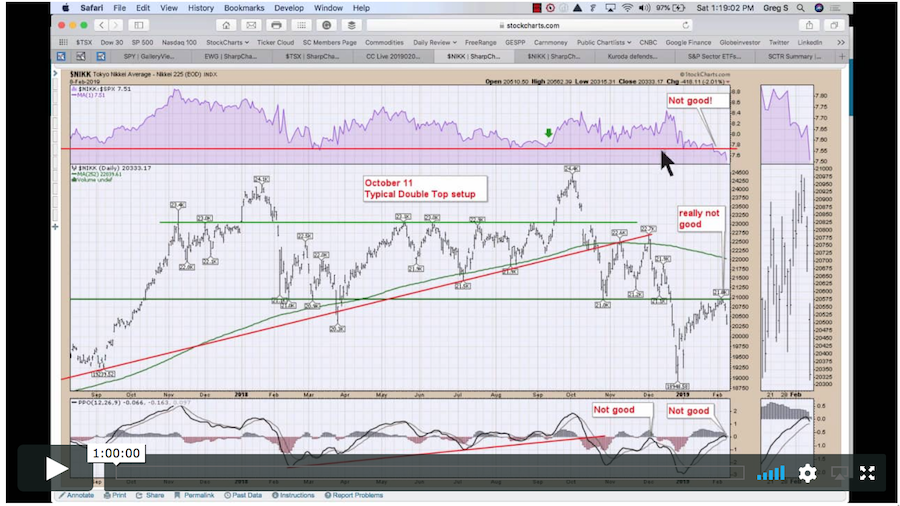
For more, check out this week's Weekly Market Roundup video! There is a conversation about the global markets and the precarious setups they are in; additionally, the last 5 to 10 minutes discusses the $USD and other currencies. I am watching for confirmation from currencies, bonds and global markets, which may converge to show their direction over the next few weeks.
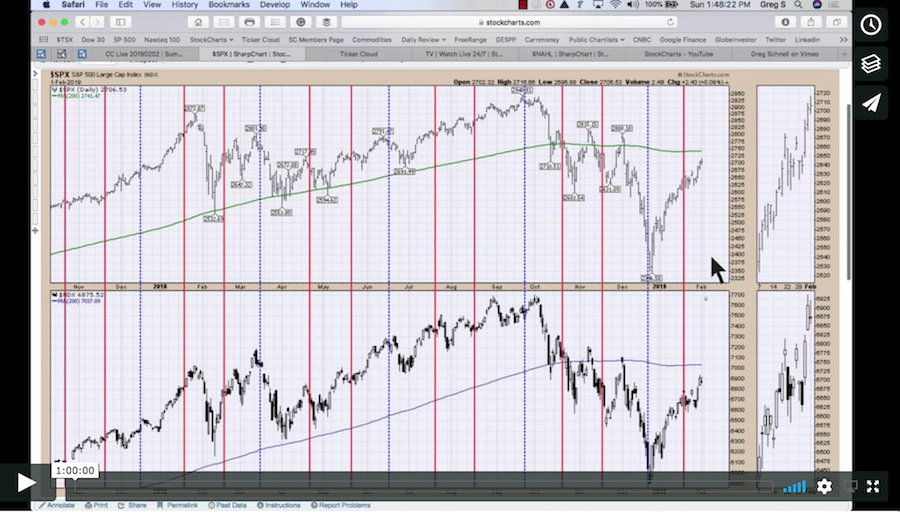
Last week, I discussed the bond setup as being attention-getting. This week, it continued to build on that setup. I would encourage you to watch last week's video here.
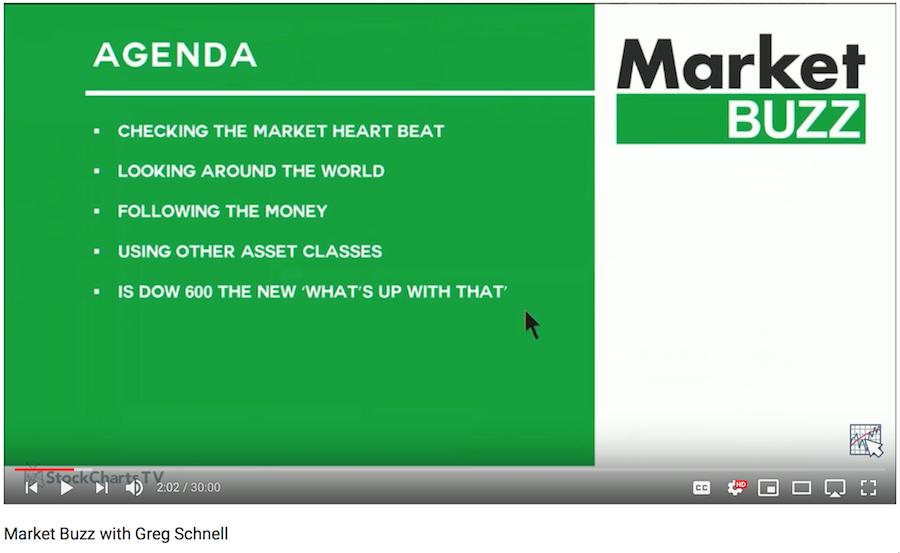
You can find a new Wednesday Edition of Market Buzz on StockCharts TV (click here!) at 10:30 AM ET.
Friday's installment covered some of the things Greg checks to investigate market health.
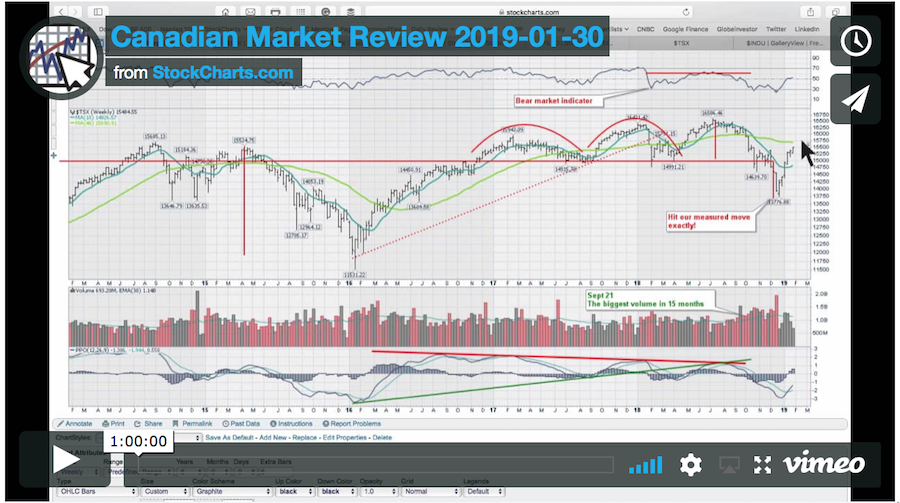
 Here is the latest Canadian Technician video, dealing with the Canadian Markets.
If you would like to learn more about the basics of charting, check out Stock Charts for Dummies. The first section of the book walks through all the chart settings you need to help you get the charts you want, the second section explores why you might use charts for investing and the third section is about putting it all together.
Click here to buy your copy of Stock Charts For Dummies today!
If you are missing intermarket signals in the market, follow me on Twitter and check out my Vimeo Channel. Bookmark it for easy access!
Good trading,
Greg Schnell, CMT, MFTA
Senior Technical Analyst, StockCharts.com
Author, Stock Charts for Dummies
Hey, have you followed Greg on Twitter? Click the bird in the box below!
Want to read more from Greg? Be sure to follow his StockCharts blog:
The Canadian Technician
