 Since the beginning of the month, NFLX is lagging the S&P 500 index by more than 5%.
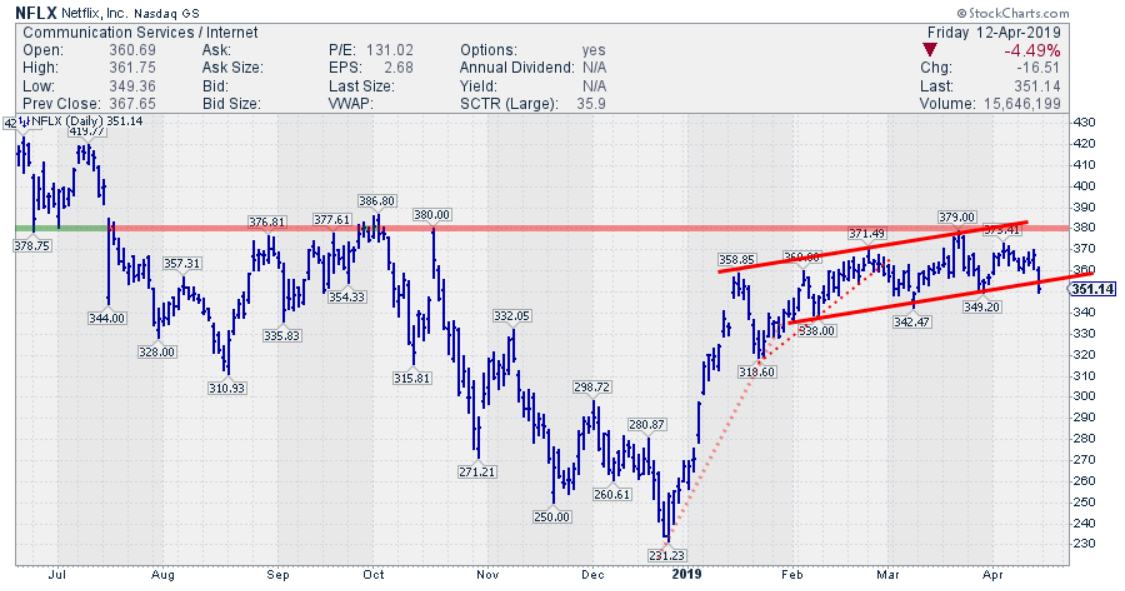
This is following the relative weakness that entered this stock after a strong start of 2019, where NFLX initially ran from $230 to $370 but started to move sideways, facing heavy overhead resistance around $380.
From January to March, the subsequent highs were still higher than their predecessors, albeit only marginally.
Failing To Push Through Resistance
NFLX's failure to push higher was already an indication of weakness, which was confirmed by the first high in April coming in lower than the $379 March peak. It was also the first time that NFLX failed to touch the upper boundary of the shallow rising channel that appeared from Jan/Feb onwards.
Looking at various trend lines that could have been drawn since the start of this year, I see three potential support lines. In the chart above, the first two are dotted red while the last one is solid red.
The initial trend line emerges out of the late December low and connects it to the first low in January. Two-touch trend lines are very dangerous and notoriously unreliable; this one gave way shortly after the low was in place.
The second trend line emerges out of that January low and has more touch points, making it a bit more reliable. However, this one also lasted for a brief period only and was broken downward at the end of February.
The third trend line, the solid red support line, has three clearly marked touch points at the lows since February, making it the most reliable one of all three. At Friday's close, NFLX broke below this rising support and is now on its way to challenge/break near $349.
All in all, the chart of NFLX is sending a lot of warning signals and the stock should be approached with caution. A break of the support levels clustered around $340 will very likely cause an acceleration of the decline.
My regular blog is the RRG Charts blog. If you would like to receive a notification when a new article is published there, simply "Subscribe" with your email address.
Julius de Kempenaer
Senior Technical Analyst, StockCharts.com
Creator, Relative Rotation Graphs
Founder, RRG Research
Want to stay up to date with the latest market insights from Julius?
– Follow @RRGResearch on Twitter
– Like RRG Research on Facebook
– Follow RRG Research on LinkedIn
– Subscribe to the RRG Charts blog on StockCharts
Feedback, comments or questions are welcome at Juliusdk@stockcharts.com. I cannot promise to respond to each and every message, but I will certainly read them and, where reasonably possible, use the feedback and comments or answer questions.
To discuss RRG with me on S.C.A.N., tag me using the handle Julius_RRG
RRG, Relative Rotation Graphs, JdK RS-Ratio, and JdK RS-Momentum are registered trademarks of RRG Research.
