 I’ve been teaching investors about Stage 9 – The Selling Stage – of the Tensile Trading methodology for over 15 years. My observation is that novice investors need a simple selling routine as a fist step. Once they are able to embrace the necessity and validity of deploying a selling strategy, they are better able to move forward and empower their own actual exit strategy. Before the empowerment comes the embrace.
In this case, the embrace is the straightforward three descending peaks selling routine I’ve written about before here. This week’s blog will move forward to step 2 – the empowerment phase where we add an indicator (On Balance Volume) to the basic three descending peaks selling routine and show how this increases the probability and accuracy of our sell signal.
As all investors trade in different timeframes, don’t flood me with comments about the specific descending peaks I’ve highlighted. Instead, focus on the primary principle I’m trying to share with you and then apply it yourself to whatever timeframe you trade.
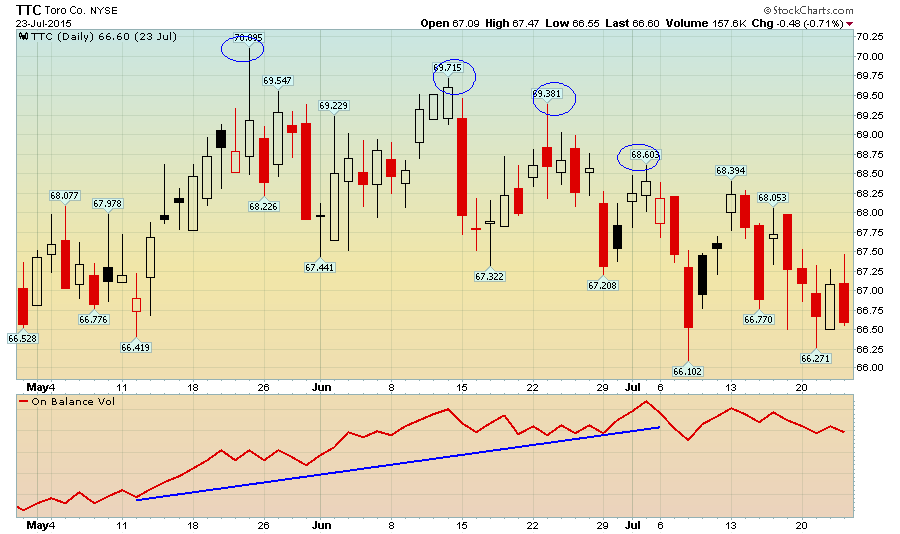
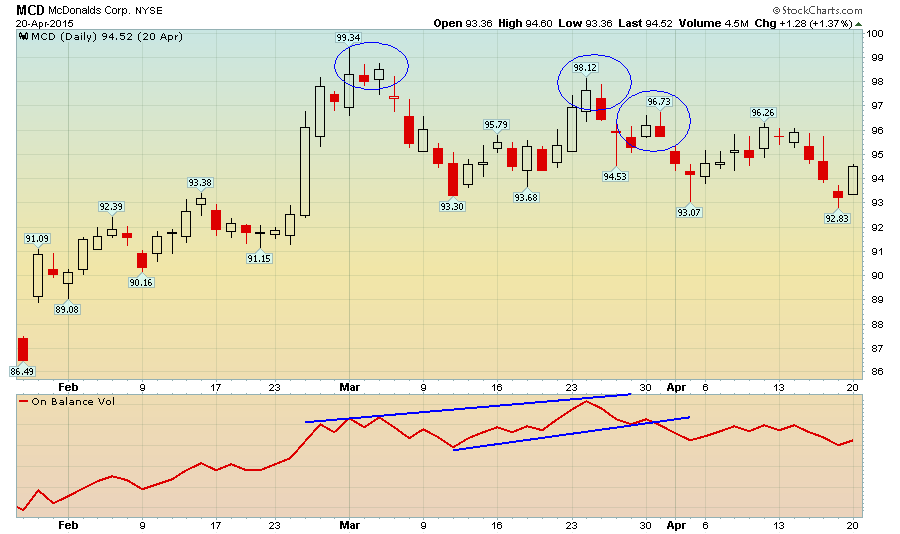
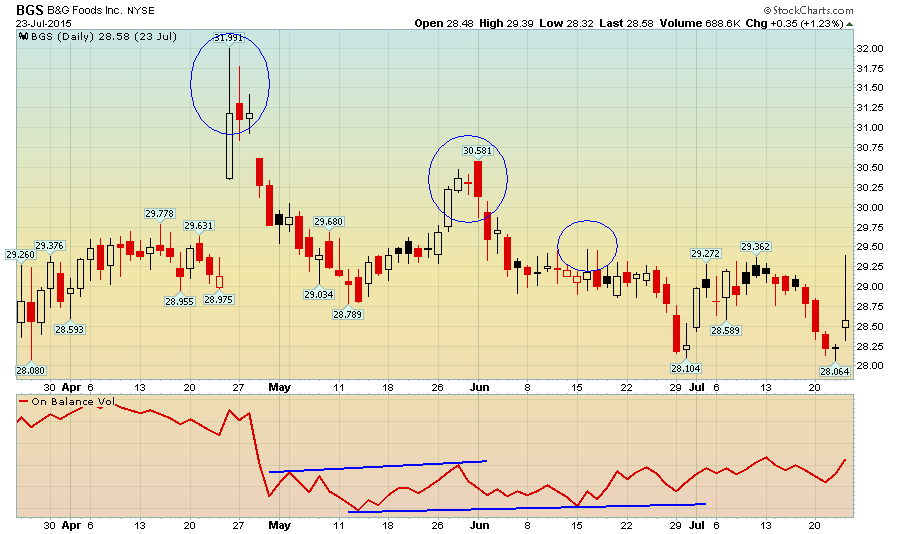
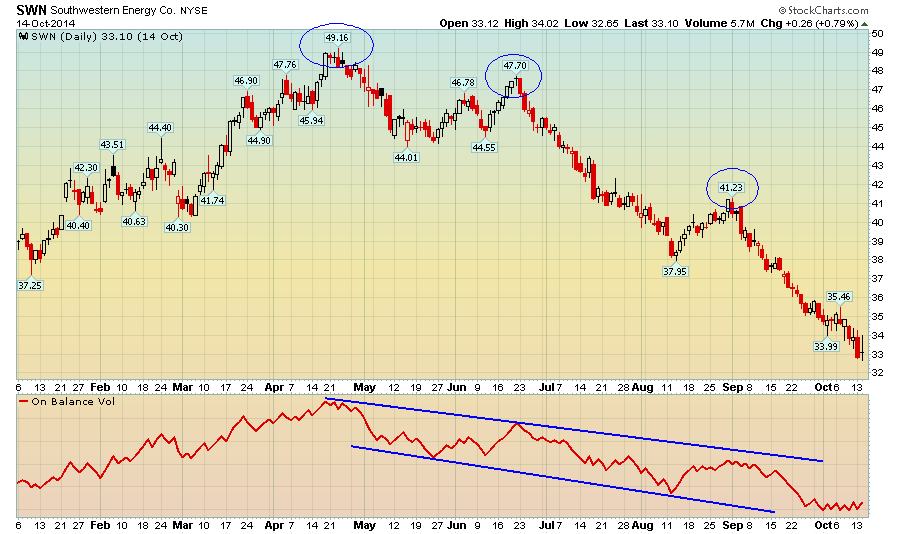
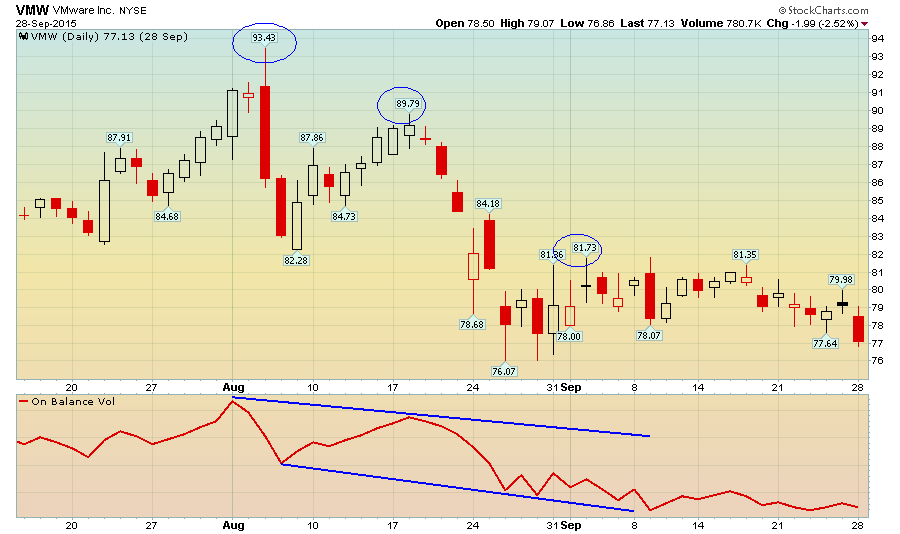
Three descending peaks usually present us with a simultaneous trend change. We are simply looking at three attempted rallies, each one lower than the previous rally peak. When prices close below the lowest valley in the formation, we exit.
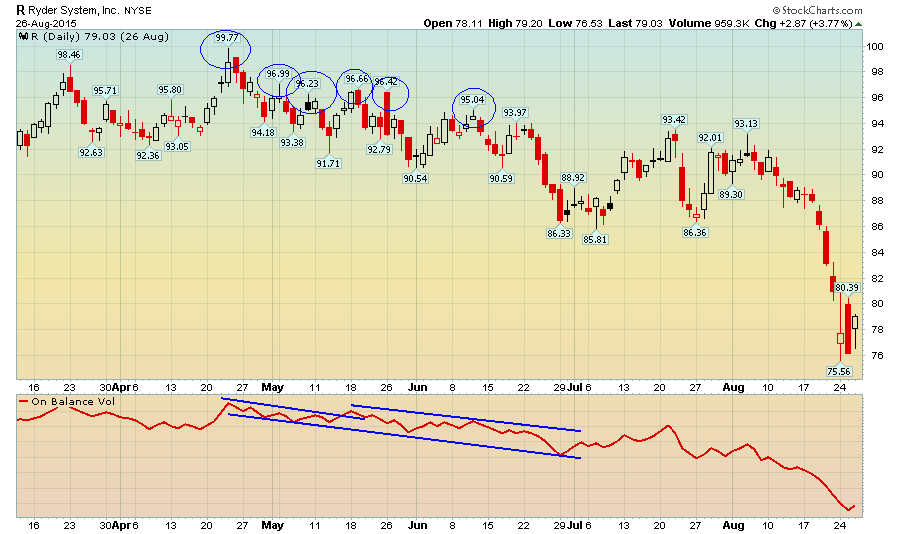
I submit to you that with the addition of the On Balance Volume (OBV) indicator, we enhance our probabilities of reading the three peaks formation more accurately. From my examples, you can see that three descending price peaks accompanied by positive or even horizontal OBV lines suggests that price deterioration is not confirmed by money flow. In other words, the divergence between the two indicators is not as bearish as if you focused simply on the three descending price peaks alone. Conversely, when you have negative money flow – as indicated by a down-trending OBV – accompanying three descending price peaks, this confirms a serious bearish situation and should be acted upon accordingly.
Lastly, I’d like to remind investors that brokerage commissions, being as low as they are, should be virtually eliminated as a factor in your selling decision. Just do the right thing. Let me also remind you that pyramiding out of your position in portions has been proven to be the most profitable methodology. As the evidence mounts and the market delivers more bearish clues, you must act. The combination of three descending peaks and OBV increases the probability that your actions will be profitable.
Trade well; trade with discipline!
-- Gatis Roze, MBA, CMT
Developer of the StockCharts.com Tensile Trading ChartPack.
Presenter of the Tensile Trading DVD, Stock Market Mastery.
P.S. Click HERE for information on my future appearances & seminars.