 Yes, the markets are extended. All prudent investors should be reviewing the Permission-to-Sell Dashboard (ChartList 10.4) every week. We’ve added another useful market timing chart and made all 15 charts more muscular.
The times are a’ changing in the ETF arena as well. Hundreds are closing and new smart beta ETFs are being added. This update reflects those profound changes.
The same is true for you sector investors. There have been tectonic shifts in the composition of the S&P Sector ETFs which are reflected in ChartLists 401-409 (see below). As always, we’ve mined the Fidelity Select Funds to uncover their recent buys and sells. Those are just some of the recent embellishments and additions to what is now the 18th upgrade to the Tensile Trading ChartPack since 2013. We have gone from what began as a useful ChartPack to one that is virtually essential.
Some of This Quarter’s Updates...
10.4 — Permission to Sell: Dashboard
This is one ChartList that I check religiously every two weeks. It gives me the confidence to stay the course and to remain bullish and stay long. Markets do not collapse overnight without early warnings. This ChartList contains 15 charts that provide those warnings. Deterioration beginning in these charts allows an investor to start taking money off the table and lock in profits. Each individual investor must decide the amount of evidence or the degree of deterioration they personally require. Nevertheless, you’ll find this ChartList powerful indeed.
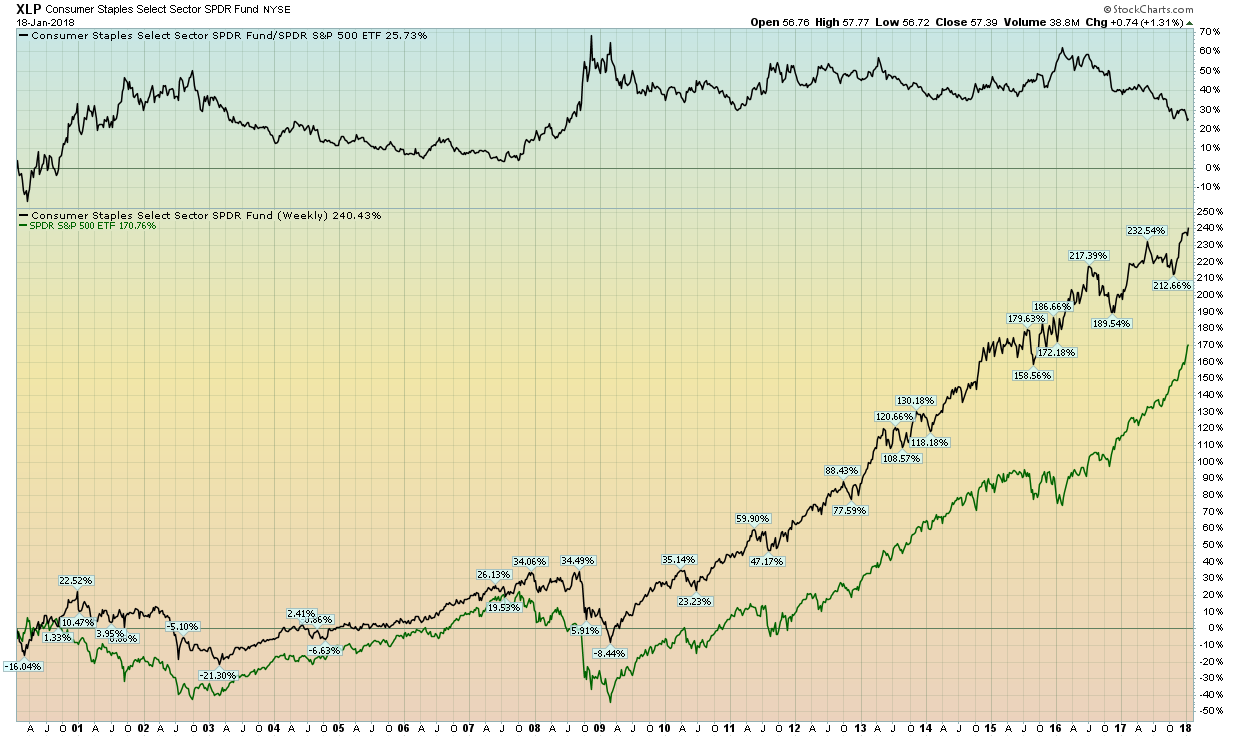
All the charts now take advantage of the “Verbose” charting option under the “Legends” tab which expands ticker symbols into full-blown descriptions for much easier understanding about precisely what you are looking at. We also added chart #4.27 — Consumer Staples (XLP) versus the S&P 500.
This sector (XLP) historically holds up better during market corrections than most other sectors. It also tends to be the last sector to roll over once a true correction begins, thereby providing confirmation to the seriousness of the downturn. Also, don’t ignore the chart notes where pithy observations about each chart reside.
105 — ETF Masterlist:
Surprise! Hundreds of ETFs are closing or have already closed. If you pay attention to trading volumes and spreads, they are easy to avoid. The S&P International Sector ETFs — such as Utilities (IPU), Technology (IPK), Materials (IRV) and so on — have closed. There are others, such as Global X Guru Index (GURI) and ProShares Ultra Short TIPS (TPS) that garnered a lot of press when launched but have now vaporized.
As such, we’ve made adjustments to ChartList 105. We also removed low volume ETFs such as the Canadian and Australian Currency Trusts (FXC and FXA) which are ones that you shouldn’t be trading anyways. We’ve added iShares Eurozone (EZU) whose volume justifies its inclusion in this ChartList of the most popular ETFs.
We suggest that you sort this list weekly by performance. Since this ChartList is populated with over 130 of the most frequently traded ETFs, the sorting will reveal precisely what the institutions are most enamored with presently.
Sector ChartLists 401 - 409:
For those of you who believe sector ETFs are relatively stable — you are wrong! For example, the top holding at 9% of the Industrials Sector (XLI) was General Electric in March 2017. Now, ten months later, GE is only 4.75% of XLI. For Healthcare (XLV), AbbVie Inc. (ABBV) was not even a top holding in March, but today it is the fifth largest position. For Materials (XLB), Dow Dupont (DWDP) now accounts for 22.8% of XLB. You get the point. These are not static. The new ChartLists reflect the changes.
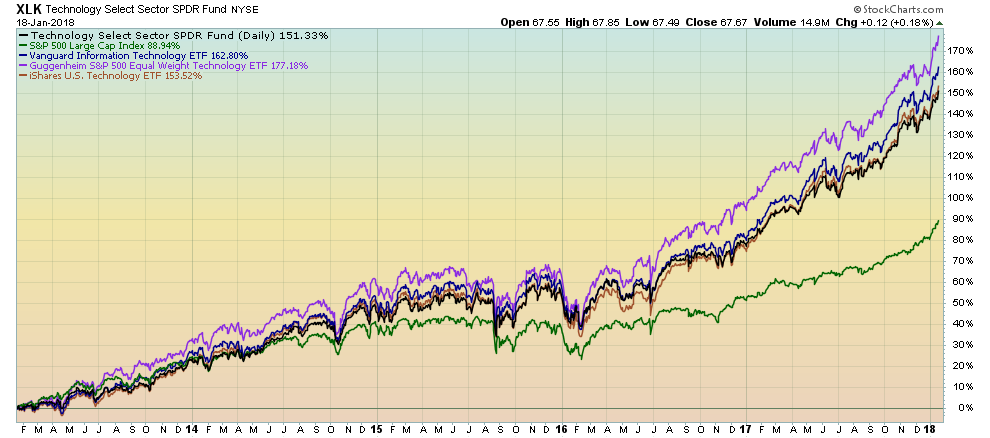
The basis for much of technical analysis is using the power of confirmations and divergences to help us increase our investing probabilities. With that in mind, we feel it is imperative to have a truly accurate grasp of the market’s sector behaviors. We have therefore added sister sector ETFs from Blackrock, Vanguard and Guggenheim (Equal Weighted) to our existing S&P Sector SPDRs ChartLists. Don’t overlook the equal weighted aspect of the Guggenheim sector ETFs. I’ve been using them for awhile now and I like the insights.
 Sector investing is here to stay as it provides the essential foundation for top industry groups and stocks. Sector rotation has become a popular strategy amongst traders. With the relatively low expenses of ETFs, it is clearly advantageous to use ETFs versus mutual funds for this investing style. Our ChartLists are populated with the most important tickers to increase your likelihood of succeeding in trading these sector ETFs, as well as help in identifying strong sector trends to trade the most appropriate individual stocks.
ChartList 640 — Institutional Dividend Darlings:
We have added 14 equities to this ChartList of dividend aristocrats. The previous ChartList was populated by the 12 most popular dividend-paying stocks held by top-rated dividend-oriented ETFs and mutual funds. Now we have added those S&P 500 stocks that have raised their dividends for 25 years straight. This clearly implies both financial corporate health as well as powerful sustainability. This ChartList is populated with over two dozen of the very best and most attractive dividend-paying stocks in the marketplace. If yield is an objective with your investing, please look here.
ChartLists 420-12 to 420-90 - Fidelity Sector Portfolios:
In an active bull market like the one we find ourselves in at the moment, watching where and how the big institutional funds allocate their investment capital can yield timely, actionable insights. By carefully tracking the top 10 holdings of all 41 Fidelity Select Sector Portfolios from quarter to quarter, we can piggyback on the smart money as it moves big cash into new positions. As any good Wyckoffian will tell you, the power of institutional support is immense.
So, with that in mind, let’s take a look at some of the key observations from the Q4 Fidelity Select funds update:
- As we mentioned above, AbbVie (ABBV) has rapidly become the 5th largest holding in XLV, the Health Care sector ETF. That was mirrored in the Fidelity BioTech portfolio, which took a substantial position in the stock this past quarter. Take a look at the chart of ABBV and, in particular, check out the strong uptrend in its OBV indicator. Remember, institutional support provides a powerful boost.
- Last quarter, we highlighted tremendous buying activity in the Consumer Discretionary fund, with a nearly 100% increase in total holdings from 54 to 100. This quarter, the buying continues, with total holdings by the fund jumping another 27%. The Consumer Discretionary sector as a whole has been a recent leader (see XLY). Be sure to take a look at some of the changes in this fund, and consider watching those positions closely.
- Lots of buying activity in the Consumer Staples portfolio as well, which added a significant position in Pepsico (PEP).
- The Industrials sector has also been a strong leader, so it was interesting to note some of the moves made by both the Industrials and Industrial Equipment portfolios. United Technologies (UTX) was a clear target in this group, with the Industrial Equipment portfolio adding the stock as one of its largest positions.
- We noticed a big shakeup in the Materials portfolio, which added big positions in Freeport McMoran (FCX) and two large specialty chemicals stocks.
- The Multimedia portfolio, which traditionally holds stocks like Time Warner and 21st Century Fox, added big positions in Apple (AAPL) and Netflix (NFLX). Those two stocks are certainly not void of support from the big money, but it’s interesting to see the “cord cutting” concept work its way further and further into the investment strategies of the institutional media investors.
Already Have The ChartPack? Here's How To Upgrade:
- Log in to your account and then click on the "Your Account" link in the upper right corner of the web page
- Scroll down and click the "Manager ChartPacks" link towards the bottom of the page
- Find the entry for the "Tensile Trading ChartPack" in the table that appears (if you don't see it, that means that you haven't purchased it - click here to do so)
- Click the "Re-Install" button next to the Tensile Trading ChartPack to start the re-install process
The download should take about 15 seconds, after which you can explore the new ChartLists and other updates.
Installation Instructions for New ChartPack Users
If you would like to add the Tensile Trading ChartPack to your StockCharts account, CLICK HERE to get started.
Trade well; trade with discipline!
- Gatis Roze, MBA, CMT
- Grayson Roze, Business Manager, StockCharts.com
StockMarketMastery.com
Co-Authors, Tensile Trading (Wiley, 2016)
Co-Presenters, How To Master Your Asset Allocation Profile