 Over 25 years of full-time trading, it’s been my experience that, as an investor, one moves ahead by looking back. In other words, reviewing my 2017 Trading Journal will improve my 2018 results. Indeed, the tenth and final stage of Stock Market Mastery is to Revisit, Retune and Refine. It’s a proven discipline that keeps on giving year after year.
Having just reviewed my 2017 journal over the holidays, I’ll share with you the key lesson this year. It can be encapsulated literally in a single word: PATIENCE. For this blog, I’ll focus on my individual stocks to illustrate how I applied “patience” successfully to some of these equities.
Before you dismiss patience as being too simplistic, consider these elements. In part, this blog also grew out of a candid holiday discussion I had over eggnog with a fellow investor and good friend. This individual expressed frustration that I had consistently made more profit in trading his ideas than he had done. After a little more eggnog, he disclosed that he felt it was only because I was a more patient investor. Then a bit more eggnog got him to admit that he wished he was capable of being more patient with his own trades. Who knew that eggnog could be such a fine social lubricant!
So let me try to explore and detail the basis of my patience. Some of my ETFs and mutual funds (such as XBI and PRGTX) actually outperformed some of my stocks, but the illustrations are clearer if we use only stocks. Before I disclose the specific individual foundations of my “market patience”, I need to reiterate the fact that although patience can be learned, it remains an attribute that varies greatly from one person to another. I’m sure many of you will attest to this fact firsthand.
Having said that, I feel readers would be well-served (and enlightened) in better understanding who I am as an investor by reading this month’s Stocks & Commodities Magazine interview with Grayson and myself, published in the January 2018 edition. StockCharts.com subscribers can access it online by CLICKING HERE and selecting "Digital Edition" (For your convenience, we've also included the article at the bottom of this blog post).
I’ll get into the specifics on each of the my stocks, but first let me describe five inputs that I believe contributed to my patience in the markets this year.
1. Moving Averages:
I’ve written many times before about how I use different sets of moving averages for different types of equities (stocks, ETFs, mutual funds, etc.). Suffice it to say, with individual stocks, any migrations below the 50-day moving average line gets my attention. What I’m looking for is institutional buying coming in to support my equity in that area. Institutions will often re-accumulate on weakness and use the 50-day moving average line for that. I’ll hold on even when price falls below the 50-day moving average if I don’t see significant institutional selling. The Wall Street Journal just published the 2017 NASDAQ chart with two blue moving average lines — 65 day and 200 trading day moving averages. Perhaps 65 trading days is indeed more appropriate.
2. Money Flow:
If you read the Stocks & Commodities Magazine interview, you’ll see that I’ve been a Wyckoffian going back for decades. (Thank you, Bruce Fraser and Dr. Hank Pruden!). We individual investors now have one-minute data available to us. Learn how to use one-minute On Balance Volume charts and combine that with an understanding of Wyckoff volume analysis — then you’ll be empowered to stay in a position that shakes out lesser investors. StockCharts.com charts can accommodate 20 days of one-minute data on each equity. Powerful stuff! You can clearly see if institutions are accumulating or distributing stocks and whether your patience is warranted.
3. Tensile Trading’s Price Relative Methodology:
The foundation of my investing is the following: (a) piling on in an uptrending market; (b) buying equities in the strongest sectors; (c) buying stocks in the strongest industry groups within the strongest sectors; (d) buying stocks that are outperforming their sister stocks in these strong industry groups and sectors. I trade strong groups with confidence, conviction and patience.
4. The Big Picture:
I read a lot of news. I stay abreast of current events around the world. 2017 has been the year of technology globally. My Global Technology Fund (T. Rowe Price PRGTX) never once broke its 65-day moving average in 2017. This gave me confidence to hold my tech equities through the challenging news month of June 2017 when the following things happened. (a) A famous short seller warned that Nvidia would plummet (it never broke its 50-day moving average). (b) The Fed raised the Fed Funds rate by one percent to 1.25%. (c) Walgreens and Rite Aid called off a $5 Billion merger. (d) President Trump pulled out of the Paris Climate Accord. (e) Macy’s reported that its margins were decimated while Nordstrom talked about going private. (f) Goldman Sachs warned of a “valuation air pocket” in tech stocks. The result? My stocks went sideways for the month of June. Despite this gloom and doom, the charts were not telling me to sell everything and move into an underground bunker. To the contrary, they endorsed my patience. Love those charts!
5. Composite Operator:
Finally, those who’ve read our book will recall that in multiple chapters, we write about the power of analyzing the markets using Wyckoff’s Composite Operator paradigm. Approaching a stock chart with specific questions about what are the Composite Operator’s true intentions and objectives — and how they are being achieved by different buying and selling campaigns — is a powerful perspective that may take years to learn but that pays dividends forever more. My point is that it’s worth the effort.
Some Examples of My Stocks Where Patience Paid Off in 2017:
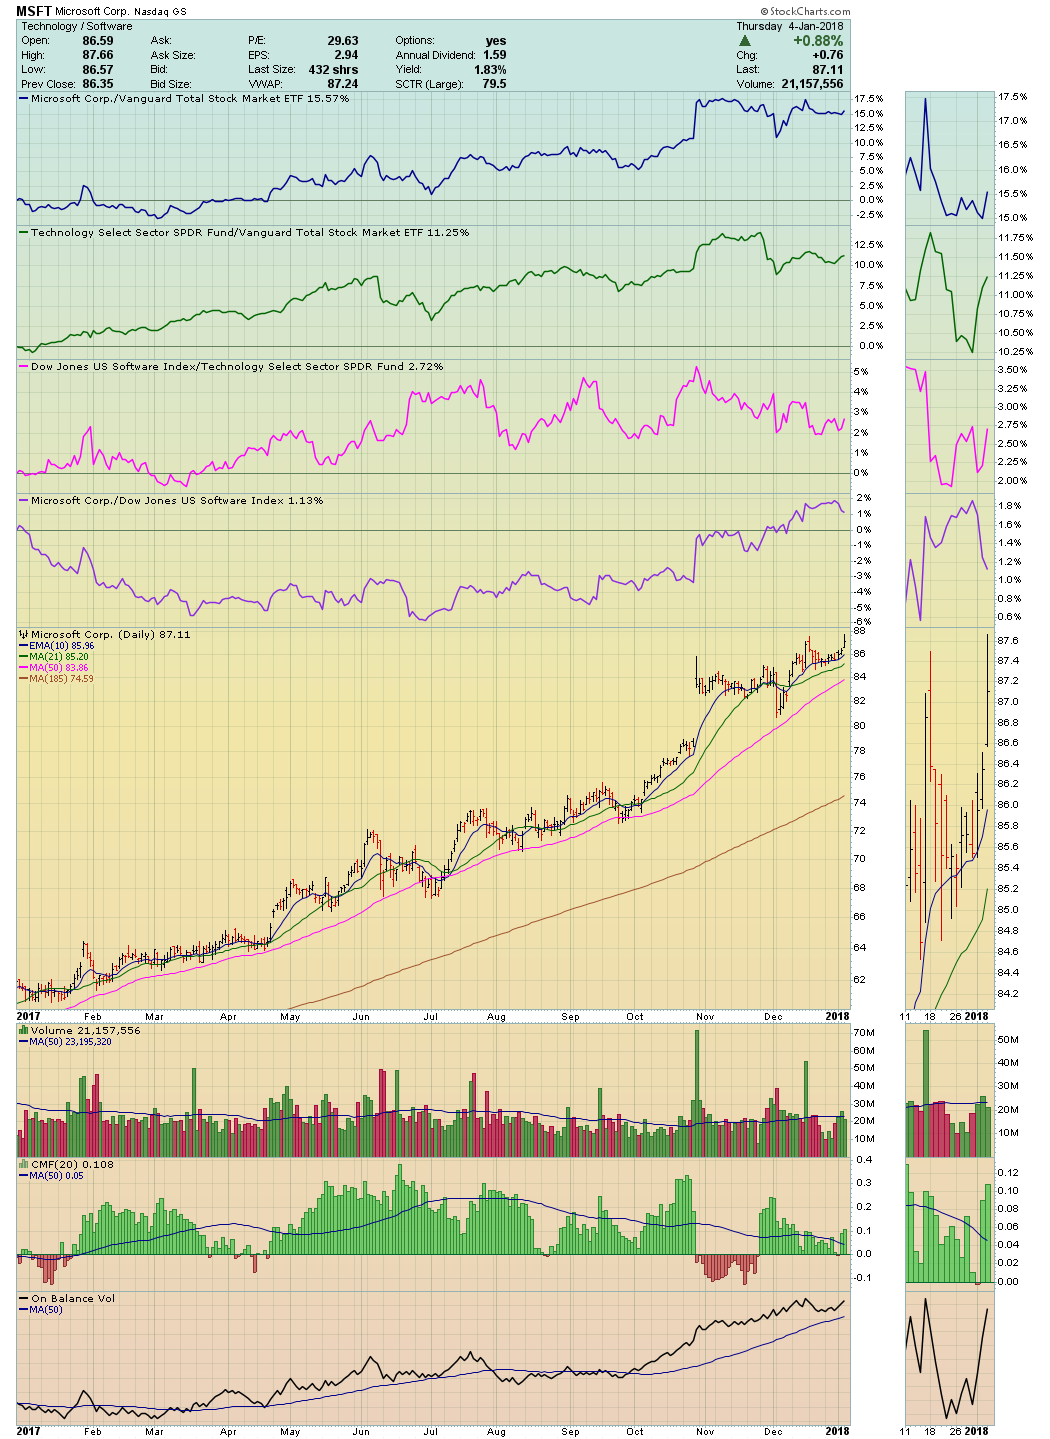 Microsoft mildly violated its 50-day moving average a few times, but it always recovered quickly. On a money flow basis, it was under accumulation most of the year. Being a tech bellwether stock, it benefited from the global tech tsunami. There was some soft negative news, but nothing of consequence. No reason to sell.
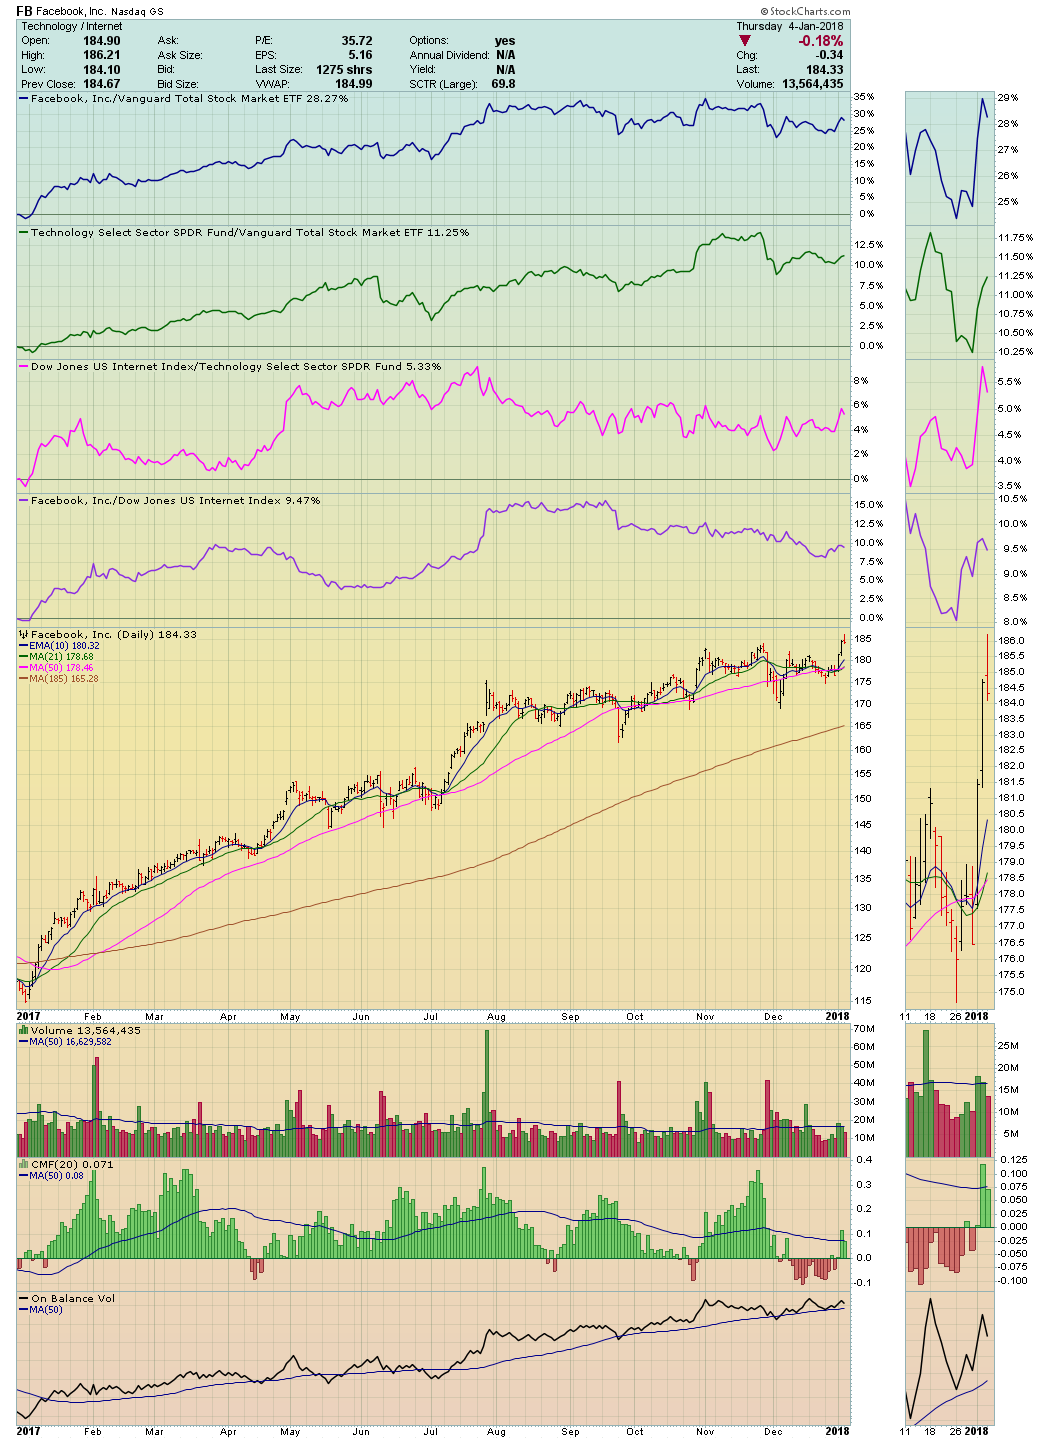 Facebook also violated its 50-day moving average a few times, but never in a serious enough manner to suggest that institutions were liquidating their positions. Indeed, money flow was positive throughout the year, confirming continued accumulation. The charts told me to sit tight and enjoy the ride.
The next two charts are sister stocks in the same sector and industry where I hedged my bet by buying both of them. I liked the group and the price action, but I could not make a strong case for Visa over Mastercard. Apparently, the market felt the same. For the first half of the year, Visa outperformed MasterCard. For the second half, MasterCard outperformed Visa. For 2017 overall, they both doubled the return of the market (VTI). The only testy time was late November when the entire group sold off—including PayPal (PYPL) and Square (SQ).
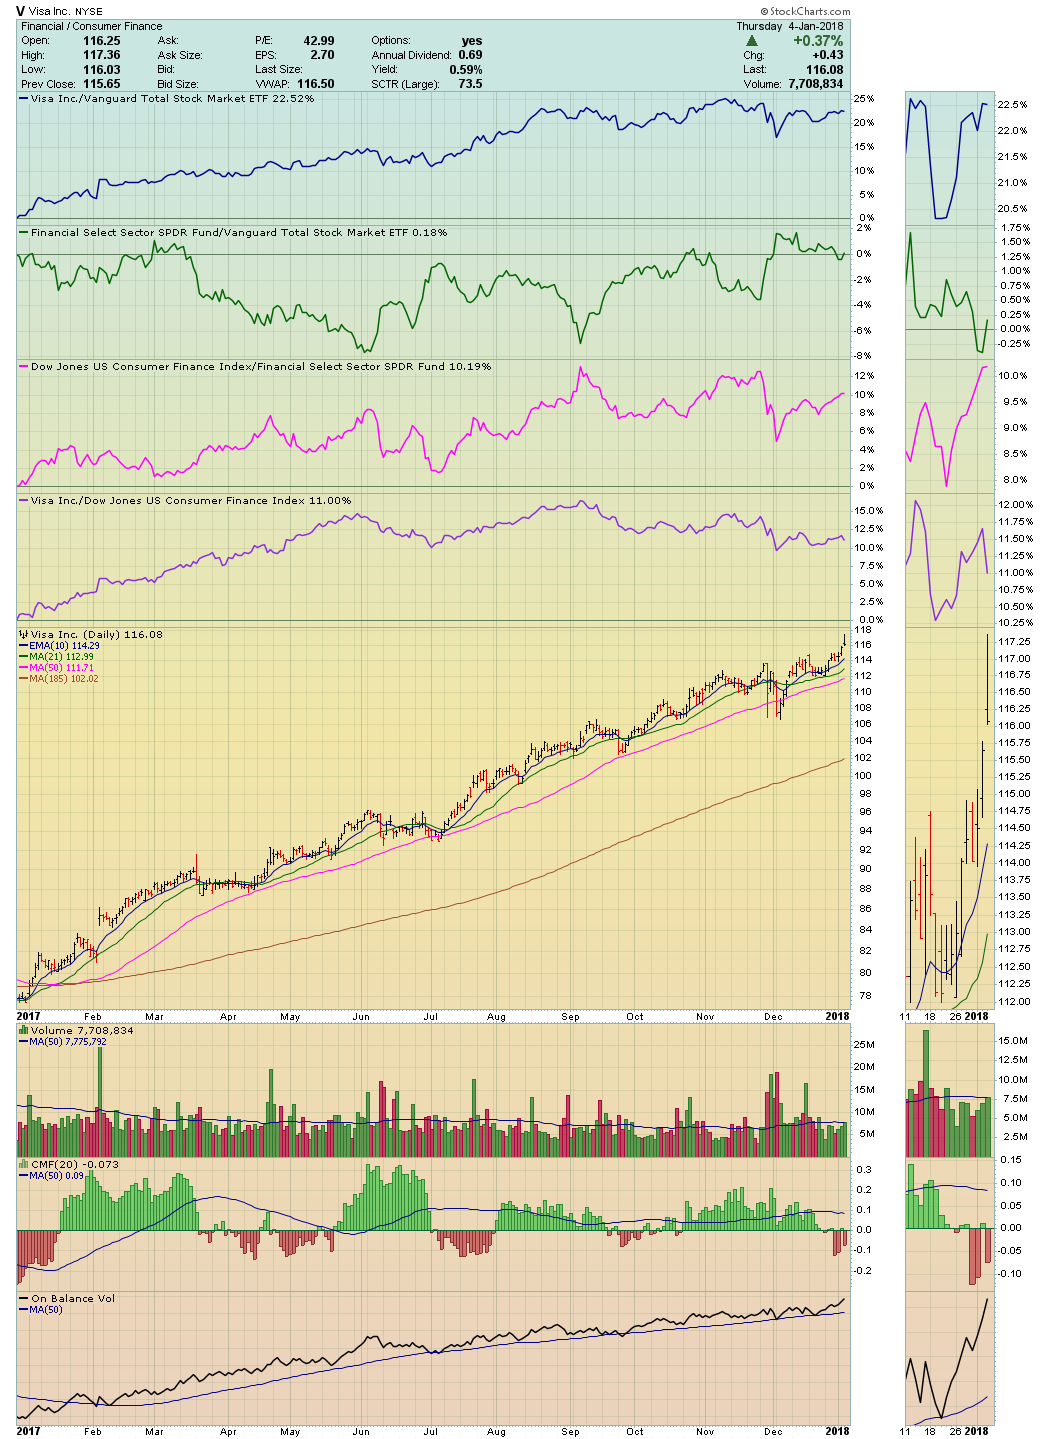 The clues to staying with Visa and MasterCard were the fact that their sister stock Square (SQ) absorbed the majority of the group’s selling, and my blue chips — V and MA — easily recovered. Here again, charting On Balance Volume by using minute-to-minute data will empower you with the conviction to be patient.
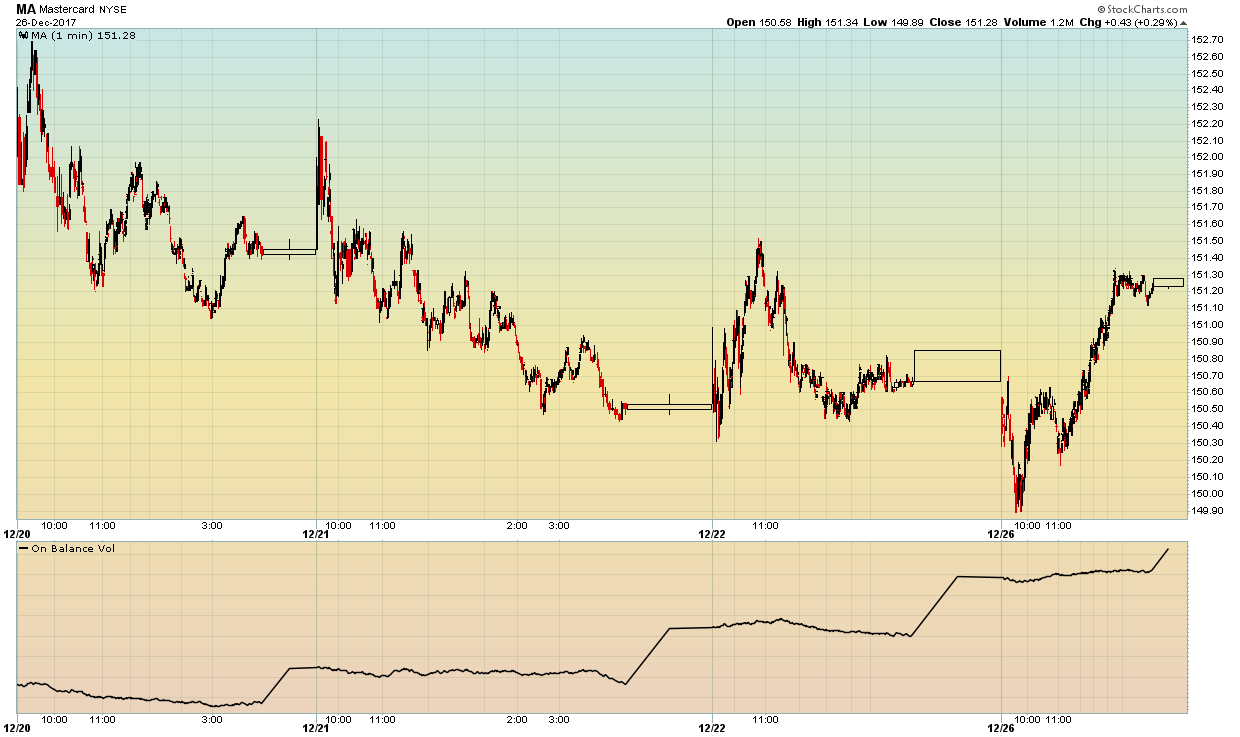 An example of what I’m describing is on this chart. Mastercard’s price falls nearly two percent from $152.72 on December 20th to $149.89 on December 26, 2017, but the On Balance Volume line clearly shows the big volume trades are on upticks — hence, MasterCard is actually being accumulated. In other words, be patient. Always remember that the markets validate the true intentions of the institutional traders. Your charts visually confirm those actual intentions despite what the news and talking heads try to tell you.
Jesse Livermore once wrote, “After spending many years in Wall Street and after making and losing millions of dollars, I want to tell you this: it never was my thinking that made the big money for me. It was always my sitting. Got that? My sitting tight!”
The following article was published in the January 2018 edition of Stocks & Commodities Magazine. For more information about Stocks & Commodities Magazine, visit Traders.com

Happy New Year!
Trade well; trade with discipline!
- Gatis Roze, MBA, CMT
- Author, Tensile Trading: The 10 Essential Stages of Stock Market Mastery (Wiley, 2016)
- Presenter of the best-selling Tensile Trading DVD seminar
- Presenter of the How to Master Your Asset Allocation Profile DVD seminar
- Developer of the StockCharts.com Tensile Trading ChartPack