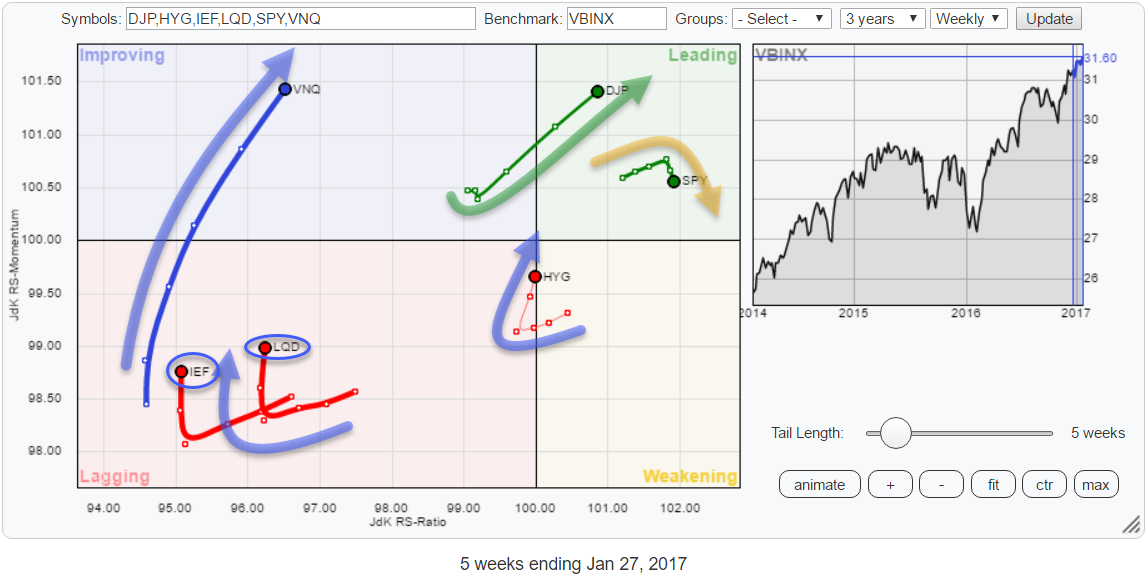
 The Relative Rotation Graph holding a number of asset class ETFs is showing a strong push of commodities (DJP) into the leading quadrant. Together with Real Estate (VNQ), these two asset classes are showing the most powerful headings in combination with the longest tails.
They deserve a further investigation.
Summary
- All tails, except one, showing a positive heading
- VNQ picking up relative strength again
- Equity/Bond ratio expected to pull back before further advance
- Long tail on DJP indicates (relative) strength, watch for a break above $ 25
Quick scan
The beauty of Relative Rotation Graphs is that they allow you to monitor multiple markets, in this case, some asset class related ETFs, in one picture. The BIG picture in ONE picture so to say.
The RRG above uses weekly data and therefore monitors longer-term trends in relative strength. One of the things that immediately catches my interest on the RRG above is the fact that ALL tails, except for one, are moving at a positive heading (between 0-90 degrees).
IEF and LQD still close to zero but VNQ, DJP and HYG are convincingly moving higher on both axes at the same time. The only asset class whose tail is pointing South(-South-East) is equities (SPY). With the Government bond market at the other end of the spectrum pointing higher, the Equity/Bond ratio should make an interesting chart.
Real Estate - VNQ
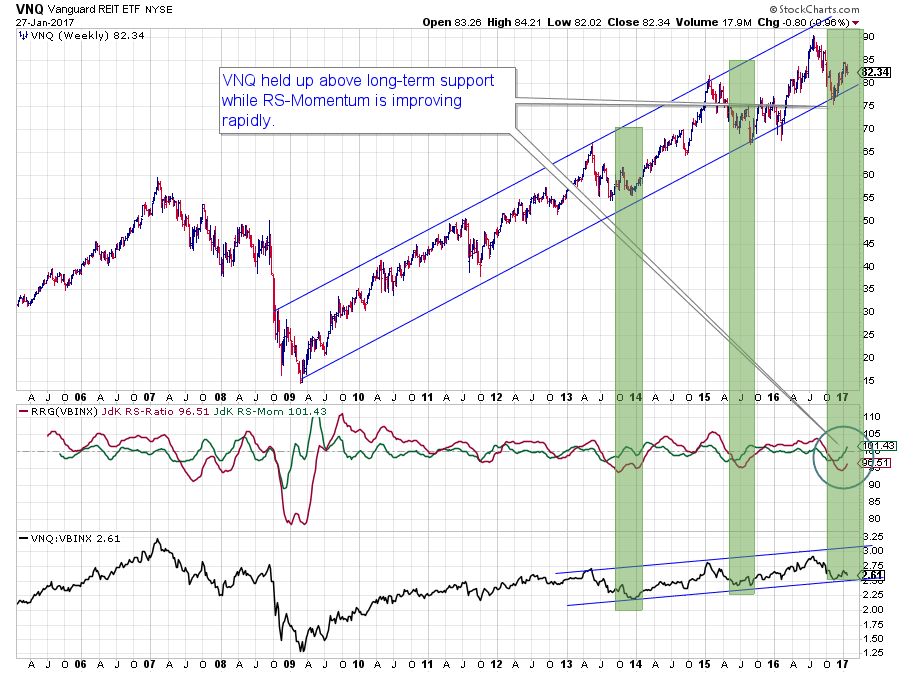 The long-term trend of REITs as represented by VNQ is quite impressive. Since their low in 2009 around $ 15, they more than quadrupled in price.
Over this eight-year period, the relative strength of VNQ versus VBINX (a balanced index fund) shows a mildly up-sloping trend but never managed to get back to the strength that it had in the early months of the move (2009) when JdK RS-Ratio peaked above 110.
Since then VNQ went back and forth between periods of out- and underperformance more or less contained in a 95-105 range on the RS-Ratio scale. Assuming that the uptrend in price can be maintained and looking at the most recent lows in the RS-Ratio line near 95, it looks like a good time to get overweight VNQ again.
VNQ - Short term
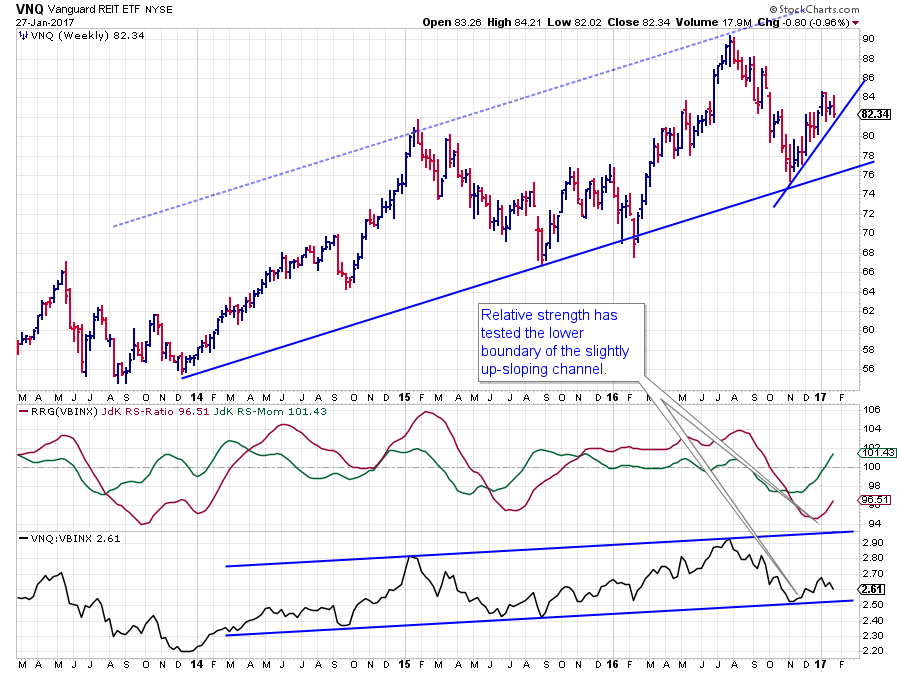 The chart above is a, zoomed in, copy of the VNQ chart above in combination with its relative strength against VBINX and the RRG-Lines showing the movements in more detail.
The slightly up-sloping channel in RS is well visible as is the low that recently formed at the lower boundary. So far the moves in the RRG-Lines (JdK RS-Ratio and JdK RS-Momentum) are heading in the positive direction at a decent speed, causing the long tail (indicates strength) and a positive heading (moving higher on both axes at the same time.
With a reading around 96 on the RS-Ratio scale, there is still a serious risk for a turn back down of the relative trend before VNQ reaches the leading quadrant.
With proper money management and close monitoring of the rising support lines on both the price and the relative charts, VNQ seems to offer good potential. Watching support near 2.50 on the RS-Line and the short-term rising support line on the price chart.
Equity / Bond ratio - SPY/IEF
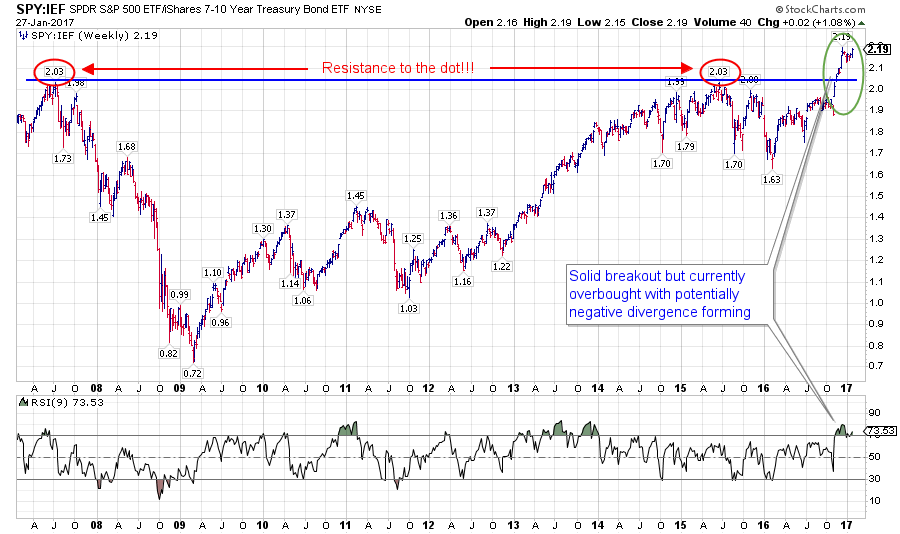 The Equity/Bond ratio is always a good gauge to keep an eye on to get a handle on the general condition of the financial markets. Risk ON or Risk OFF...
With the jump above the major horizontal resistance level in the second half of November, it is definitely Risk ON after a sideways period of more than a year.
After a good follow through rally in favor of equities, plotting a simple RSI on this SPY/IEF ratio shows that the move is getting overbought which indicates increased risk in the near term. Because of the breakout, this ratio now has enough room to maneuver without harming the longer-term positive reading.
A setback in the SPY/IEF ratio should, therefore, offer an opportunity to move from (government) bonds into equities (again)
SPY/IEF short term
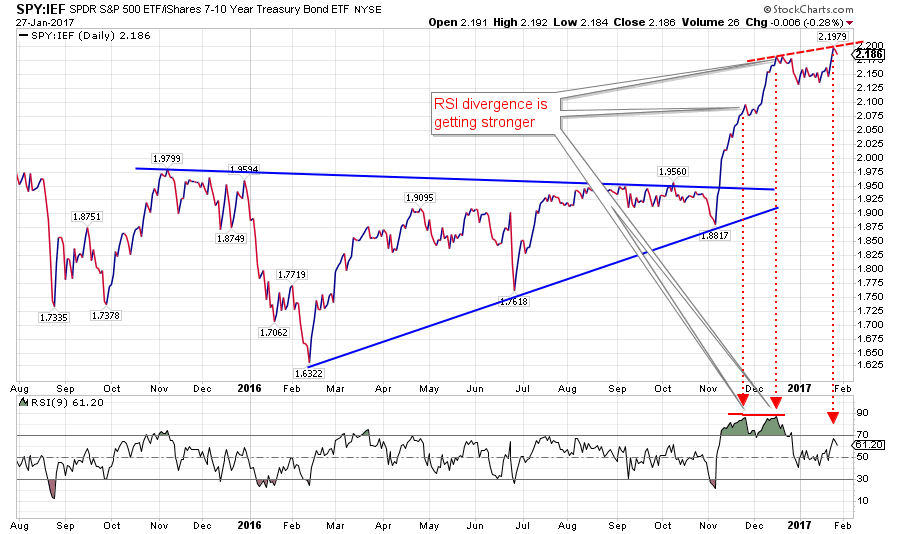 The short-term (daily) chart of the equity/bond relationship shows the overbought situation pointed out above in more detail and confirms that the move is getting overstretched.
The peaks in the RSI in November and December were at more or less the same level while the ratio itself was still moving (strongly) higher. During the most recent push to a new high, albeit only just, the RSI did not even manage to get above the 70-level. At the moment of writing this, it is only a one-day downturn so anything can happen.
If the SPY/IEF ratio sets a new high here, then a strong negative divergence will become visible suggesting that a corrective move is imminent, which confirms the takeaway from the weekly chart. Relative strength levels around 2.05 seem to be a trigger to switch (back) from bonds into equities in the near term.
The long-term outlook is still in favor of equities over bonds and suggests that the rotations of SPY and IEF will complete on either side of the (weekly) RRG.
Commodities - DJP
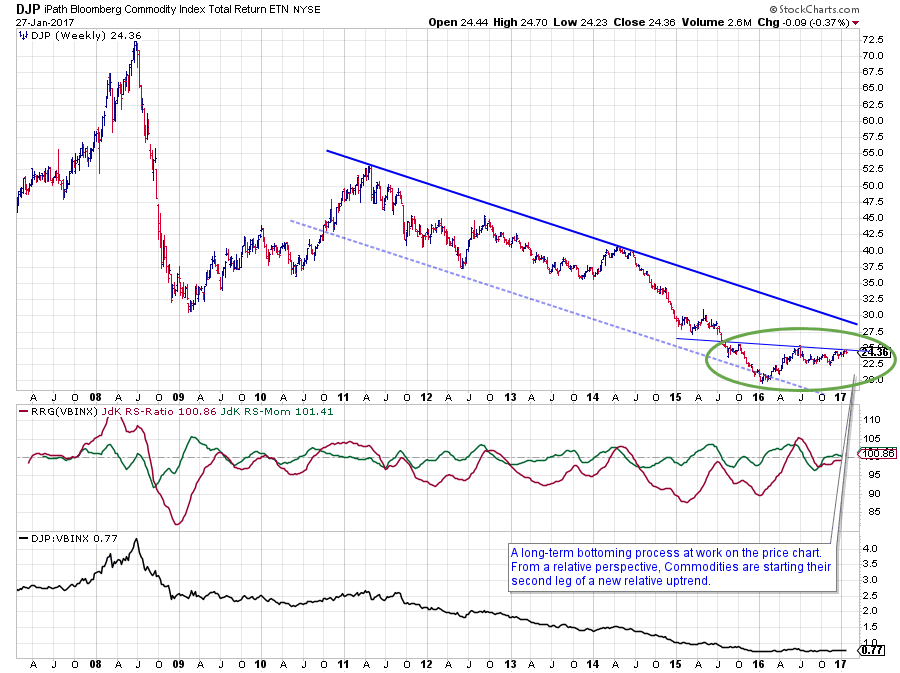 The big difference between Real Estate and Commodities is the fact that commodities are in the process of turning a multi-year downtrend around while Real Estate is shrugging off a period of underperformance while in a long-term uptrend.
This longer term process is visible in the chart above which stretches from 2007-2017. After a prolonged period of lower highs and lower lows since 2011, the last major low in DJP formed in January 2016. Since then we have seen a strong first leg higher, reaching a high around $ 25 in the summer of last, year followed by a consolidation that held up well above $ 22.50.
At the moment DJP is pushing against, the slightly down-sloping, overhead resistance around $ 25. This can cause some weakness in the next few weeks which will very likely be a good opportunity to (continue to) build up commodity positions.
As Commodities are not included in the VBINX benchmark, any allocation to DJP means an "overweight" versus that benchmark.
Commodities - short term
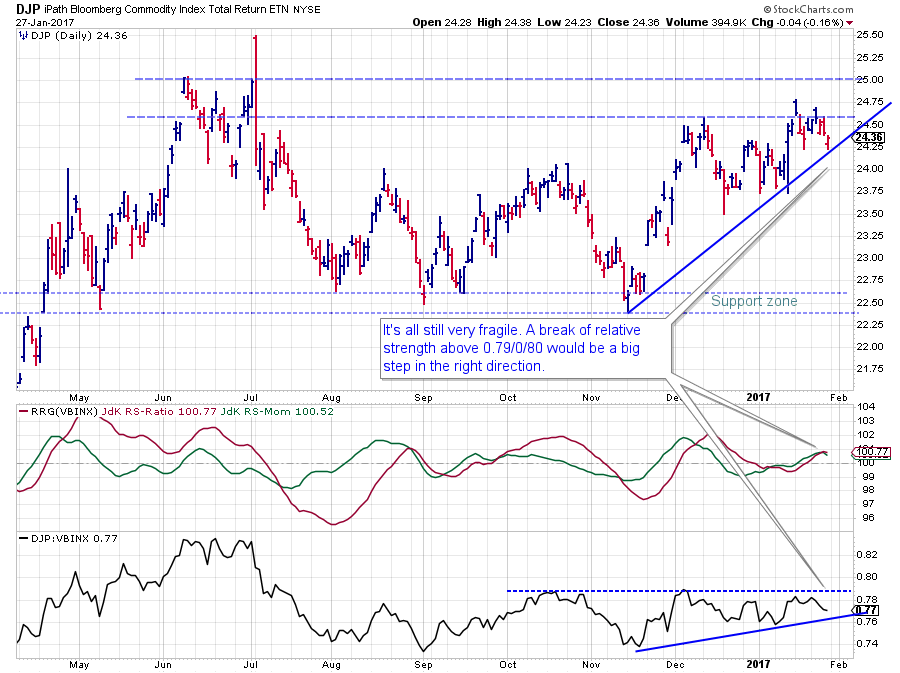 The daily chart of DJP shows the resistance zone between $ 24.50 - $ 25.00 in action as well as support offered by the rising trendline coming out of the November low. The accompanying move in relative strength since mid-November shows some higher lows but also a horizontal resistance level that caps a further rise around 0.79.
A move beyond this 0.79 barrier will very likely trigger more upside in the relative strength of commodities against VBINX.
Conclusion
All in all the big picture for asset allocation is a strong improvement for Commodities and Real Estate that is expected to continue in coming weeks.
Equities (SPY) is still strong, stronger than government bonds, but the opposite rotations for those asset classes on the RRG suggest a pull-back in the SPY/IEF ratio before continuing higher.
Julius de Kempenaer | RRG Research
RRG, Relative Rotation Graphs, JdK RS-Ratio and JdK RS-Momentum, are registered TradeMarks by RRG Research
Follow RRG Research on social media:
