Summary
- Inside Financials, money is shifting from GS & JPM to V
- AAPL turning back up towards leading quadrant, makes it leading stock in technology
- XOM and CVX confirm weak rotation for Energy sector
- Opposite rotations for DIS and WMT inside Staples sector
Quick scan
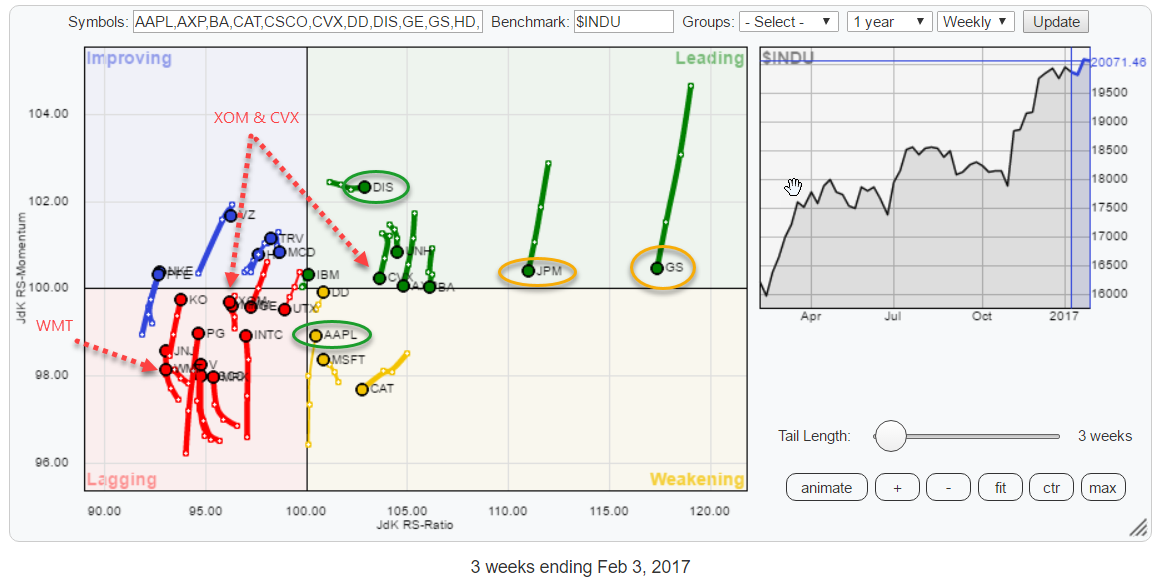
The Relative Rotation Graph above holds the 30 components of the Dow Jones Industrials Index ($INDU). The two stocks that immediately stand out are GS and JPM at very high JdK RS-Ratio levels but heading sharply down on the JdK RS-Momentum scale.
I will investigate their rotation while also looking at the other financial stocks inside this universe.
Also notable is the rotation of AAPL over the past few weeks which I will try to put into perspective with the rotation of the Technology sector as a whole.
The rotational patterns of XOM and CVX, the two energy stocks in the DJ Industrials Index are suggesting more weakness ahead.
Finally, the Consumer Discretionary sector as a whole has been moving very close to the benchmark, offering little opportunity for alpha generation. Putting the five cyclical stocks in the Dow against each other shows opposing rotations for DIS vs. WMT.
Shifting from GS & JPM to V in Financials
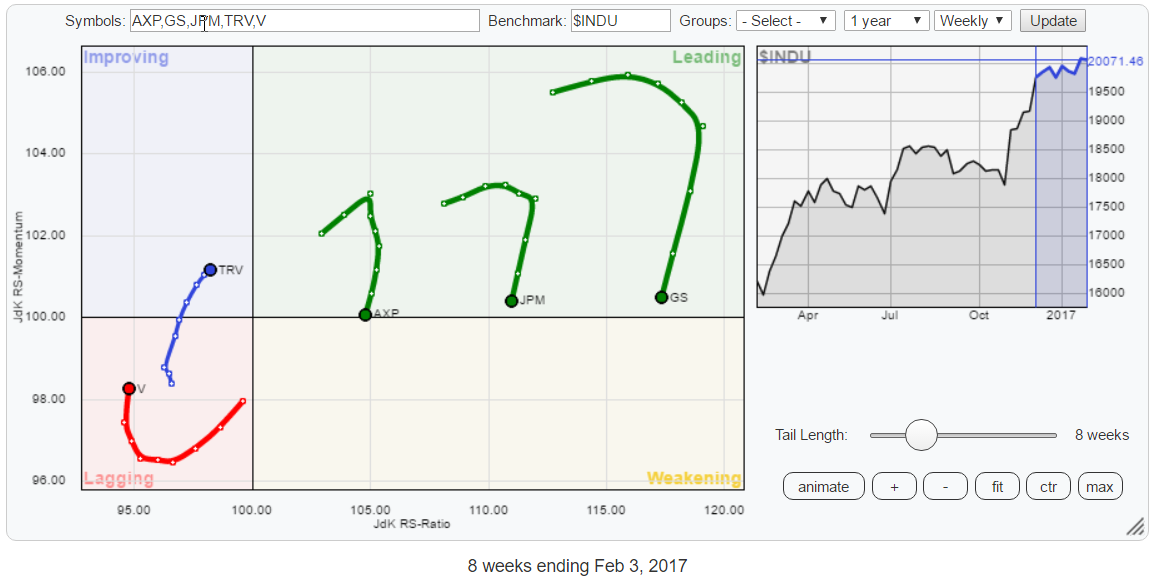 Clearly, the Financials sector has been the leading sector over the past few months. The RRG above shows the financial stocks inside the DJ Industrials Index.
Most interesting to look at are GS and JPM as they have been leading the sector, and the market, higher but are now heading lower on both axes while still inside the leading quadrant. On the other side of the RRG, inside the lagging quadrant, V shows a rotational pattern that deserves attention.
Goldman Sachs Group Inc. - GS
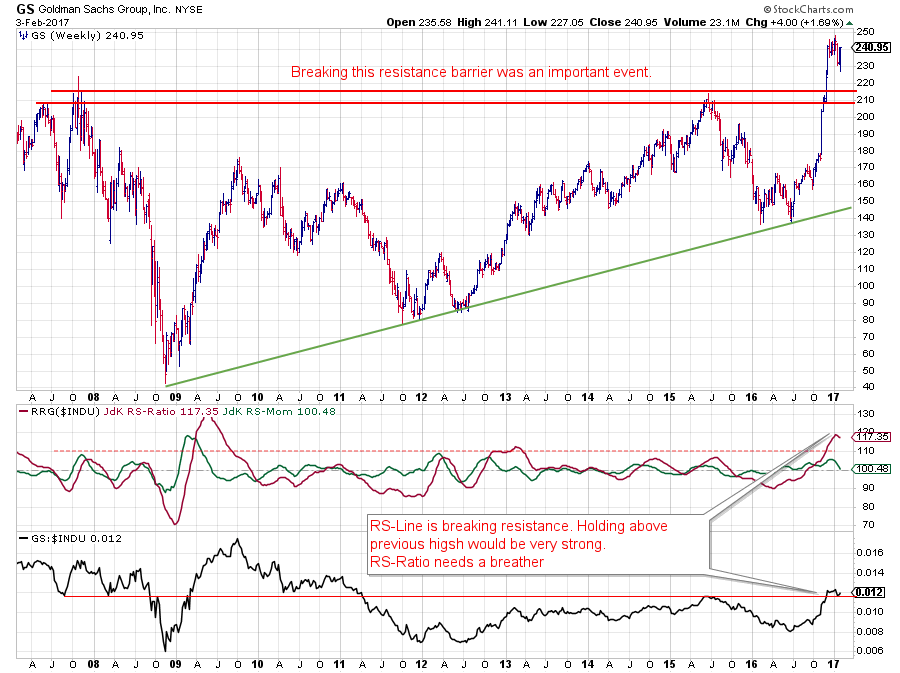 The most striking event on the chart of GS is the break above the horizontal barrier between $ 210 - 215. This was an important technical milestone for the further long-term development of this stock. And therefore, most likely, also for the financial sector as a whole.
Because of this break, the odds have now shifted in favor of GS as overhead resistance has been cleared and the old barrier ($210-215) should now start to act as support.
The move in price is now backed by a fresh break to multi-year highs in relative strength as well. The only short-term caution comes from the JdK RS-Ratio which has reached pretty extreme levels that normally warn for a, at least temporary, setback.
J.P. Morgan Chase & Co. - JPM
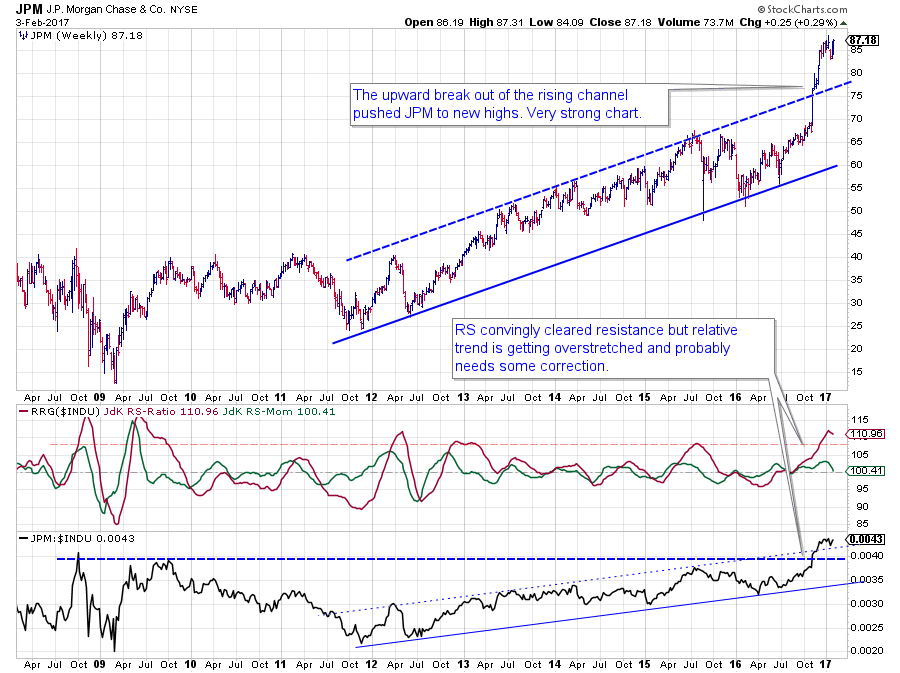 The chart of fellow financial conglomerate JPM is also looking healthy. The break, out of the already rising channel triggered an acceleration of the rally, pushing JPM to a peak near $ 88. Here also, old resistance levels are expected to provide support in case of a decline.
The same goes for the RS graph where horizontal resistance, offered by the peaks of 2008 and 2009, was taken out and this level can now start to act as a jumping board when the market takes a pause to digest the recent upward power.
Visa Inc. - V
Opposite of GS and JPM in the leading quadrant is V inside the lagging quadrant. And interestingly enough where the tails of G and JPM are heading down, V's tail is pointing upward, heading towards the improving quadrant.
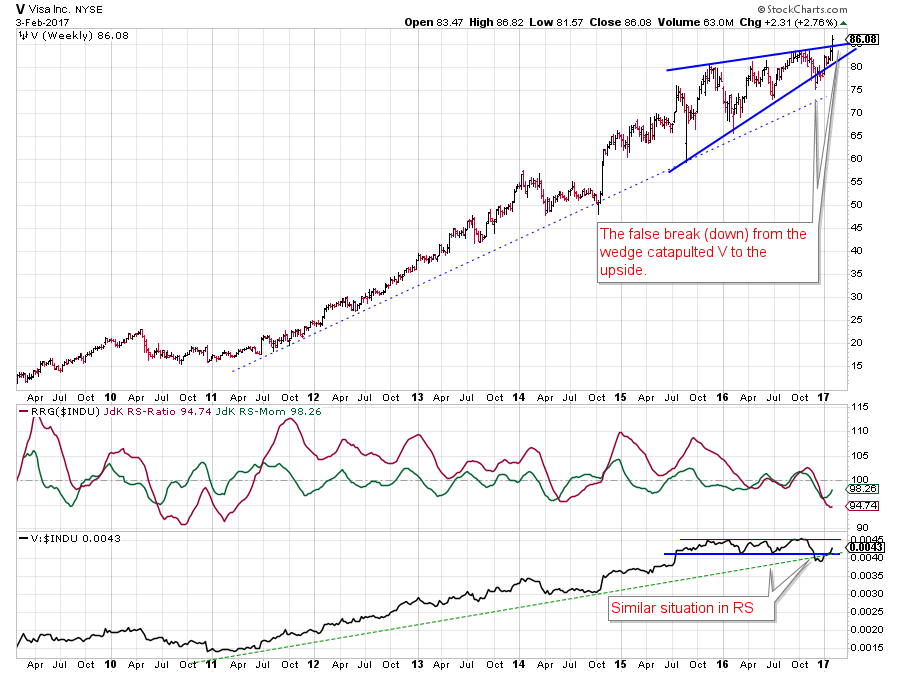
So from a relative point of view, with the sector in a temporary setback, Visa seems to be picking up pace now. The price chart shows an interesting picture as well. A few weeks ago, I labeled the 2016 pattern for V as a big rising wedge, which would have negative implications when broken downward.
The downward break came, but the expected follow-through did not. And what we see very often with patterns that fail, or show a false break, is a sharp reversal the other way. This also happened with V after dipping at $ 75 the price jumped back up and even pushed beyond the slightly up-sloping resistance line. An undeniably strong move.
The relative chart shows a similar pattern. In sync with the downward break in price, the RS line broke out of a sideways pattern. Just like the reversal in price, the RS-Line came back into the trading range causing the RS-Momentum line to start curling upward.
For the time being, V seems to be in better shape than its peers G and JPM.
AAPL starting to lead the Information Technology sector again
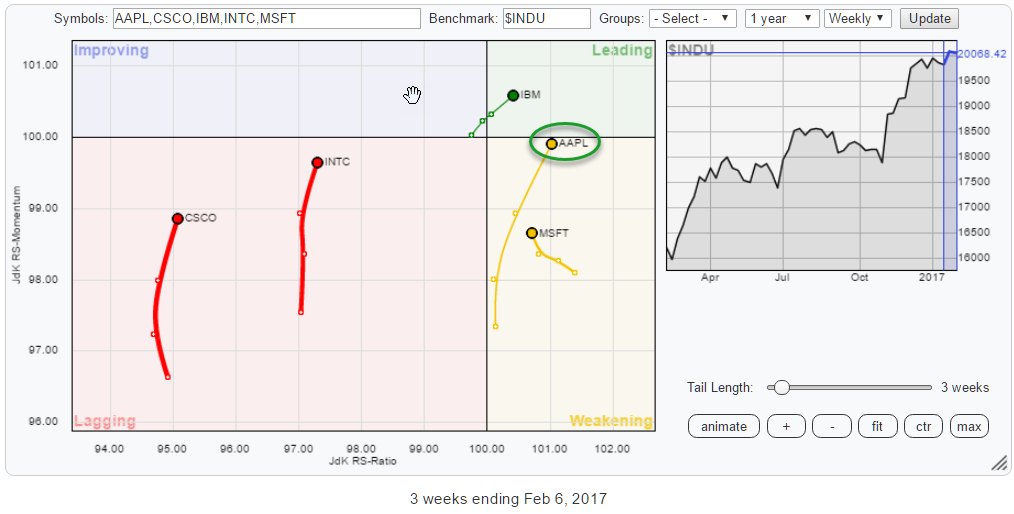
The RRG holds all technology stocks inside the DJ Industrials Index. ALL are moving higher on both scales, and only MSFT is still losing ground on the RS-Ratio axis but seems to be turning around as well.
This indicates strength for technology inside this universe. And we can see the strong move for AAPL on this RRG shaving the 100-level on the RS-Ratio scale but turning back to a positive heading while backed by a long tail.
It looks like AAPL is ready to pick up its leading role in the tech sector again.
Apple Inc - AAPL
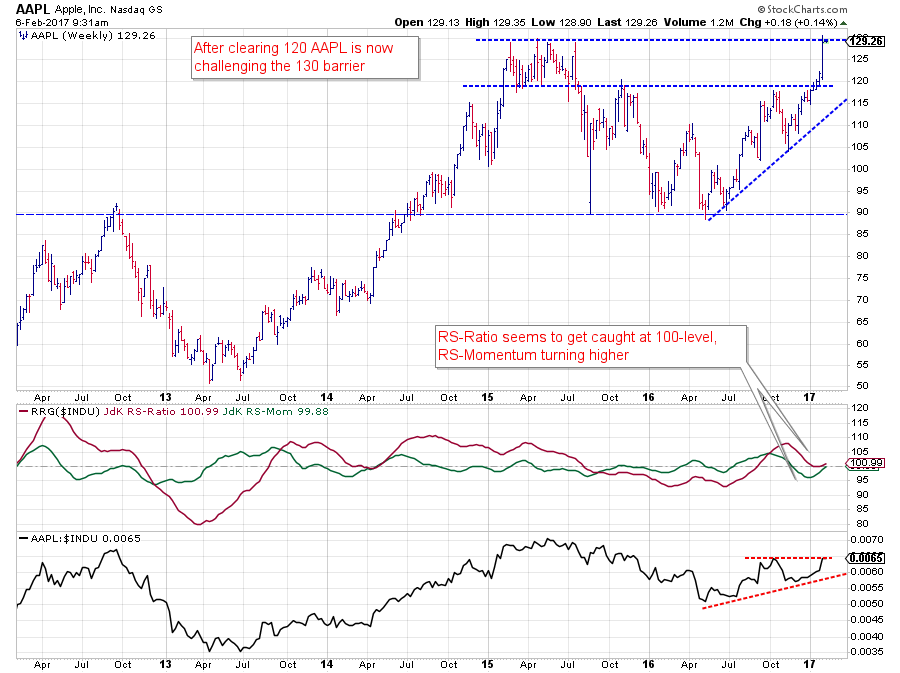
At the end of last year, AAPL struggled with resistance near $ 120 for a few weeks. The break finally materialized in the early days of this year, and last week the stock jumped sharply to its next significant resistance level around $ 130.
The improvement in price has caused the RS-line to form a higher low and pushed it to its October highs. The derived RRG-Lines have also turned higher, and the JdK RS-Ratio line has just managed to stay above the important 100-level and is now starting to turn back up again.
This sort of rotation is known to be positive as it means that the second leg of an already rising trend seems to be setting off.
Energy sector rotating into weakening
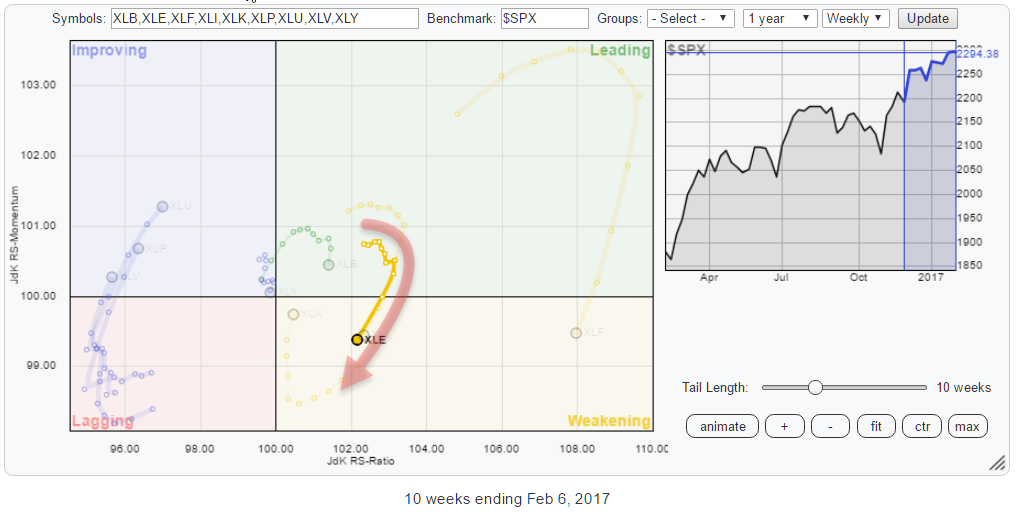
The XLE sector ETF shows a rotation into the weakening quadrant. And although the trajectory of the rotation is quite similar to the rotation in Financials, the rotation of XLE is taking place much closer to the benchmark, and therefore closer to the 100-level on the RS-Ratio axis. XLE is therefore considered to be a (much) riskier sector than XLF at the moment.
The two energy stocks inside $INDU are confirming this sector rotation.
Exxon Mobil Corp - XOM
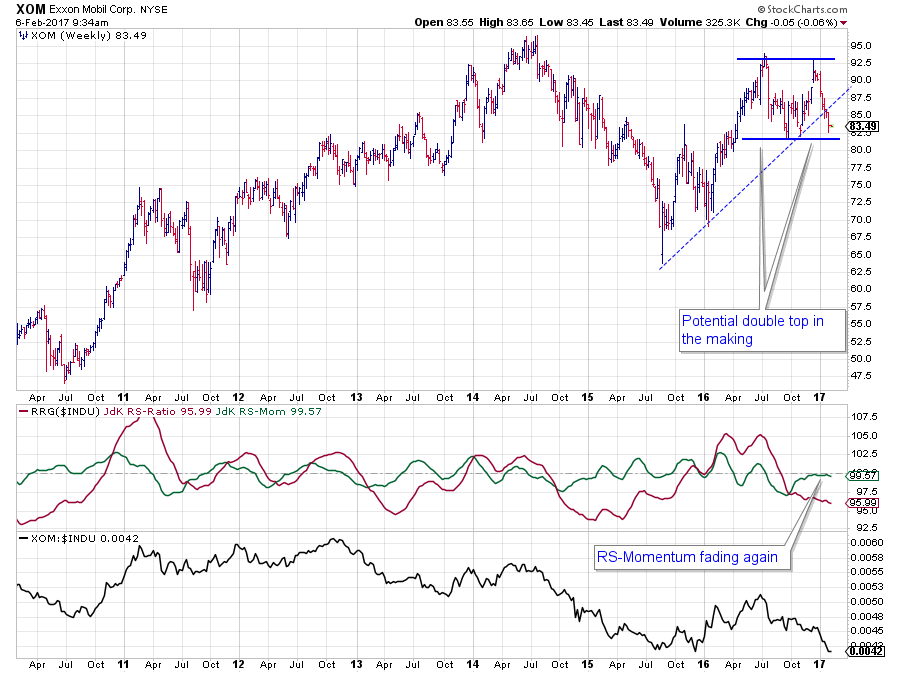 At the end of 2016, XOM tested resistance around $ 92.50 coming off the peak set in July.
The sharp move down out of this peak broke the rising trendline and is now coming close to a test of support near $ 82.
Breaking $ 82, completes a large double top pattern, creating roughly ten dollar downward risk.
The relative charts for XOM already started to weaken over the summer when RS-Ratio crossed below 100 and continued to head lower. The recent pull-back of RS-Momentum towards the 100-line has only managed to change the rate of descend for the JdK RS-ratio line, but it has not managed to turn it around.
With RS-Momentum starting to curl down from the 100-line, it seems that a renewed period of relative weakness lies ahead for XOM.
Chevron Corp. CVX
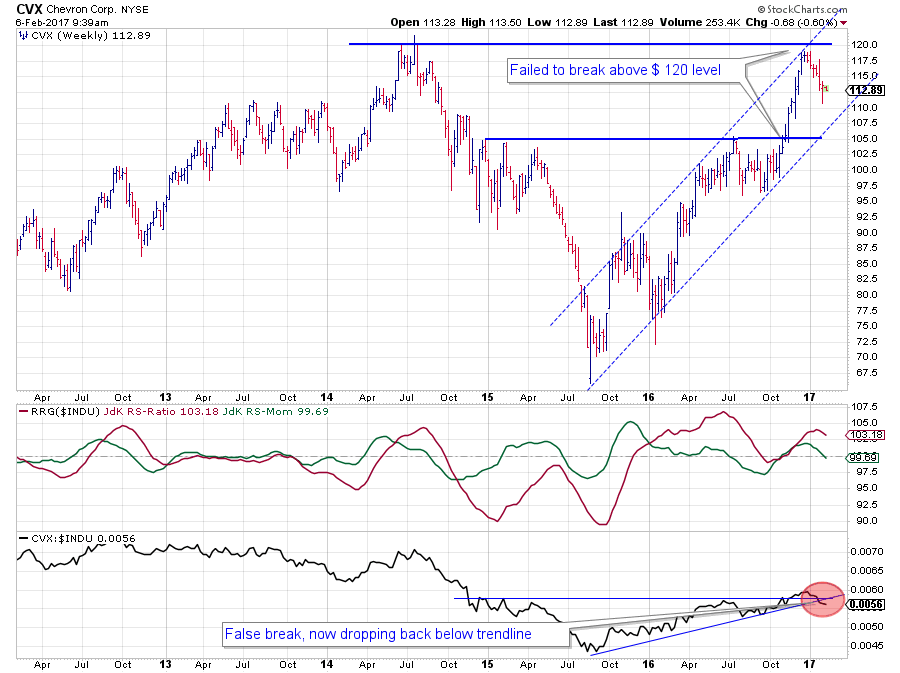
The overall picture for CVX is better than for XOM. The stock is still trading inside the boundaries of a rising channel, and the rhythm of higher highs and higher lows is still intact.
At the moment CVX is working its way down from a test of resistance around $120. It will be interesting to see if it can remain inside its rising channel, or at the minimum above $ 105, the level of its previous highs that should act as support going forward.
The relative uptrend of CVX against $INDU is starting to show some cracks. Although RS-ratio is still around 103, its momentum is declining and crossing below 100 while the raw RS-Line broke below its rising trendline.
For the time being money seems to be moving out of the energy sector and the rotations of XOM and CVX against the DJ Industrials Index are confirming that outlook.
Big differences inside Consumer Staples sector
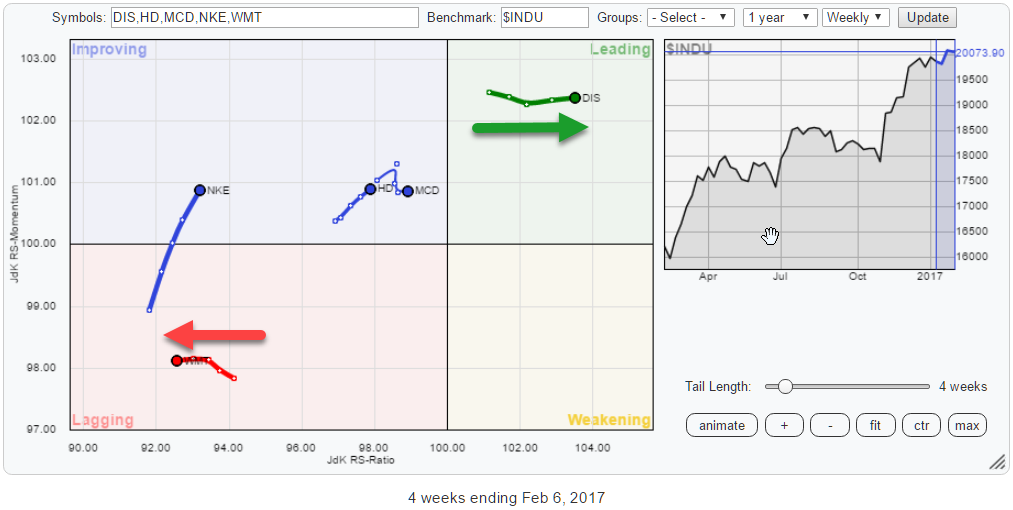
When I single out the cyclical (Consumer Discretionary) stocks from $INDU, I get the RRG above. Unlike the RRG for tech stocks, for example, we do not see a common denominator with regard to trend here.
The relationship that draws my attention most is DIS against WMT because they are moving exactly opposite and, given the difference in RS-Ratio reading, it is a pretty strong trend as well.
Wal-Mart Stores Inc. - WMT
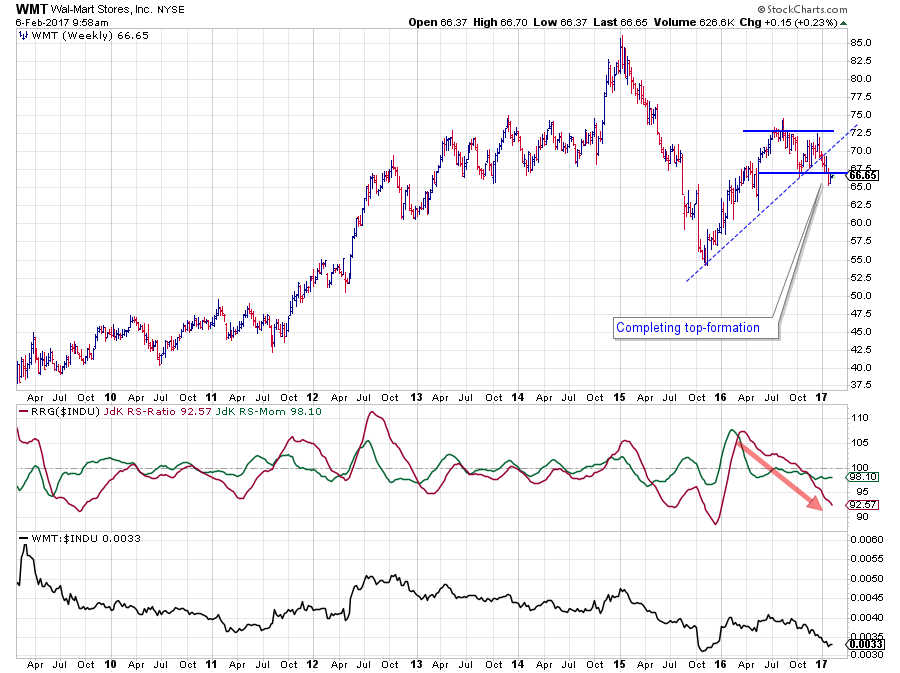 WMT is pushing deeper into the lagging quadrant, and the chart above shows you why.
Relative Strength of WMT against $INDU managed to keep up well during the first half of 2016 but finally had to give way when RS-Ratio dropped below 100. The almost horizontal level in RS-Momentum indicates that there is not MUCH momentum behind the move but it is very STABLE and it continues to push the relative line lower.
The result is an almost straight line for RS-Ratio pointing lower since April 2016 with no improvement in sight.
The recent weakness in the price chart is adding to the negative powers for WMT. In the early days of 2017, WMT broke its rising support line and very recently the stock completed a top pattern by breaking below support near $ 67.50.
There is now plenty of downside risk in terms of price with only limited upward potential while relative strength still has enough room to move lower and push WMT deeper into the lagging quadrant.
Walt Disney Co. - DIS
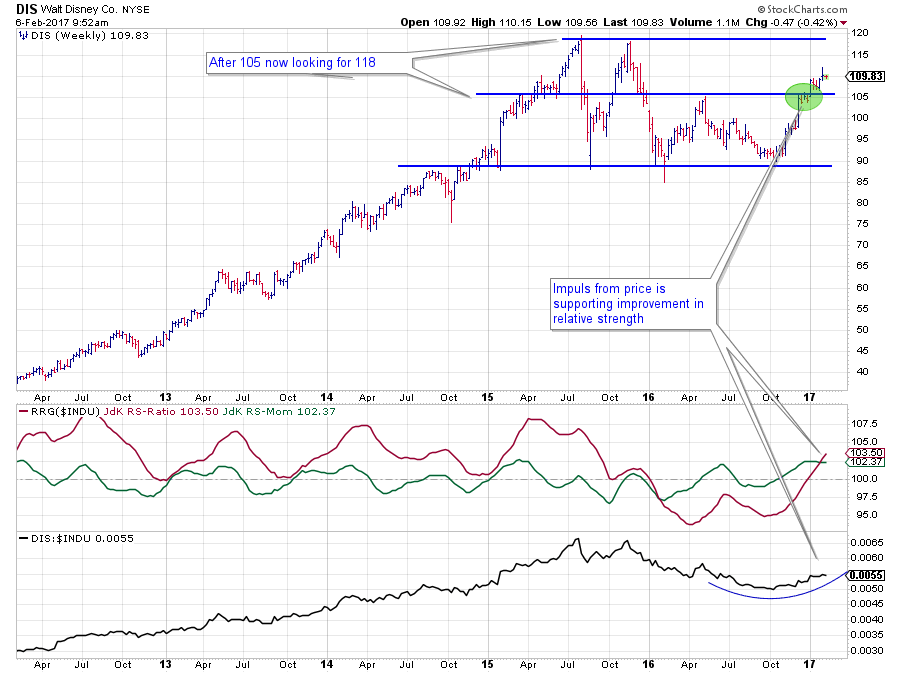
Inside the same sector but showing an almost opposite picture is Disney.
The RS-Line is curling upward already since October last year and slowly continues to work its way higher. This translates into both RRG-Lines to move above 100, positioning DIS inside the leading quadrant.
The recent break above resistance near $ 105 is supportive for further improvement in relative strength as well. The next resistance level in price is only found around $ 118 which means that there is still plenty of upside potential for price as well as relative strength.
Julius de Kempenaer | RRG Research
RRG, Relative Rotation Graphs, JdK RS-Ratio and JdK RS-Momentum are registered TradeMarks by RRG Research
Follow RRG Research on social media:
