RRG Charts March 21, 2017 at 07:47 AM
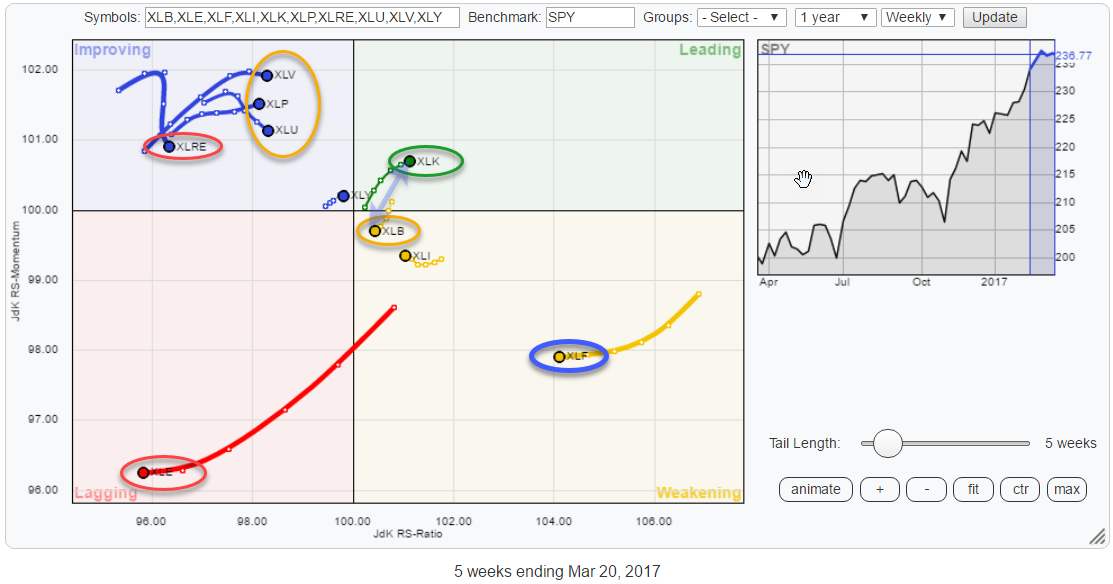
This post looks at the rotation of US sectors again. The Relative Rotation Graph above holds the ETFs that track the performance of US sectors... Read More
RRG Charts March 14, 2017 at 06:53 AM
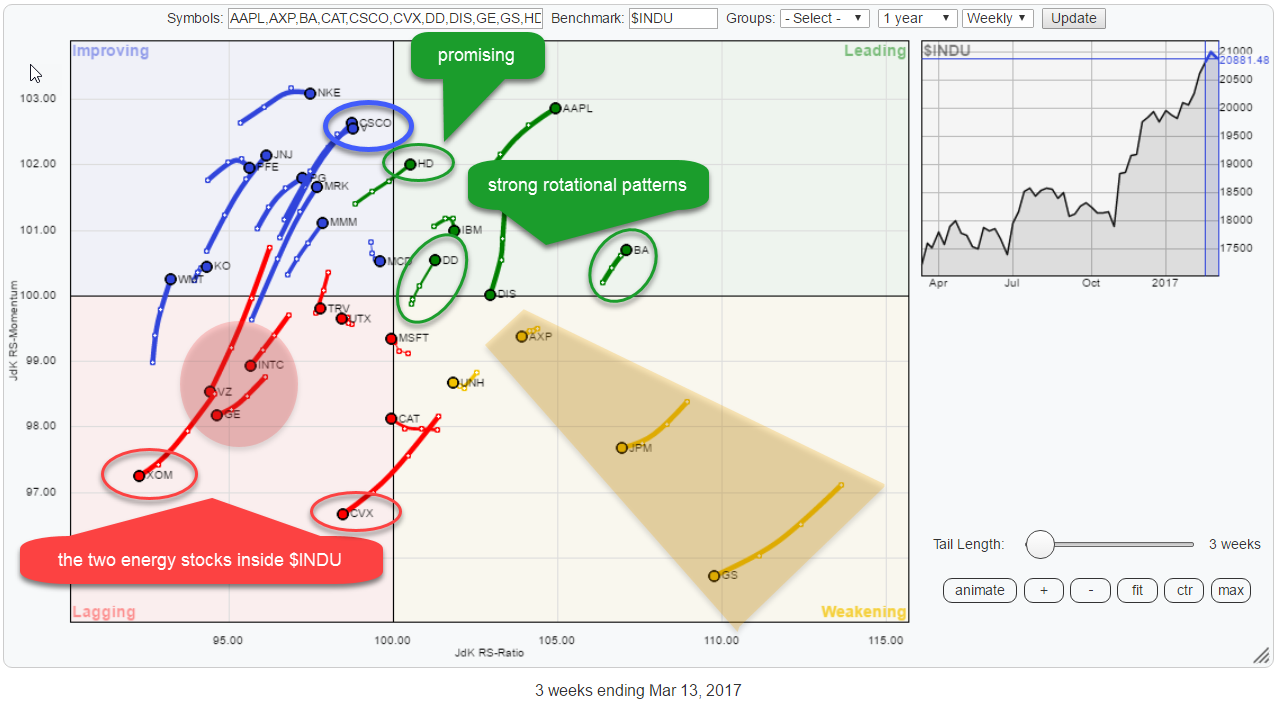
... And they both show very weak rotations on the Relative Rotation Graph of the DJ Industrials components. XOM rotated negatively while inside the lagging quadrant and CVX just crossed over into the lowe-left part coming from weakening... Read More
RRG Charts March 07, 2017 at 01:05 PM
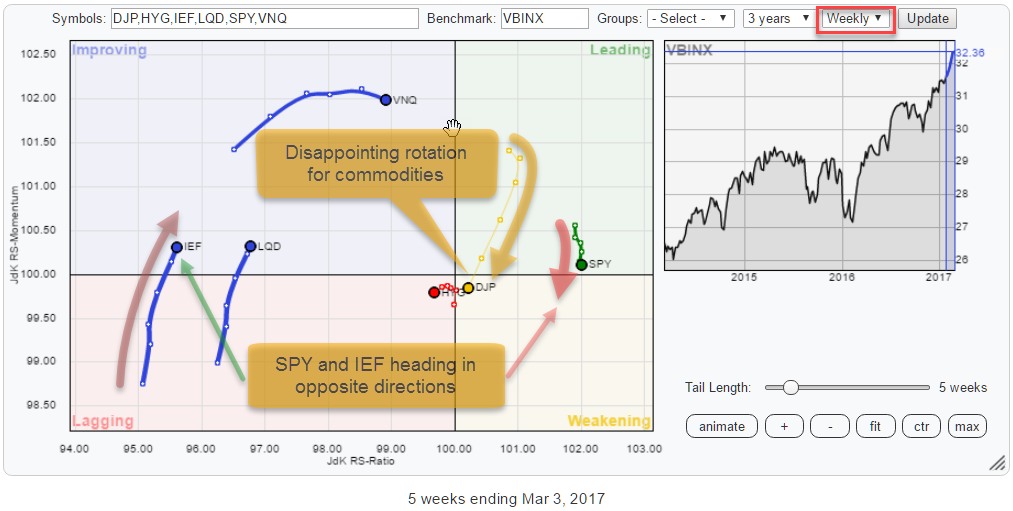
Summary Opposite rotations for Equities and Bonds on both weekly and daily RRGs Rapid weakening of commodities over past six weeks Current positioning of SPY suggests some short-term weakness before resuming trend IEF in consolidation pattern after breaking long-term uptrend Doub... Read More