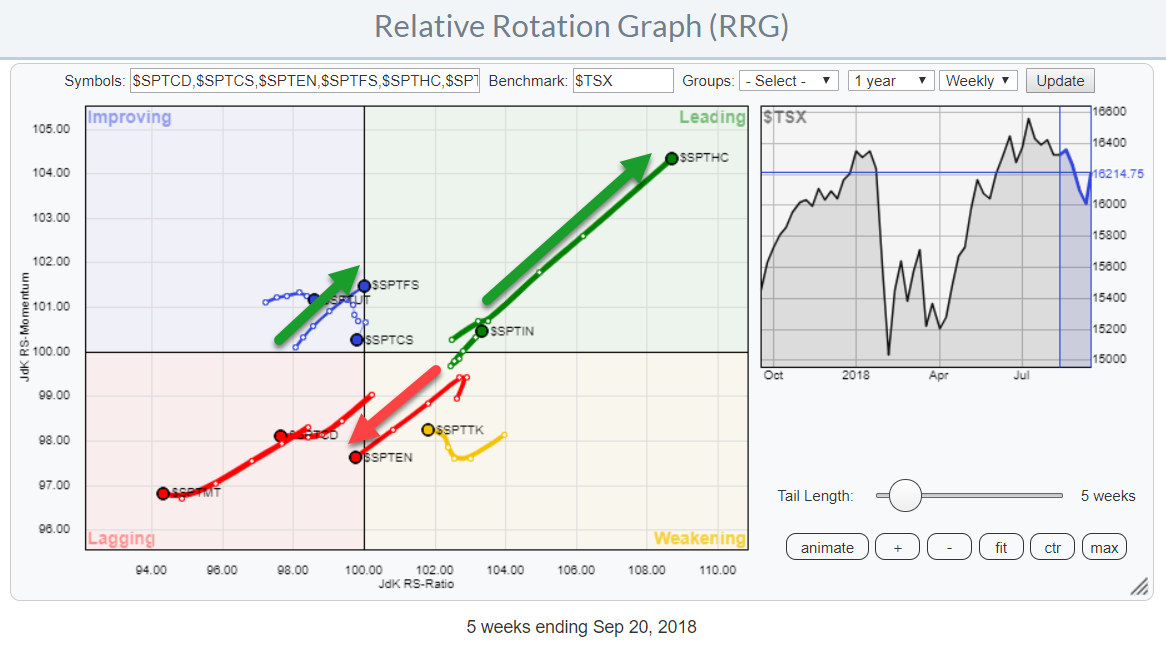
 The Relative Rotation Graph for Canadian sectors is showing a very distinct move for the Healthcare sector. It is inside the leading quadrant and powering further into it at a strong RRG-Heading at a very long tail. All ingredients for more strength ahead and worth a closer look on a regular chart.
Two other sectors that are worth investigating are the Energy sector and the Financial Services sector. The latter is on the verge of crossing over from the improving quadrant into leading while Energy just crossed over from weakening to lagging.
Summary
- Healthcare gunning for old high near $ 155
- Underperformance expected for Energy as it crosses from weakening to lagging
- Financial Services is offering opportunities on the move into leading
RRG Heading
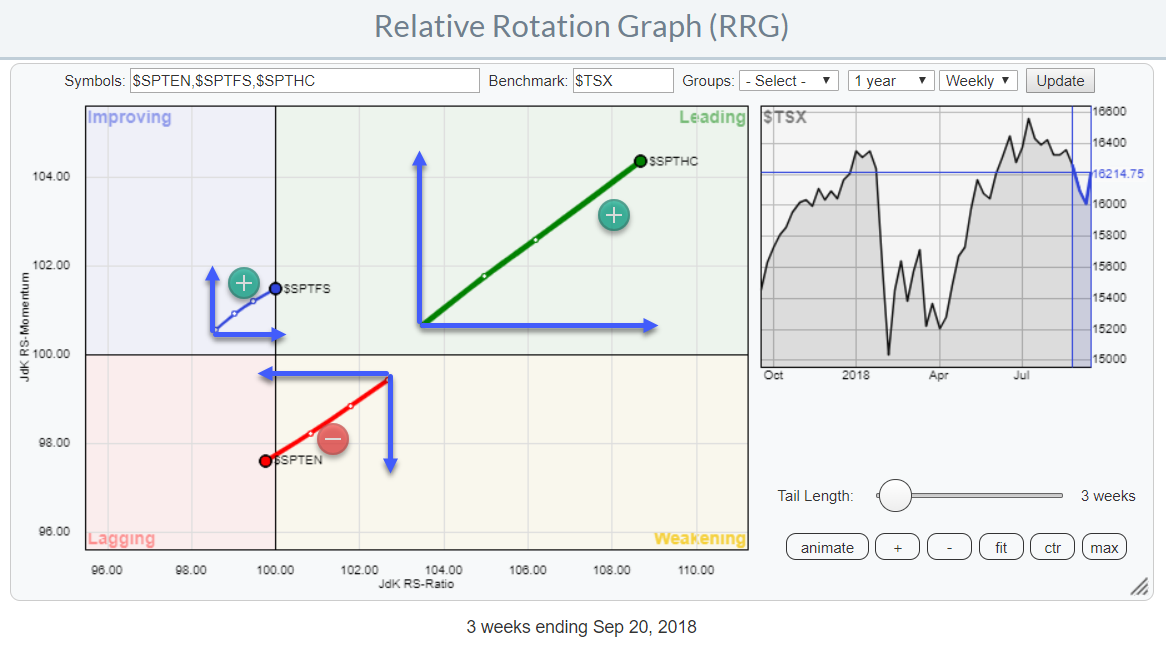
RRG Heading looks at the vector of the tails on a Relative Rotation Graph and is expressed in degrees (like on a compass).
In the zoomed in RRG above I have isolated the three sectors mentioned in the introduction as being worth a closer look. The RRG-Heading is usually measured "from" the previous observation "to" the most current. In the illustration above it is done over a period of three weeks which indicates the strength of the moves for these sectors.
S&P/TSX Capped Energy Index
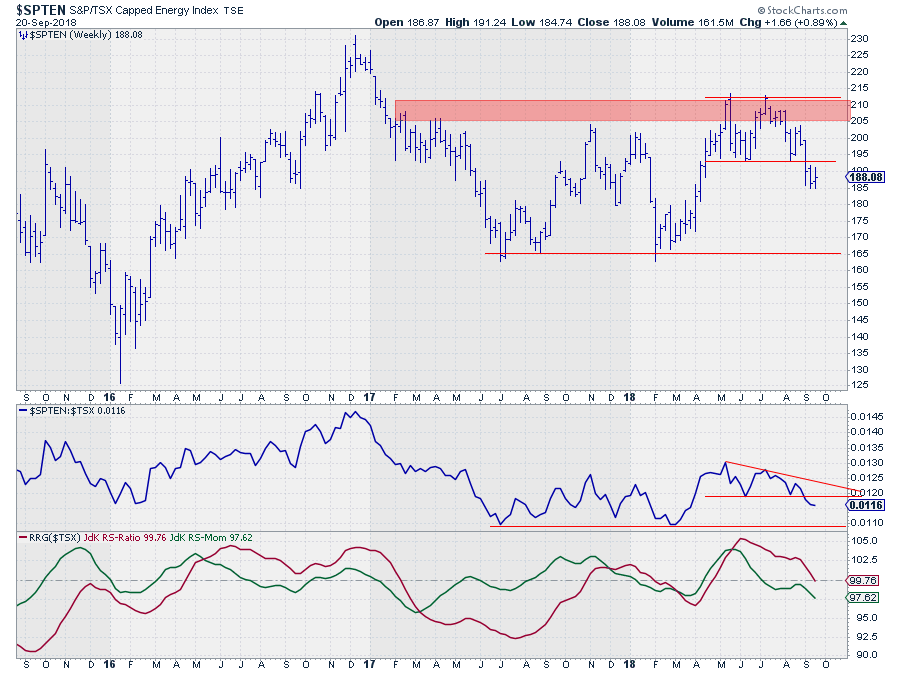 On the price chart, the Energy sector just broke below support after testing the resistance area between $ 205-210. This means that upside potential is now capped at this former support level while the downside is open towards the lower boundary of that range near $ 165.
The relative picture is showing, more and more, weakness as well. The RRG-Lines picked up the potential beginning of an uptrend in relative strength in April when they both rose above the 100-level but no meaningful follow up materialized and the raw RS-Line started moving sideways eventually forming something that looks like a descending triangle.
The downward break out of that pattern definitely has negative implications for relative strength and it seems to be the trigger for a decline of both RRG-Lines below 100, pushing Energy into the lagging quadrant on the Relative Rotation Graph.
There is horizontal support on the relative chart at the level of the previous lows from mid-2017 and early-2018. However, be careful, as the saying
"don't confuse the bottom of the chart with support"
could become reality here. A break below this level will very likely trigger much more relative weakness.
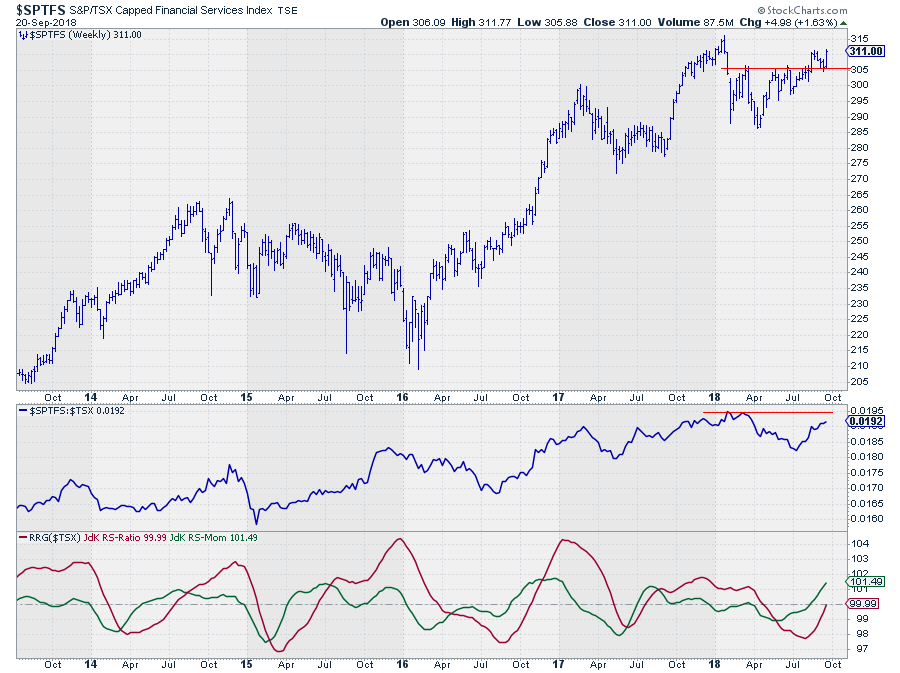
S&P/TSX Capped Financial Services Index
If you are running a portfolio and are looking to move/trade in- and out of sectors or apply some over- underweight strategy against the benchmark weights, it makes sense to watch for sectors that are moving in opposite directions on the RRG.
With the Energy sector heading from weakening into lagging the search will then focus on another sector that is just about to crossover from improving to leading. It does not happen always but on the zoomed in RRG above shows a pretty good example as the Financial Services sector is just crossing over from Improving to leading.
Hence a switch from Energy into Financial Services seems to make sense.
The only caveat is the fact that Energy is still below important resistance levels on both the price- and relative- charts. Once these levels can be cleared a strong(er) advance for Financials can be expected,
The RRG-Lines seem to be anticipating such a break as they are both rising rapidly with JdK RS-Momentum already well above 100 and RS-Ratio following suit.
S&P/TSX Capped Healthcare Index
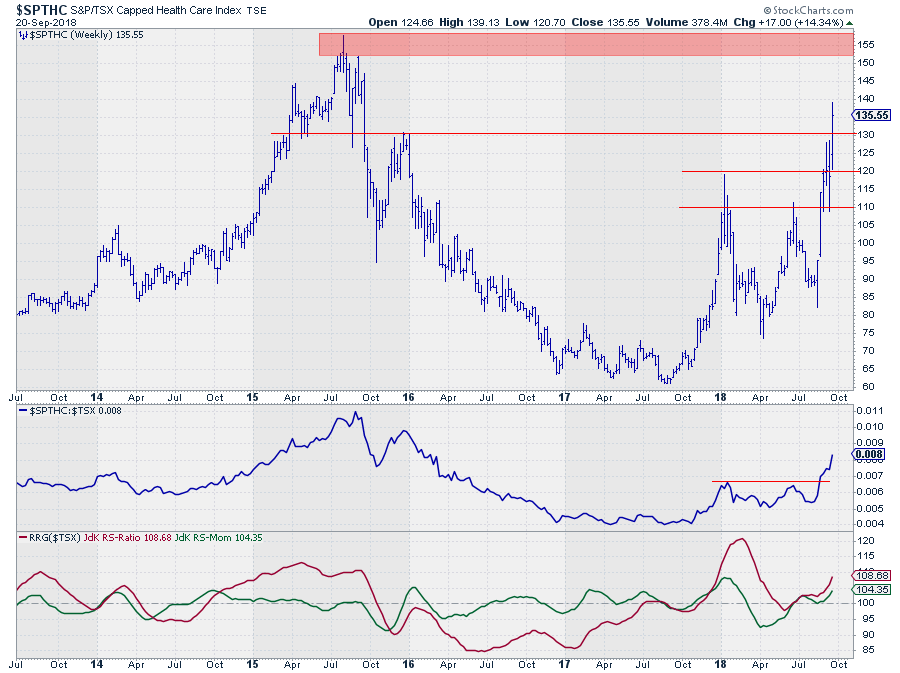
As indicated in the introduction, the Healthcare sector is powering further into the leading quadrant at a strong RRG-Heading and a long tail. These are ingredients that point to a further improvement in coming weeks.
The chart above seems to be confirming this outlook. So far, 2018 was characterized by some wide swings in the Healthcare sector but in the last few weeks, the market seems to have made a decision as it broke three subsequent horizontal resistance levels in a row.
The last hurdle was near $ 130 which was cleared this week and unless we get a sharp reversal today we will have a close above that barrier at the close of the week. If that happens, and I am assuming it will, that former resistance level will then become support which means that downside risk will be limited while the next resistance level, and the target for the current move is only found around $ 155.
The relative chart improved a couple of weeks ago when RS broke above its previous two highs which cleared the way for further relative improvement and that move is now well underway.
Both RRG-Lines are now comfortably above the 100-level and continuing to rise which results in the aforementioned push further into the leading quadrant.
Let me know what you think of this usage of RRG in the comments below. If you would like to receive a notification when a new RRG blog article is published, simply "Subscribe" with your email address.
Julius de Kempenaer | RRG Research
RRG, Relative Rotation Graphs, JdK RS-Ratio, and JdK RS-Momentum are registered TradeMarks ®; of RRG Research
Follow RRG Research on social media:
If you want to discuss RRG with me on SCAN, please use my handle Julius_RRG so that I will get a notification.
