 In this blog post, I want to do a quick top-down analysis to arrive at a few stocks that could help investors to provide shelter in case the current hiccup in the market is ..... well a "hiccup."
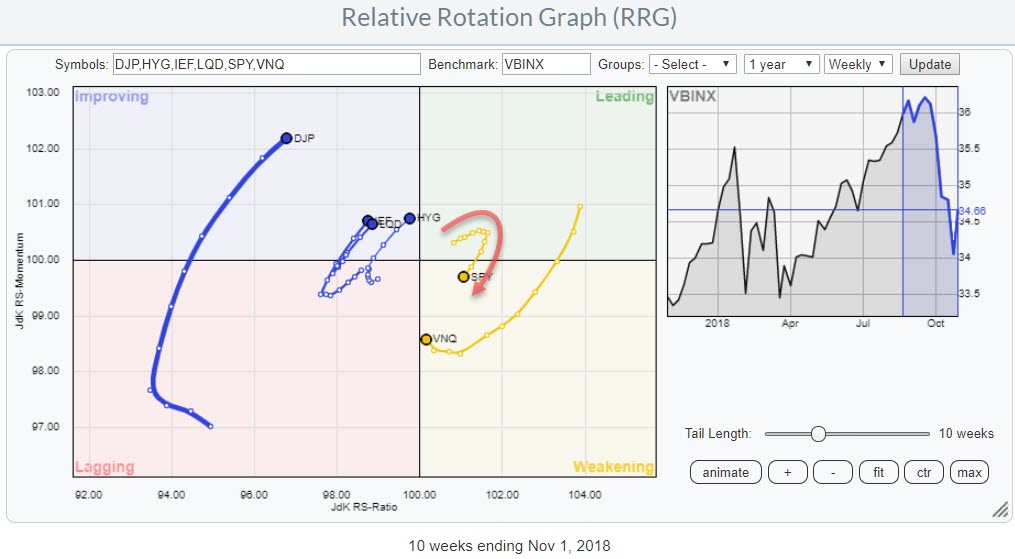
The Relative Rotation Graph above shows the rotation of various asset classes around a balanced benchmark portfolio (VBINX).
The quick observations that we can make from this picture are that the cluster of fixed income related asset classes is, still, moving inside the improving quadrant and close, to crossing over, to the leading quadrant.
Equities (SPY) on the other hand rotated out of leading into weakening and is now heading towards the lagging quadrant.
The outlier on this graph is DJP (commodities) which is showing a very long tail relative to the other asset classes. this means that there is or has been a lot of power behind the recent (up)move. The question here is if there is still enough relative momentum left to continue the rotation towards and into the leading quadrant. DJP is the lowest ranked asset class based on Jdk RS-Ratio and has a good chance of rolling over back towards lagging before being able to hit the leading quadrant.
All in all, IMHO, this rotational picture is sending a risk-off message.
Summary
- Asset class rotation is sending a "risk-off" message for stocks.
- Current sector rotation also suggests a "risk-off" approach.
- HML breaking above resistance while rotating back into leading from weakening.
- PG jumping back to a strong RRG-Heading; ideally needs to break above overhead resistance near $ 90.
From a sector perspective
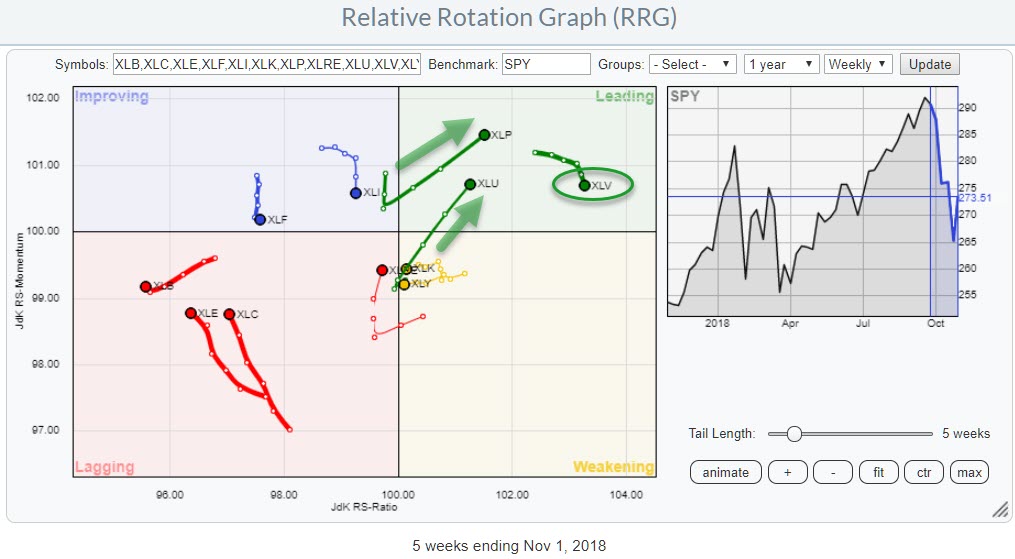 Breaking down the equity part of the asset allocation pyramid into sectors gives us the Relative Rotation Graph above which shows the rotation of the 11 SPDR sector ETFs around SPY.
The leading quadrant is populated with sectors that are considered "defensive". These are Consumer Staples (XLP), Utilities (XLU) and Health Care (XLV).
The Health Care sector has received a lot of attention recently as it was leading the market higher since July, pushing the sector deep into the leading quadrant on the RRG chart. Measured on the Jdk RS-Ratio axis, Health Care is still the strongest sector but it is rolling over towards weakening.
Given the high RS-ratio reading and the position on the RRG, this could well be a temporary rotation from leading into weakening and then back to leading.
Over the past three months, Staples (XLP) and Utilities (XLU) have popped up as the sectors leading the market on a relative basis. See PerfChart below.
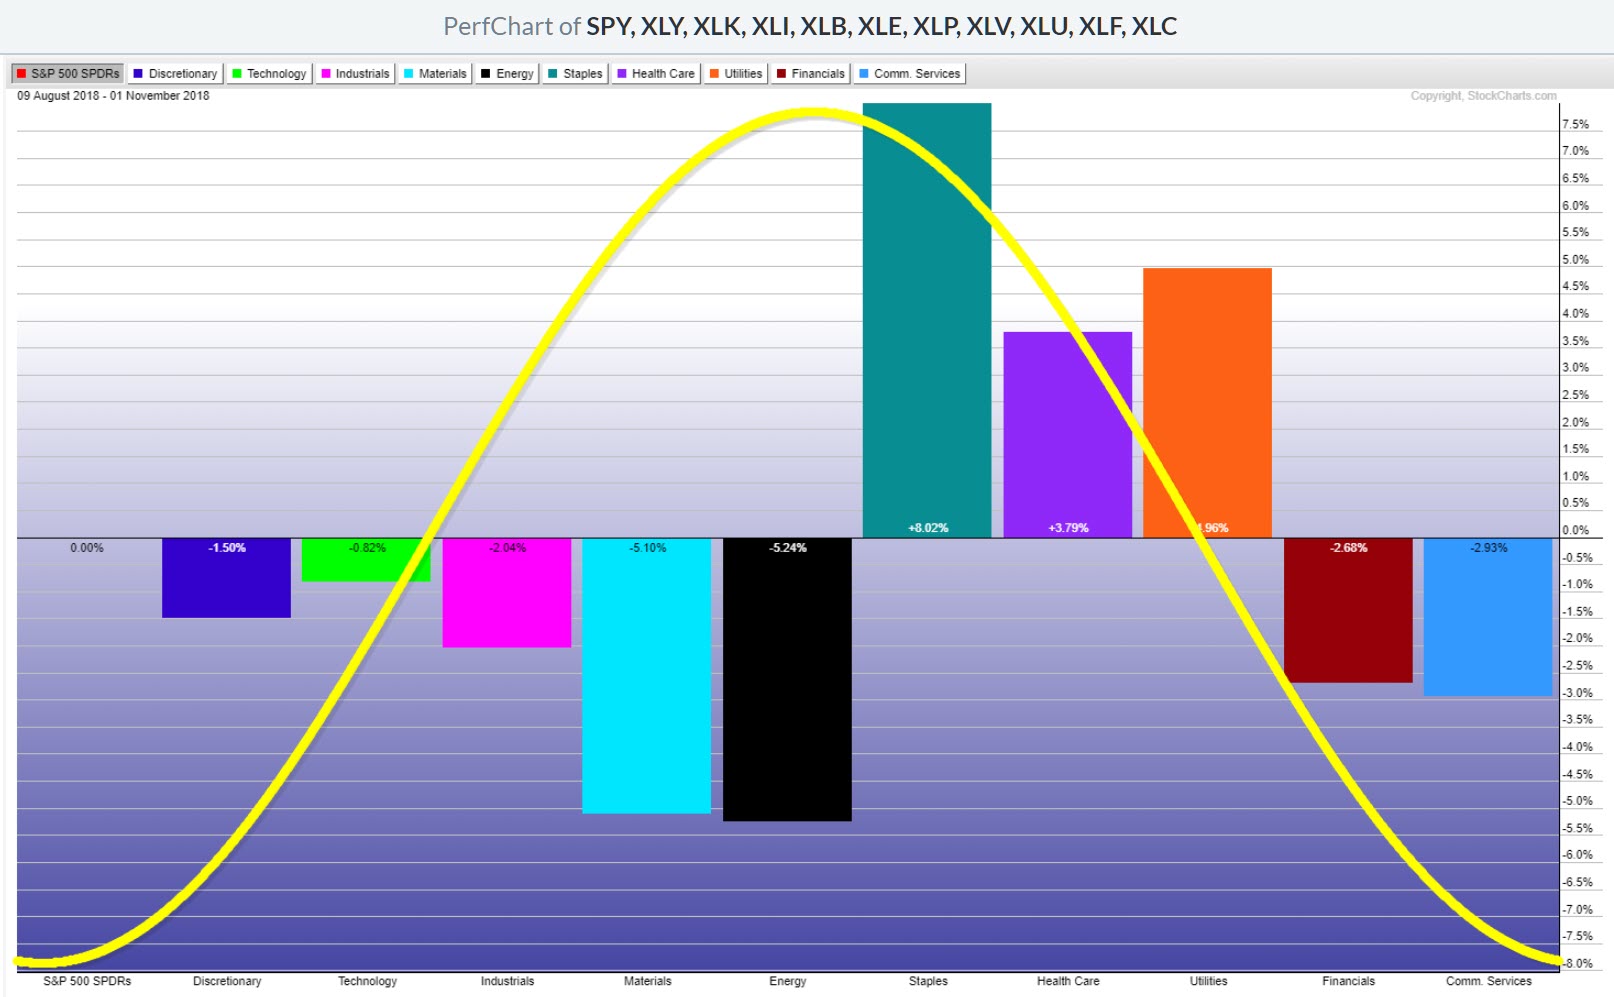 Note that the order of the sectors is as it is used in the sector rotation model and the fact that these sectors, together with Health Care are the sectors expected to outperform the market after a market top has been put into place and the economic cycle is reaching or has already reached a full recovery.
These moves are pushing Staples and Utilities firmly into the leading quadrant on the Relative Rotation Graph at a positive RRG-heading while the length of the tail is increasing. These are positive signs.
With these sectors outperforming the market and pushing deeper into the leading quadrant the market is, here also, sending a "Risk Off" message.
Inside Consumer Staples
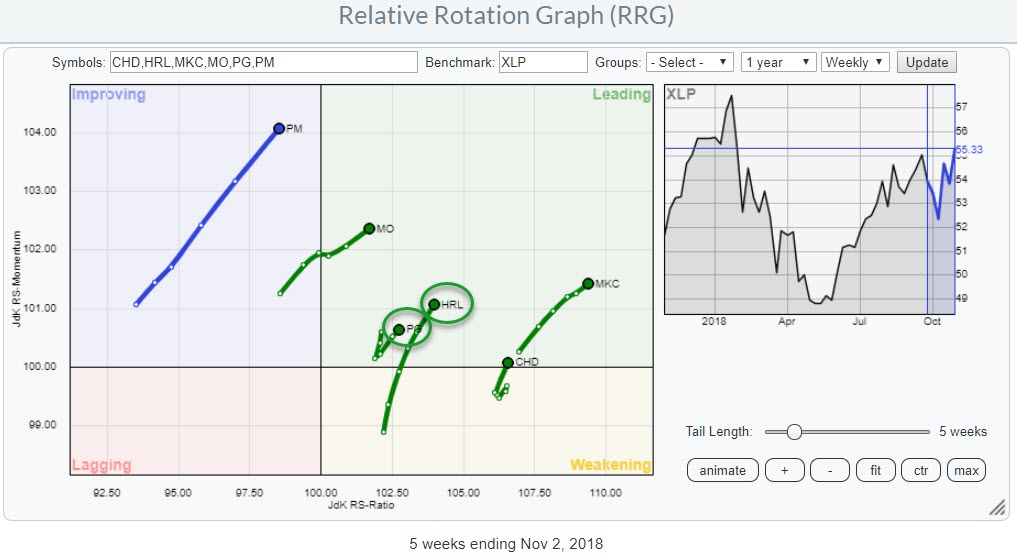 The RRG above shows only a selection of the members of XLP to make the chart more readable. I have identified these tickers as potentially interesting while browsing through this universe.
PM looks ok-ish but looks to be running into a falling resistance line on both the price and the relative charts.
MO broke above resistance in the relative strength graph which pushed the stock into the leading quadrant. On the price chart, it needs to take out the falling resistance line to become really attractive.
CHD is a very strong chart that went through a leading-weakening-leading sequence remaining very strong but from a price perspective probably too late to jump on board now.
MKC is probably the strongest stock in this sector. Definitely, one to hang on to but from a risk/reward perspective too late to pick up at this point in time.
Hormel Foods Corp. - HRL
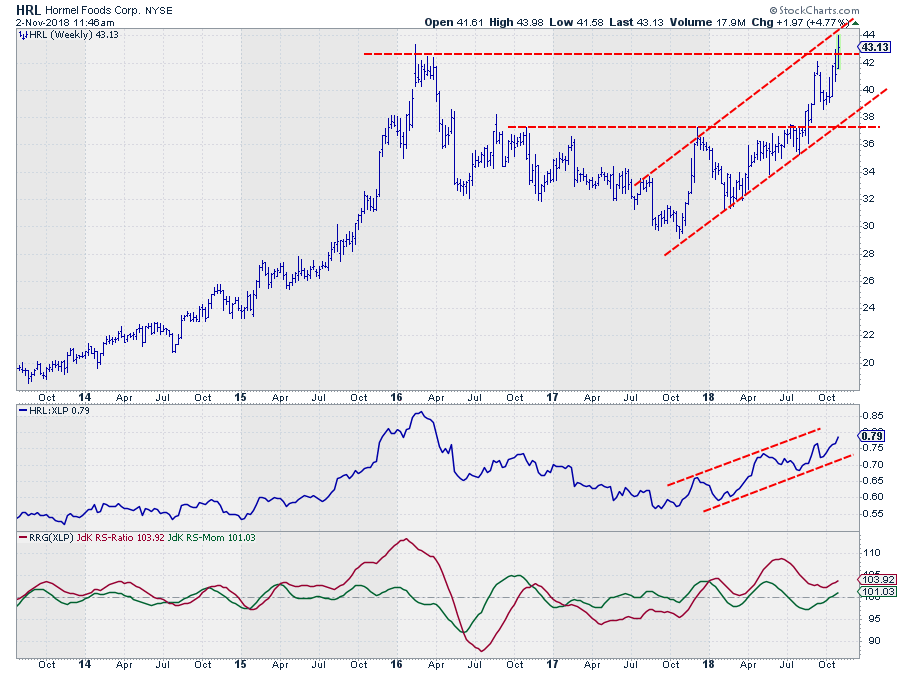
The Jdk RS-Ratio picked up the relative uptrend for Hormel Foods within the Consumer Staples sector late 2017. Since then we have seen a few iterations through the weakening quadrant, most recently since July, and then turning back to the leading quadrant.
The position of HRL on the RRG and the positive RRG-Heading make it an interesting stock to watch from a relative perspective.
The good news for HRL comes from the price chart where the stock just broke above its early 2016 peak. This should provide enough fuel for HRL to continue its outperformance vs the sector.
With the sector outperforming the market in a "risk-off" situation Hormel Foods will likely be one of the stocks to provide shelter.
Proctor & Gamble Co - PG
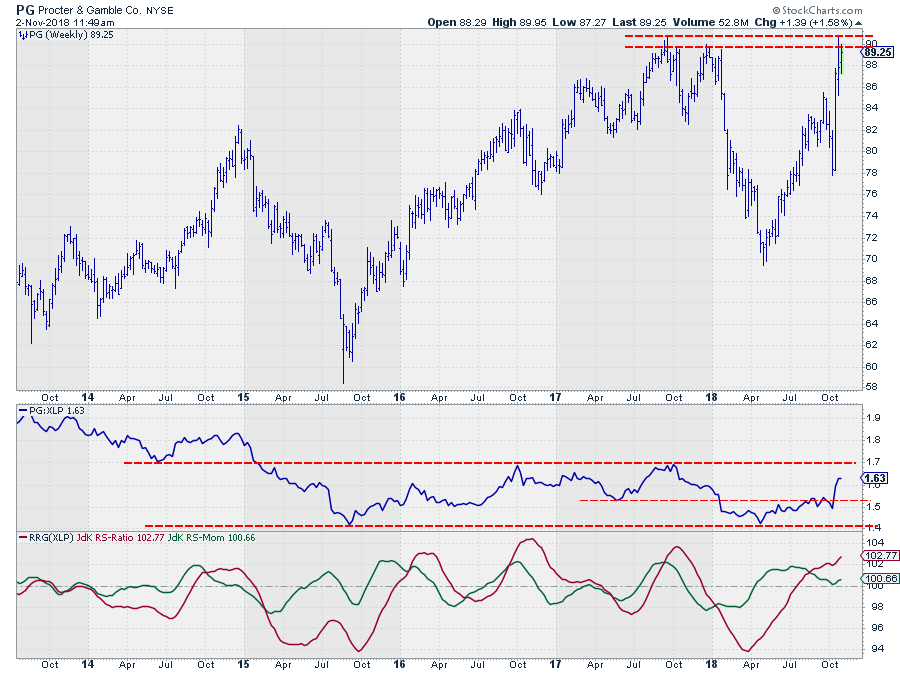
PG is the heavyweight in the sector and it has been doing really well since its low around $ 70. From a relative perspective, PG accelerated in the last few weeks but still has more upside potential before it will reach its overhead resistance (around 1.7 on the RS-Line).
On the RRG, PG has just jumped back up to a positive RRG-Heading and seems ready to move further into the leading quadrant after a temporary setback as a result of the sideways movement in relative strength over the summer.
On the price chart, PG is now starting to push against the resistance offered by the highs that were set in the second half of 2017.
As-if-and-when that level breaks, a lot of upside potential will be unlocked for PG to drag the Consumer Staples sector higher, at least relative to the S&P 500.
Let me know what you think of this usage of RRG in the comments below. If you would like to receive a notification when a new RRG blog article is published, simply "Subscribe" with your email address using the form below.
Julius de Kempenaer | RRG Research
RRG, Relative Rotation Graphs, JdK RS-Ratio, and JdK RS-Momentum are registered TradeMarks ®; of RRG Research
Follow RRG Research on social media:
Feedback, comments or questions are welcome at Juliusdk@stockcharts.com. I cannot promise to respond to each and every message but I will certainly read them and where reasonably possible use the feedback and comments or answer questions.
If you want to discuss RRG with me on SCAN, please use my handle Julius_RRG so that I will get a notification.
