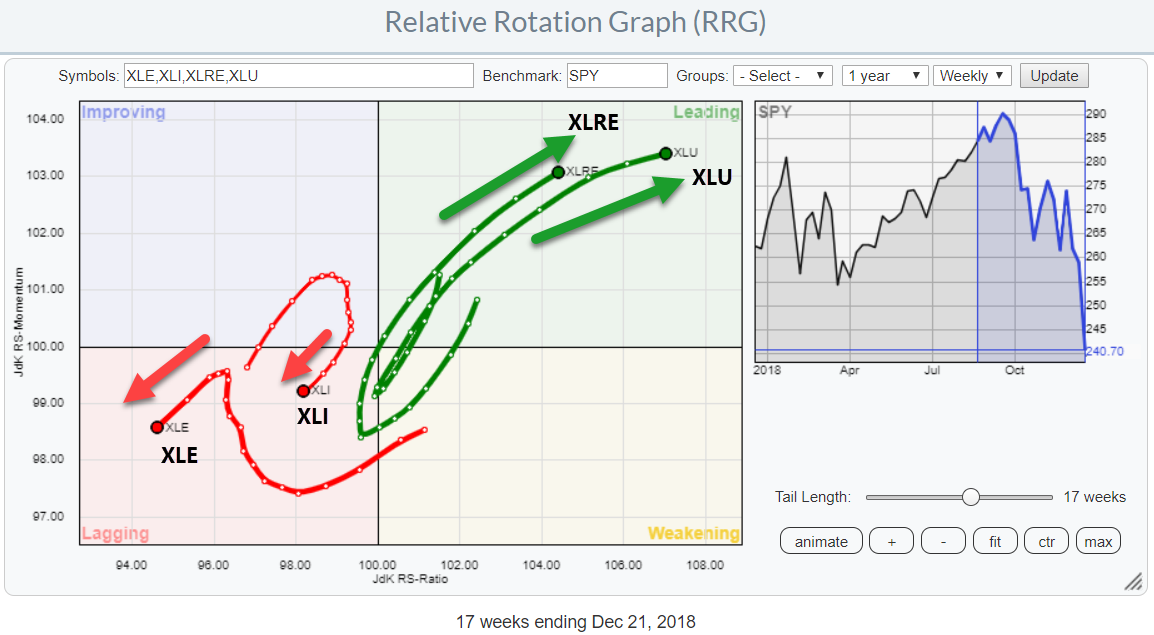
 In my previous post, I highlighted both the Real-Estate and the Utilities sectors as (strong) outperformers during this weak period for stocks in general. This "Double + for Utilities and Real Estate on Relative Rotation Graph" pointed to the position inside the leading quadrant for both sectors on both the weekly AND the daily time frames.
Frequent readers of this blog or people who have heard me speak at some event probably already know that I think that most investors are too focussed on "what to buy" as opposed to being aware of "what NOT to buy".
In this post, I am going to search for one stock in each sector. The Best-Of-the-Best in XLRE and XLU and the Worst-Of-the-Worst in XLI and XLE.
UTILITIES
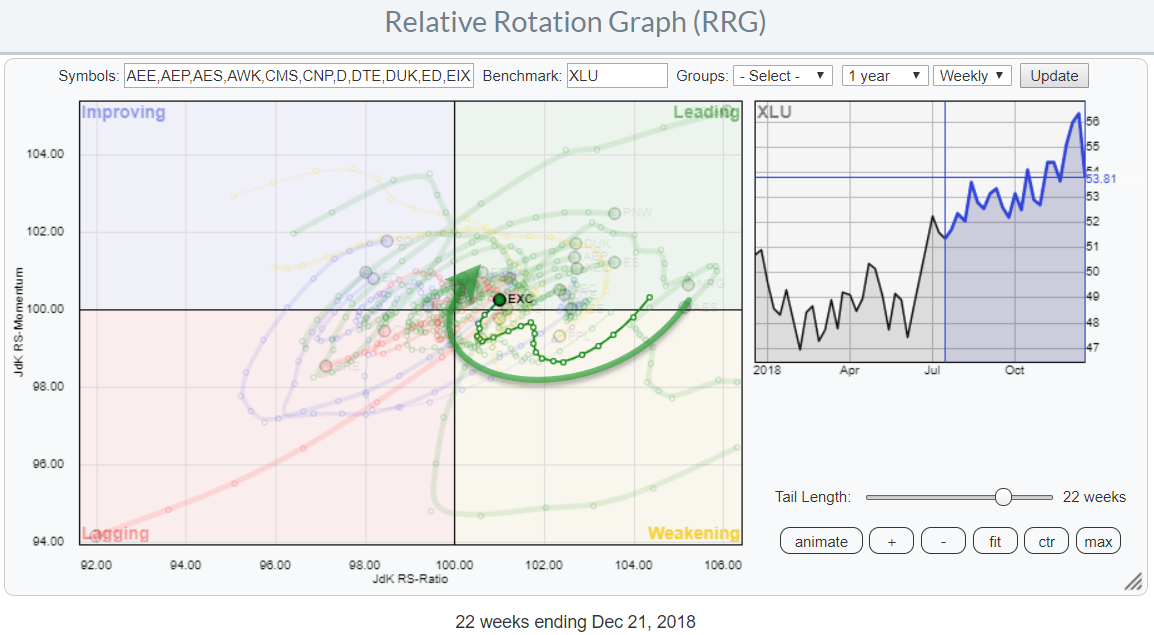
On the RRG for Utilities the stocks that caught my eye is Exelon Corp (EXC). This stock entered the leading quadrant in the summer of 2017 and since then rotated a few times from leading into weakening and then back to leading.
Such a sequence seems to be underway again at the moment.
Exelon - EXC
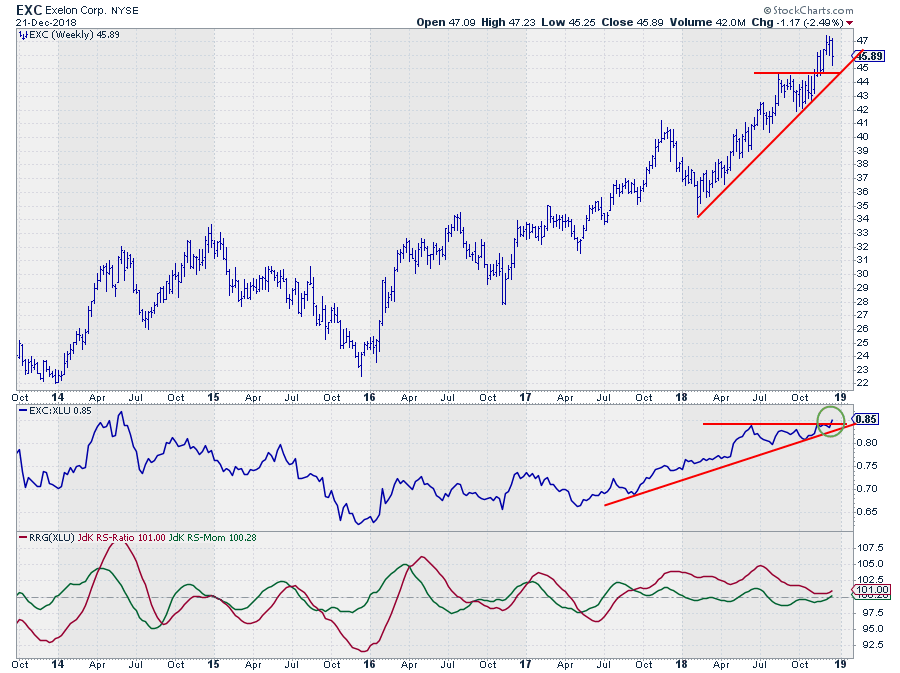 The price chart for EXC reveals that the stock is still in a nice uptrend and recently broke to new highs.
The former resistance level at $45 is now expected to start providing support in case of a setback after the rally to $47.
The rotation back into the leading quadrant on the RRG is now getting support from the break higher in the relative strength line that is about to take out horizontal resistance.
The combination of a strong price and a strong relative trend suggests that EXC can continue to outperform the broader market in coming weeks.
REAL-ESTATE
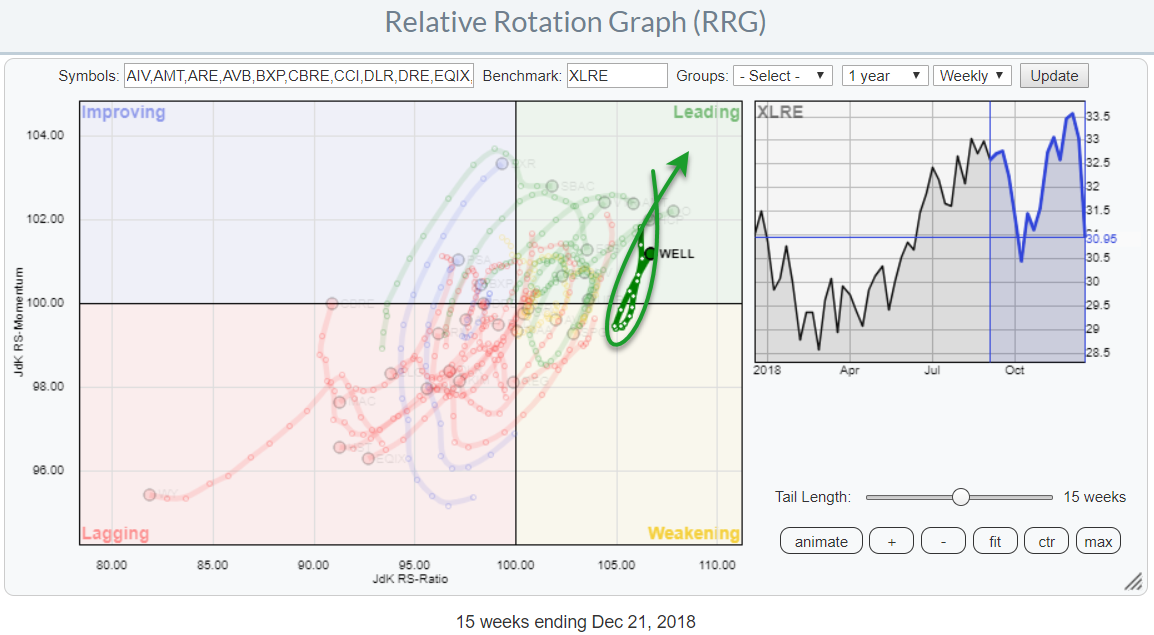
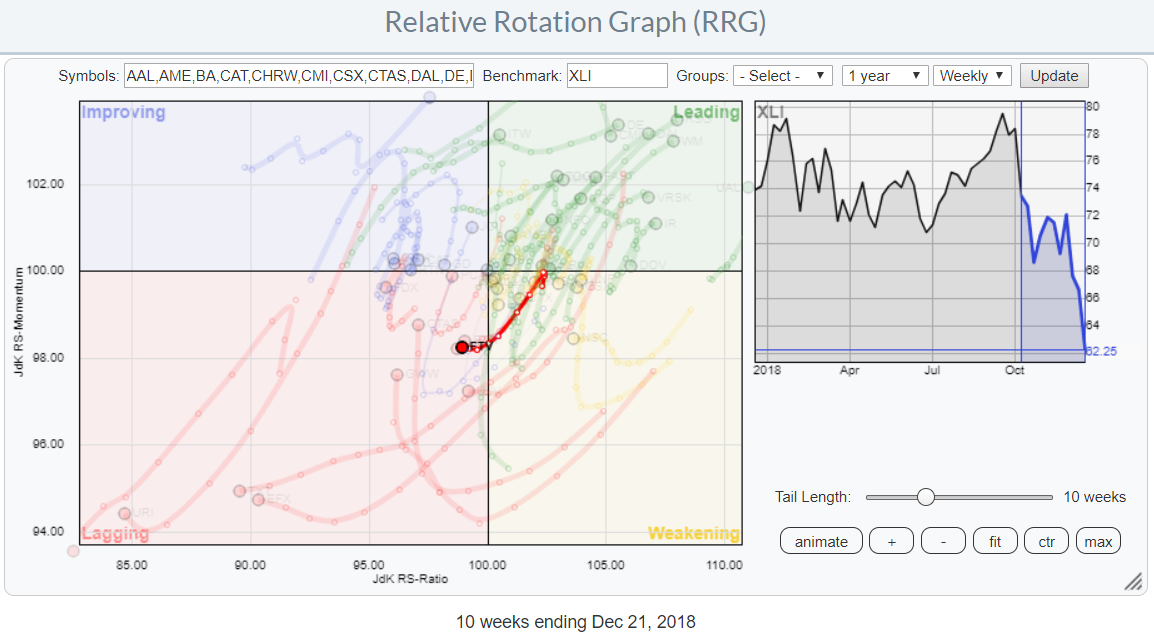
On the Relative Rotation Graph for Real-Estate stocks, WELL is showing a strong rotational pattern in which it dropped from leading into weakening but then very sharply turned back up and pushed back into the leading quadrant while the week-to-week observations on the tail are increasing which is a sign of strength.
Welltower Inc - WELL
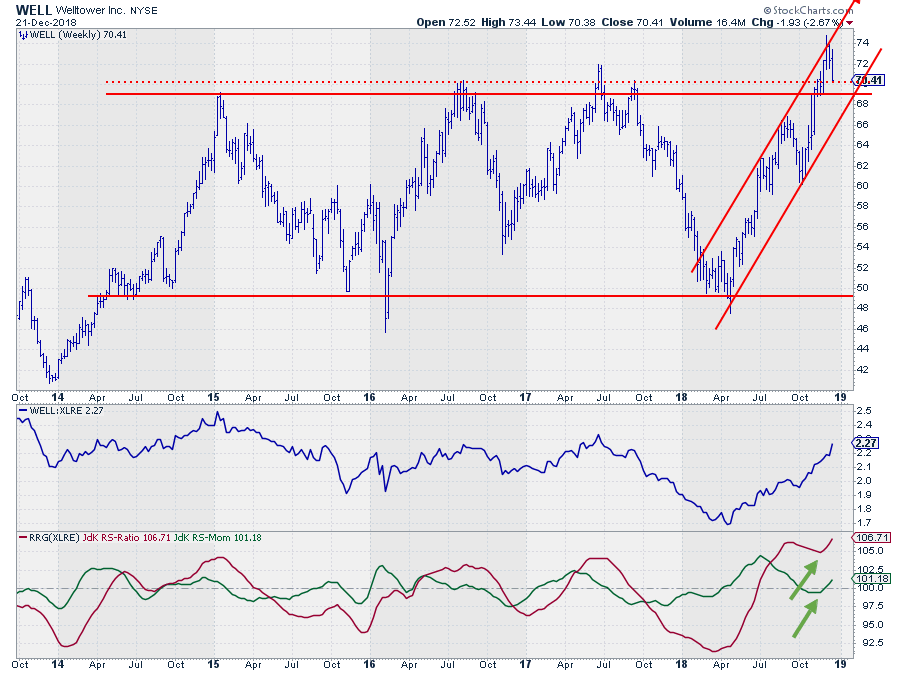 I covered WELL in a recent DITC post titled: "Oh WELL... What Can I Say?" Since that contribution, the stock dropped back about a dollar after breaking to new highs out of a long and wide trading range. The support zone that needs to hold, IMHO, to keep up the positive outlook for WELL is the area between roughly $69-$71.
The relative line got another boost last week despite the small correction in price, resulting in a further improvement of the RRG-Lines above 100. This pattern continues to push WELL back, and further, into the leading quadrant.
For now, this will likely be one of the stocks inside the Real-Estate sector that will provide shelter for general market weakness.
INDUSTRIALS
Browsing through the members of the Industrials sector my eye fell on the tail of Fortive Corp. (FTV). This stock turned around at the edge between weakening and leading and started heading towards the lagging quadrant at an increasing tail length.
Since a few weeks, FTV has entered the lagging quadrant but the increasing distances between week-week observations shortened indicating a loss of momentum in the (down)trend. But only the relative momentum has flattened. On the JdK RS-Ratio scale, FTV is still moving left and has a lot of negative territory ahead of itself.
Fortive Corp - FTV
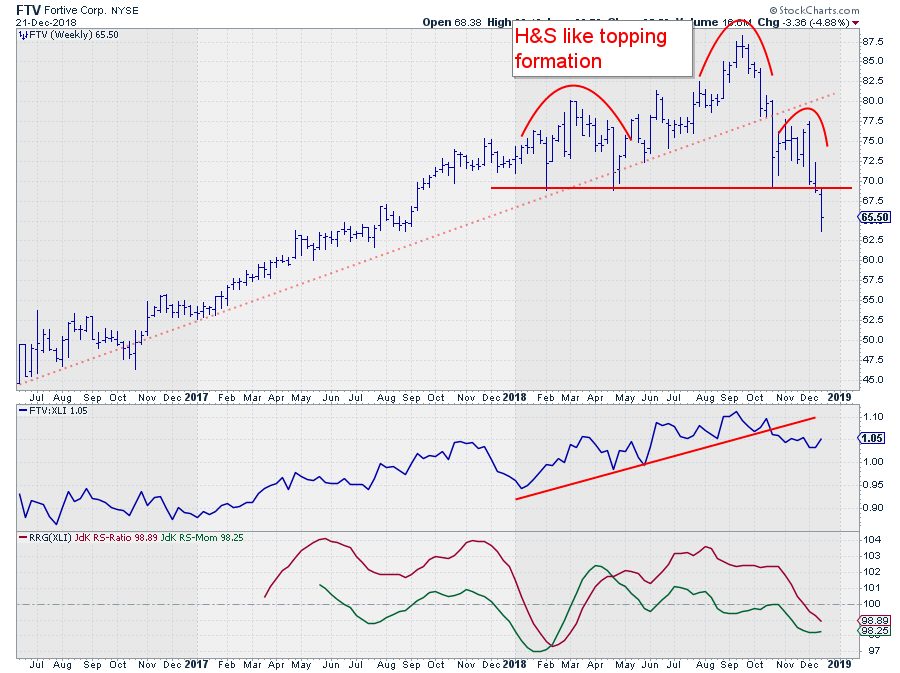 The history for FTV is not that long but since the start in 2016 the stock showed a nice uptrend that ended a few months ago when the up-sloping support line (dotted red line) was broken downward.
After an initial decline, the market found support near $70 and bounced towards the $77.50 area but did not manage to get back above the old trend line.
Last week FTV dropped below the horizontal support level near $70 which completed an H&S like topping formation. The pattern is a bit too a-symmetric to my taste to label it as a full-fledged H&S formation with all the bells and whistles but its got a lot of the characteristics and they are not bullish...
For coming weeks there is plenty of downside risk for FTV while upside potential is limited to the breakout level near $70.
ENERGY
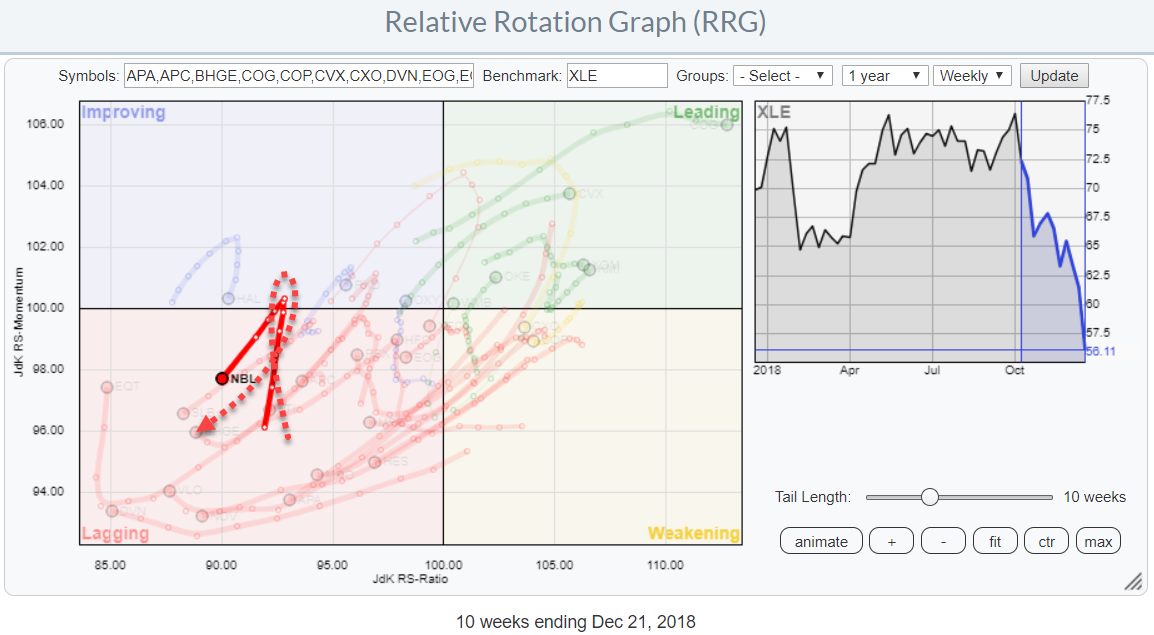
On the Energy RRG, NBL is showing a sharp hook left and back into the lagging quadrant. These hooks are the result of a very sharp rotation. Too sharp to display the characteristical clockwise rotational pattern. At least on this weekly version of the RRG chart. Running the RRG on a shorter time-frame will once again reveal the clockwise rotational characteristics.
Noble Energy Inc. - NBL
 The NBL chart shows a nasty break below the lower boundary of a three-year range between $22.50-$37.50/40.00.
Based off the height of the range, around $15, a target for the decline can be pegged near $7.50 which would bring the stock back to levels that were seen in the early 2000s. The only potential support level that can be seen prior to those levels is the spike low that was set after the 2008 decline just below $14. But that is only one single observation which doe not make it a very reliable level.
It is clear that the risks for NBL outweigh the opportunities .... by a mile!
Let me know what you think of this usage of RRG in the comments below. If you would like to receive a notification when a new RRG blog article is published, simply "Subscribe" with your email address using the form below.
Thank you for following (and subscribing to) the RRG blog. I wish all readers a Merry Christmas and a happy holiday season.
Julius de Kempenaer | RRG Research
RRG, Relative Rotation Graphs, JdK RS-Ratio, and JdK RS-Momentum are registered TradeMarks ®; of RRG Research
Follow RRG Research on social media:
If you want to discuss RRG with me on SCAN, please use my handle Julius_RRG so that I will get a notification.
