Top Advisors Corner June 27, 2014 at 07:41 PM
Market jitters predominate - approaching the Quarter's end (amidst Russell re-balancing); as economic data continues to defy complacency or any upside exuberance, with that little-known but traditional influence on equity prices: facts and slowing outlooks... Read More
Top Advisors Corner June 27, 2014 at 01:51 PM
The FOMC has continued to "taper" the monthly amounts of its purchases of Treasury bonds and Mortgage Backed Securities (MBS), but the Federal Reserve is still pumping money into the banking system at a high rate... Read More
Top Advisors Corner June 26, 2014 at 01:01 PM
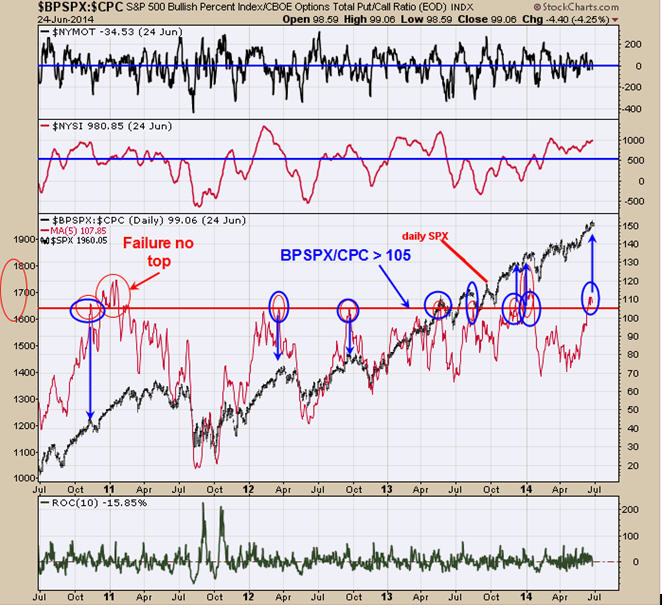
Monitoring purposes SPX: Neutral Monitoring purposes GOLD: Gold ETF GLD long at 173.59 on 9/21/11 Long Term Trend monitor purposes: Flat Market is stuck in neutral. The Above chart is the Bullish percent index for the SPX/ CBOE put/call ratio... Read More
Top Advisors Corner June 26, 2014 at 12:54 PM
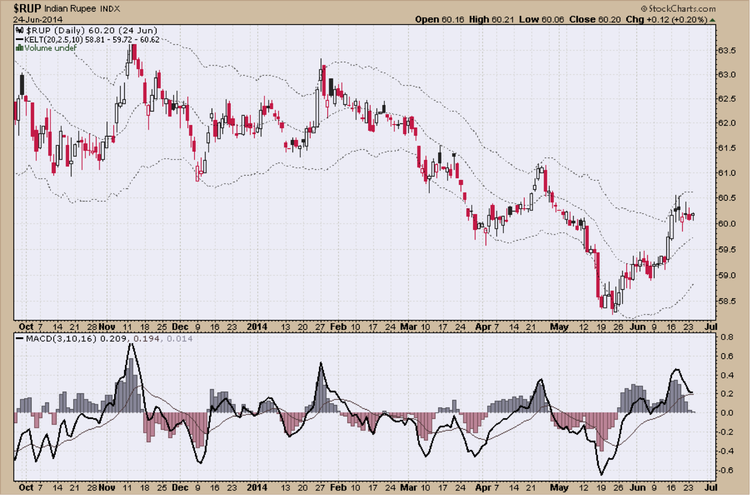
Recent price action in the Indian Rupee makes an excellent case for highlighting the importance of multiple time-frame analysis... Read More
Top Advisors Corner June 24, 2014 at 02:33 PM
One of the most challenging price patterns technical traders encounter is sideways action... Read More
Top Advisors Corner June 20, 2014 at 03:56 PM
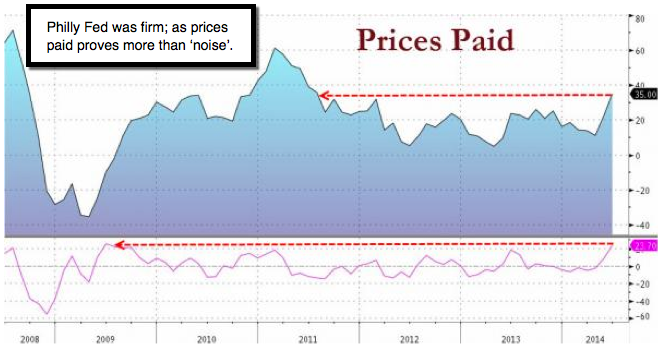
A utopian 'new neutral' - is not the case; nor is this pattern sustainable... Read More
Top Advisors Corner June 20, 2014 at 12:22 PM
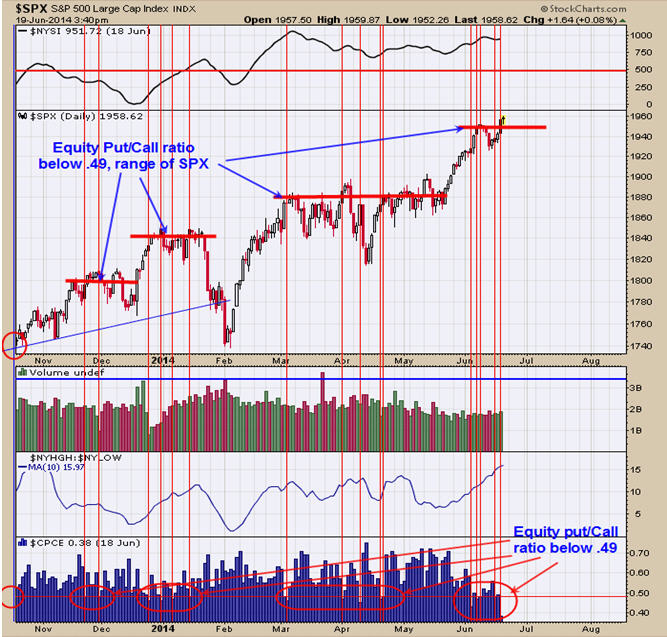
Monitoring purposes SPX; Neutral. Monitoring purposes Gold: Gold ETF GLD long at 173.59 on 9/21/11. Long Term Trend monitor purposes: Flat The above chart shows the Equity put/call ratio (bottom window) and where it corresponds to the SPX... Read More
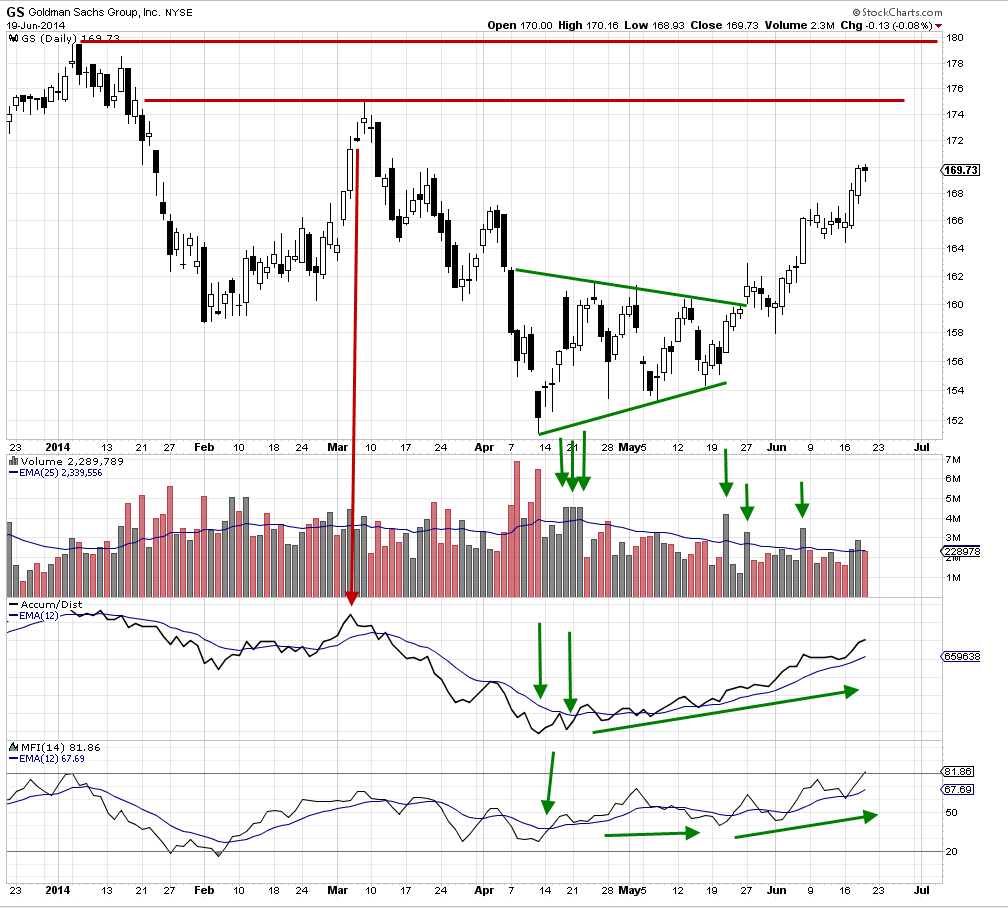
Top Advisors Corner June 17, 2014 at 03:10 PM
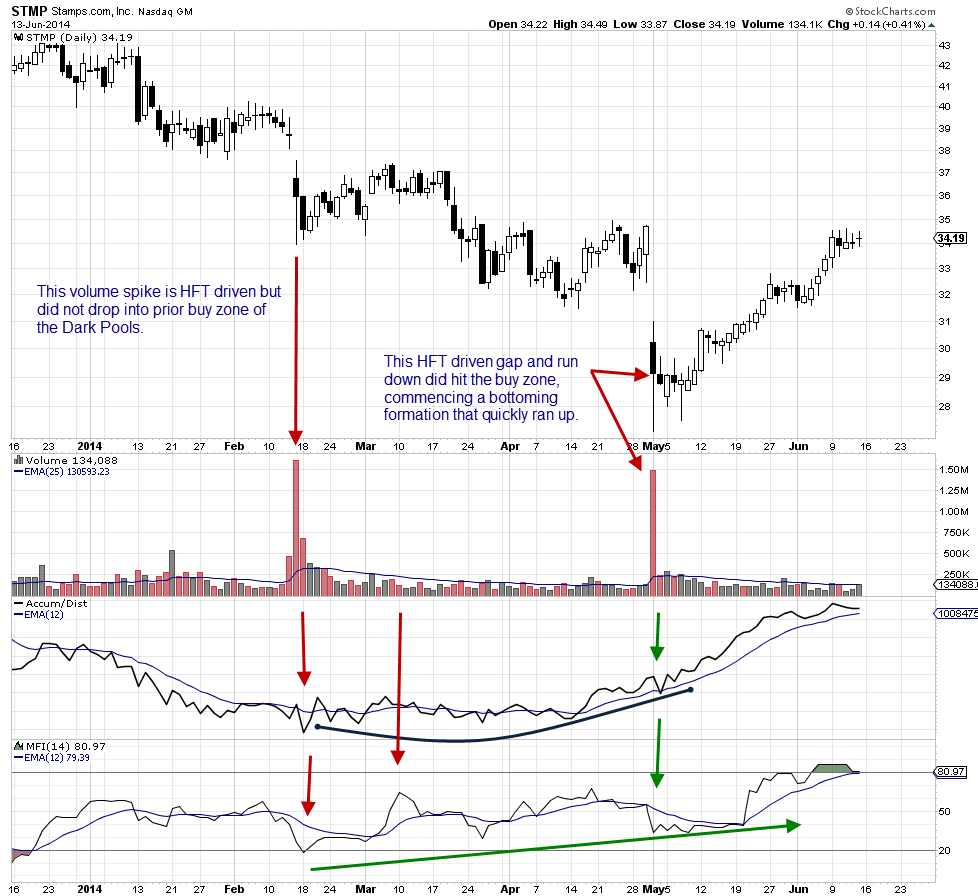
Volume has become a far more important indicator for technical traders as more orders are executed off the regular exchanges in Dark Pool Alternative Transaction Systems and with High Frequency Trading, HFT, dominating price action on the exchanges... Read More
Top Advisors Corner June 16, 2014 at 01:15 PM
In order to make it easier for readers to profitably use our research, I'm going to take some time each week, to explain our indicators measure and how we use them. This week, I'm going to start with Options Sentiment... Read More
Top Advisors Corner June 16, 2014 at 08:51 AM
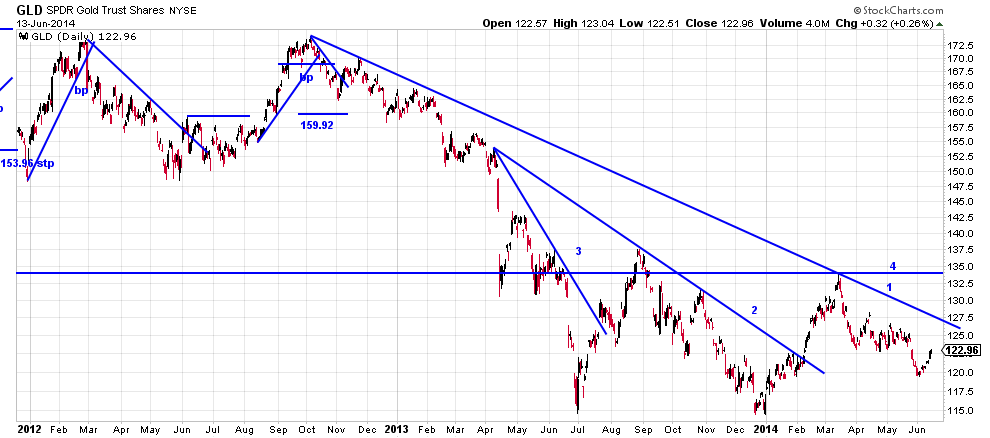
We have been struggling with the gold chart for hours and hours trying to understand what we are seeing. We have been bearish on gold for some time and even made a rule of seven analysis which looked for a price of 880... Read More
Top Advisors Corner June 12, 2014 at 01:49 PM
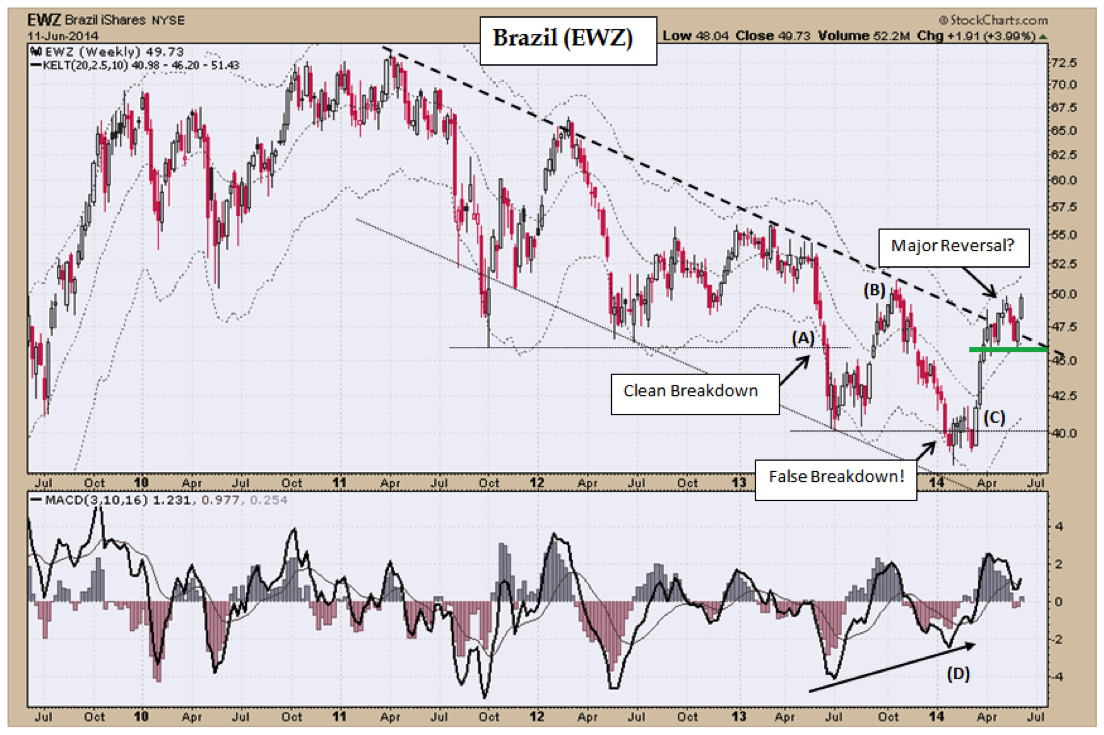
Recent price action in the chart of EWZ marks an important inflection point: The dominant primary downtrend has possibly come to an end as prices appear to be on the verge of embarking on a new uptrend... Read More
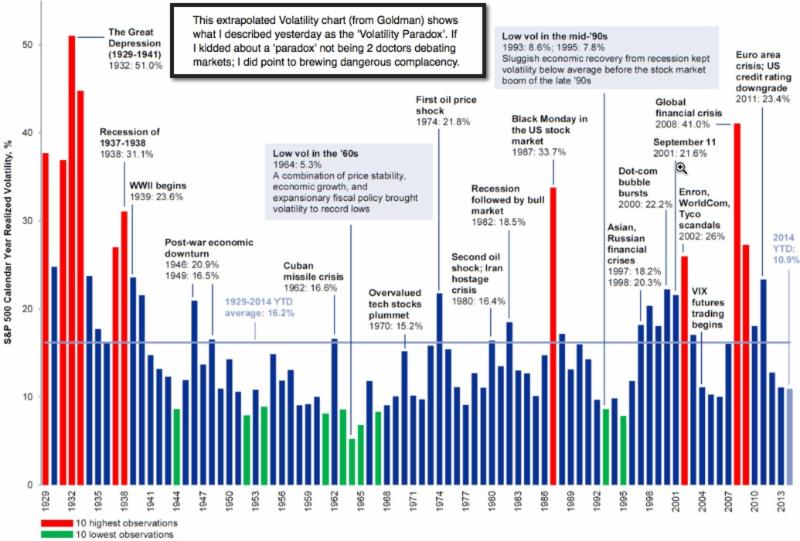
Top Advisors Corner June 12, 2014 at 01:24 PM
The CBOE Volatility Index (VIX) has dropped below 12. Below 12!!! Surely this must be one of the signs of the apocalypse. Not so fast. A low VIX is a sign of option trader complacency, and complacency is a problematic sign for the market which can lead to a price decline... Read More
Top Advisors Corner June 11, 2014 at 05:36 PM
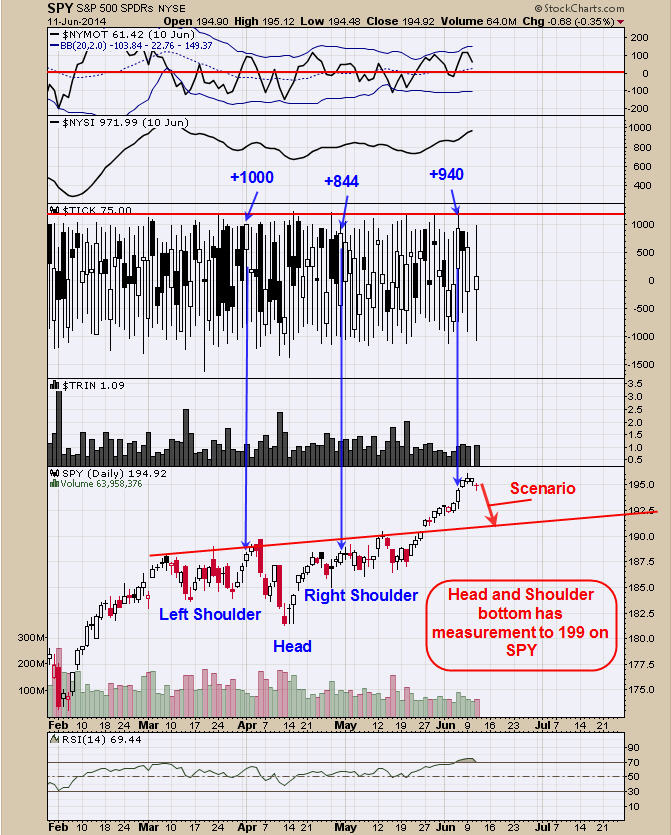
Monitoring purposes SPX: Neutral Monitoring purposes GOLD: Gold ETF GLD long at 173.59 on 9/21/11 Long Term Trend monitor purposes: Flat Last Thursday a +940 up ticks close was registered which implies short term exhaustion on the SPY... Read More
Top Advisors Corner June 11, 2014 at 01:33 PM
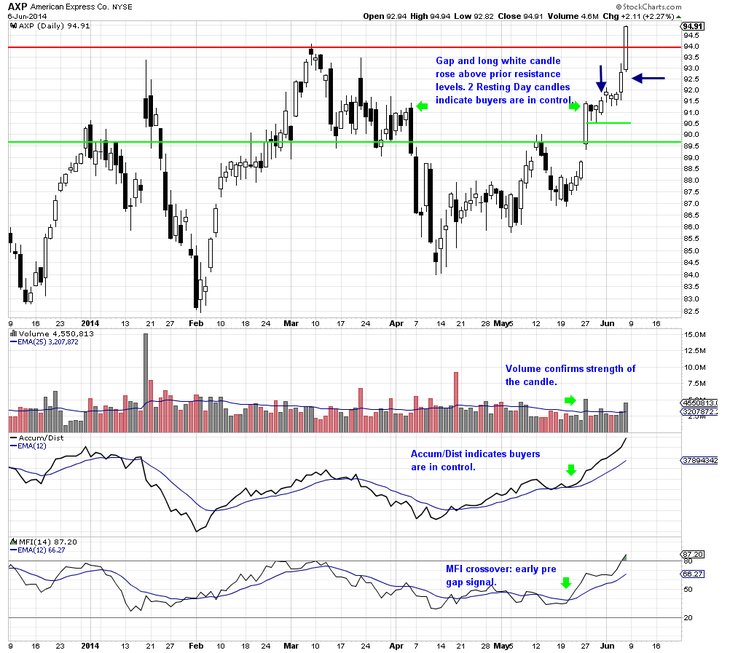
American Express Co. (NYSE: AXP) was the topic stock for last week’s stock review. This week, we’ll review how to exit the swing trade profitably... Read More
Top Advisors Corner June 08, 2014 at 10:10 AM
Complacency 'spun' as 'the new neutral' - is the latest explanation for why clear-sailing persists, as the market continues climbing a mountain... Read More
Top Advisors Corner June 06, 2014 at 12:41 PM
Suppose that all you knew was that the NYSE's daily cumulative A-D Line was at a new all-time high, or even a 3-year high. What would that tell you? Generally speaking, the A-D Line does well when liquidity is strong... Read More
Top Advisors Corner June 04, 2014 at 03:28 PM
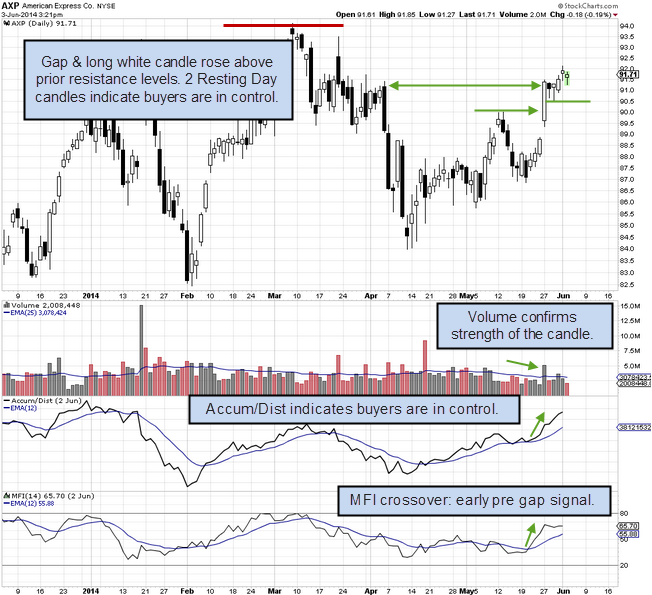
Learning to read stock charts is one of the most important skills that a technical trader needs if they are determined to enjoy the profits that professional traders take for granted... Read More
Top Advisors Corner June 04, 2014 at 02:40 PM
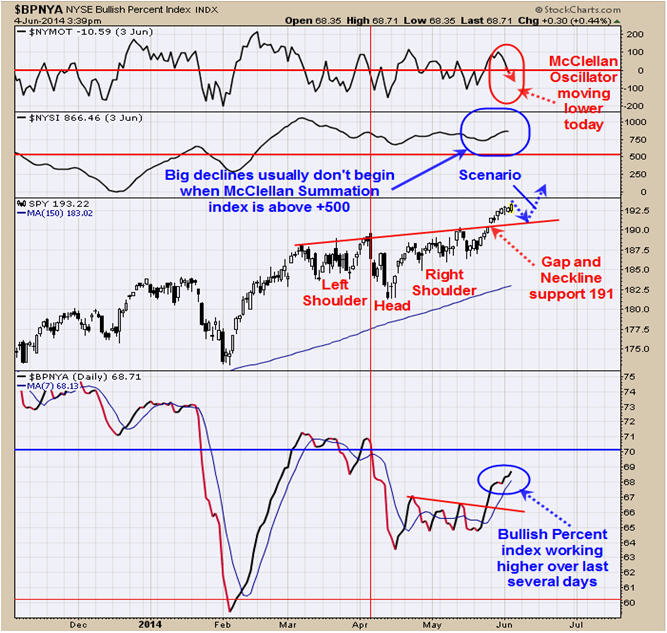
Monitoring purposes SPX: Neutral Monitoring purposes GOLD: Gold ETF GLD long at 173.59 on 9/21/11 Long Term Trend monitor purposes: Flat We are favoring the Head and Shoulders pattern that was discussed on last Thursday’s report... Read More
Top Advisors Corner June 02, 2014 at 01:06 PM
Short-Term Sentiment: Neutral. Overall Intermediate-Term Sentiment: Mixed for the market. Individual Investor Sentiment: ST Neutral. IT Neutral for the market. Small Speculator Sentiment: ST Mildly Bearish, and IT Bearish for the Market... Read More
Top Advisors Corner June 02, 2014 at 12:31 PM
When total margin debt topped at $416 billion in July 2007, the S&P 500 was at 1455. Despite a decline of 13.8% in margin debt over the next two months, the SPX climbed 4.9% and then hit a new record high in October... Read More