
Learning to read stock charts is one of the most important skills that a technical trader needs if they are determined to enjoy the profits that professional traders take for granted. Reading a chart requires that a technical trader understand what the relational values between candlesticks, volume, and other indicators represent for near term price action.
When a Relational Analysis™ is applied, candlestick patterns, volume, and other indicators reveal who is in control of price—whether it is Dark Pool large lot buyers, High Frequency Trading, smaller funds, or retail traders. Relational Analysis can also be used to study how price behaves at resistance levels and support levels, which helps traders determine if the stock is worth studying further or if it should be discarded. Only optimal stock picks should be selected for trading.
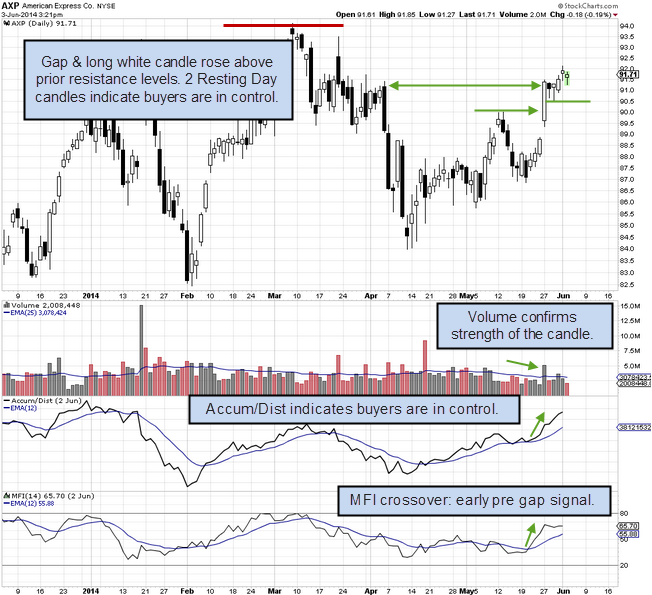
Here is an example of how to read a candlestick chart:
AXP has several areas to study that reveal strengths and weaknesses that help you determine if this stock has potential for day trading, swing trading, or position trading at this time.
First, the buy side has been controlling price over the past several weeks. In the past several days, buyers have seized control. HFTs failed to sell the stock down as it dropped into a Buy Zone of the Dark Pools. Sellers were unable to drive price down in May, a clear indication of consistent quiet accumulation indicative of giant lots. Each time sellers attempted to sell the stock down, buyers moved in. Indicators confirm that at the end of April, accumulation started by Dark Pools. The gap is significant as it is holding at the resistance level even during profit-taking over the 2 days following the gap up.
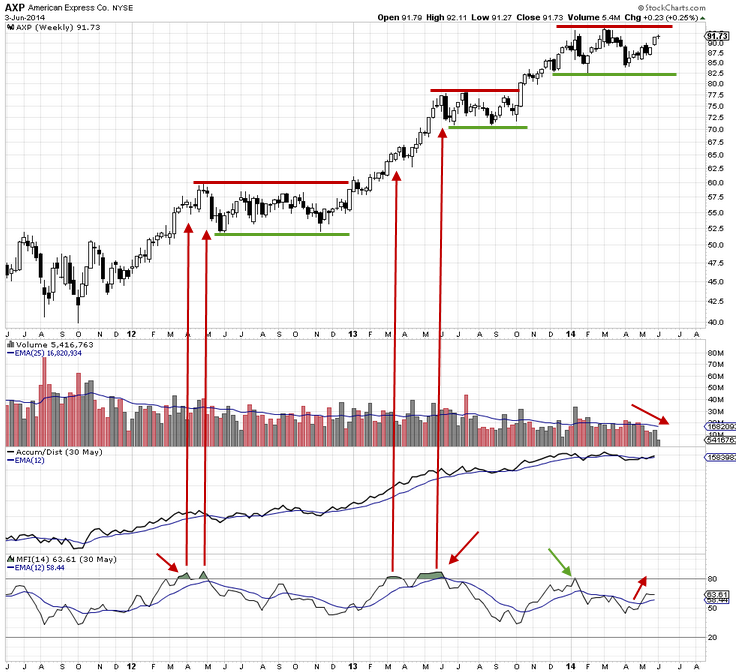
This stock is not in a platform but is stuck in a trading range, as shown on the weekly chart below. Therefore, the stock is best suited for swing or day trading at this time.
The MFI indicator shows that extreme peaks preceded profit-taking to sideways patterns for several months. This occurred twice in the past couple of years. In the current sideways price action, which is trading-range width, the MFI is not showing an extreme peak pattern. Accum/Dist has been flat but is slightly tipped up with the short term buying strength we saw in the previous chart.
Summary:
AXP moved up in 2013 to a new all-time high and then shifted into a trading range and has been stuck in that trading range for the past few months. The trading range highs pose resistance where the stock is likely to stall again, at or near the high of the range. It has insufficient volume to move aggressively out of the trading range at this time but has a strong bias to the upside with buyers maintaining price and moving price upward. Sellers have lost control of price at this time. These details expose the better trading styles for this stock.
Resting Day Candle patterns that form near the prior white candle highs indicate buyer strength. This can often turn into a consolidation pattern or a compression pattern if the small candles continue to form over several days. Risk versus point gain potential must be calculated to determine if the stock has sufficient reward/risk to make it a viable trade. Resting Day candles provide a low risk stop loss placement for swing trading. Swing traders should strive for a 4/1 risk to reward ratio for optimal stock picks.
Trade wisely,
Martha Stokes CMT
www.TechniTrader.com
info@technitrader.com