Top Advisors Corner September 30, 2014 at 01:55 PM
The futures were rocking lower after protests in Hong Kong annihilated their market. Europe was down and we were sinking by the click with the Dow futures down nearly 2 points at their lows pre-market... Read More
Top Advisors Corner September 30, 2014 at 01:53 PM
Rationales & Targets We sent out a special email to subscribers on Saturday, September 20th, featuring “The Worst Chart of the Year,” a chart we admitted might be the worst we had ever seen. We ended with the conclusion that “….stocks are extremely vulnerable at this juncture... Read More
Top Advisors Corner September 30, 2014 at 01:49 PM
Conviction has been waning - for months, as Oscillators (Summation Index is a decent example) and major Indexes like the Russell and NY Composite have denoted... Read More
Top Advisors Corner September 26, 2014 at 01:00 PM
September has a well-deserved reputation for causing the market trouble, and the week after September options expiration is statistically the worst week of the year (per Rob Hanna of www.quantifiableedges.com)... Read More
Top Advisors Corner September 25, 2014 at 03:50 PM
For the last two weeks, I have compared reader’s holdings performance vs. the S&P 500. Today, I audit the final reader’s portfolio. To recap, I do not give buy or sell recommendations or tell what to buy or sell... Read More
Top Advisors Corner September 24, 2014 at 02:48 PM
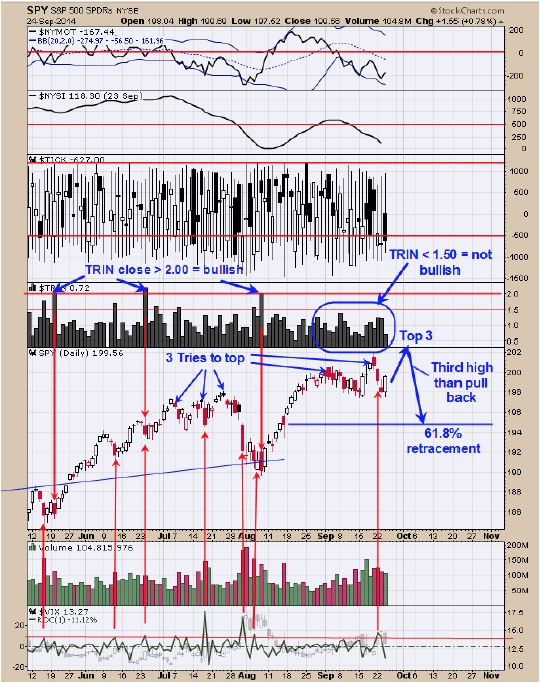
Monitoring purposes SPX: Sold long SPX on 8/14/14 at 1955.18 = gain 2.39%. Long SPY on 8/7/14 at 1909.57. Monitoring purposes GOLD: Gold ETF GLD long at 173.59 on 9/21/11 Long Term Trend monitor purposes: Flat The bottom window is the Rate of Change (ROC) for the VIX... Read More
Top Advisors Corner September 23, 2014 at 01:51 PM
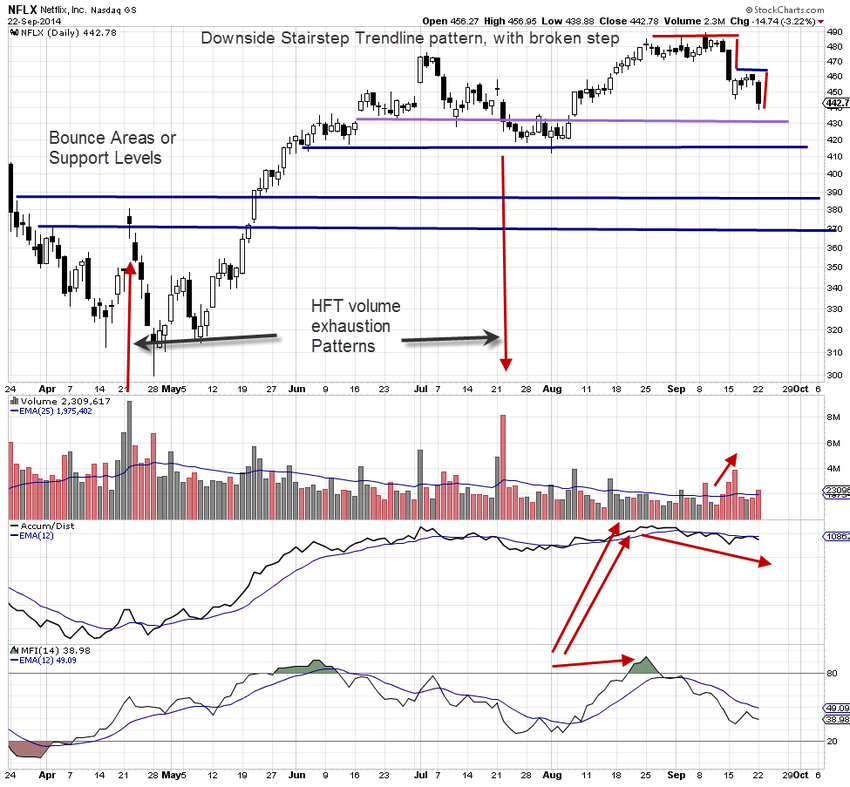
Netflix (NASDAQ: NFLX) Stock Chart Shows Different Market Participant Groups Controlled Price Action at Each Support Level One of the challenges that retail and technical traders face nowadays is the expanded and far more complex cycle of Market Participant Groups, of which there... Read More
Top Advisors Corner September 23, 2014 at 01:46 PM
The bears can finally celebrate a day for themselves. It has been rare, although the market has been basically whipsawing about quite some time as those bears have been fighting a bit harder recently. As of Monday evening they deserve their little party... Read More
Top Advisors Corner September 22, 2014 at 02:15 PM
A brewing storm - is not dispatched simply because it circles awhile before striking; in fact that was the expectation this week. How so? Based primarily on everything other than what the media focused on. Not Alibaba or Apple... Read More
Top Advisors Corner September 18, 2014 at 03:15 PM
Ms. Yellen made sure she spoke the words the market wanted to hear. Keeping rates low is what the market wants, and keeping rates low is what the market will get. She won't do anything she knows will hurt the market, because she uses the market to keep her job safe... Read More
Top Advisors Corner September 18, 2014 at 03:00 PM
The terrorist group ISIS (AKA the un-Islamic non-state “Army of Satan”) is tying up major portions of oil-rich Mesopotamia. Russian troops are occupying portions of Ukraine, which is a key portal for oil and natural gas to transit to western Europe... Read More
Top Advisors Corner September 18, 2014 at 02:56 PM
Last week, I compared a portfolio of “blue-chip” stocks performance vs. the S&P 500. We saw the majority underperformed the market. Today, I compare a reader’s holdings performance vs. the S&P 500. Remember, I do not give buy or sell recommendations or tell what to buy or sell... Read More
Top Advisors Corner September 18, 2014 at 02:08 PM
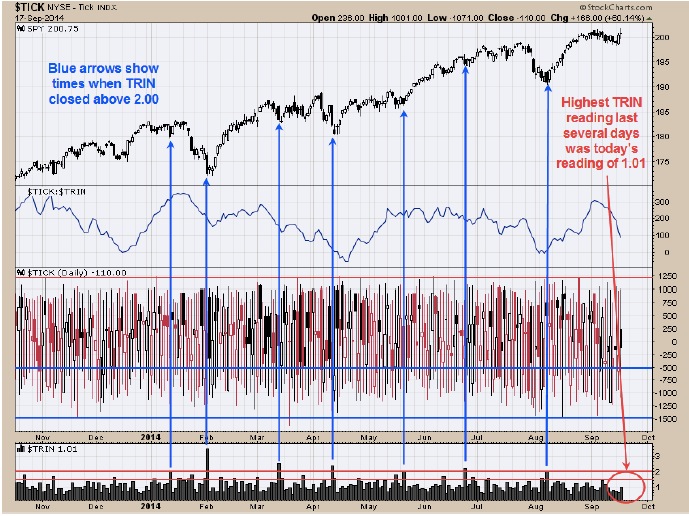
Monitoring purposes SPX: Sold long SPX on 8/14/14 at 1955.18 = gain 2.39%. Long SPY on 8/7/14 at 1909.57. Monitoring purposes GOLD: Gold ETF GLD long at 173.59 on 9/21/11 Long Term Trend monitor purposes: Flat The chart above shows the TRIN closes going back about one year... Read More
Top Advisors Corner September 18, 2014 at 01:44 PM
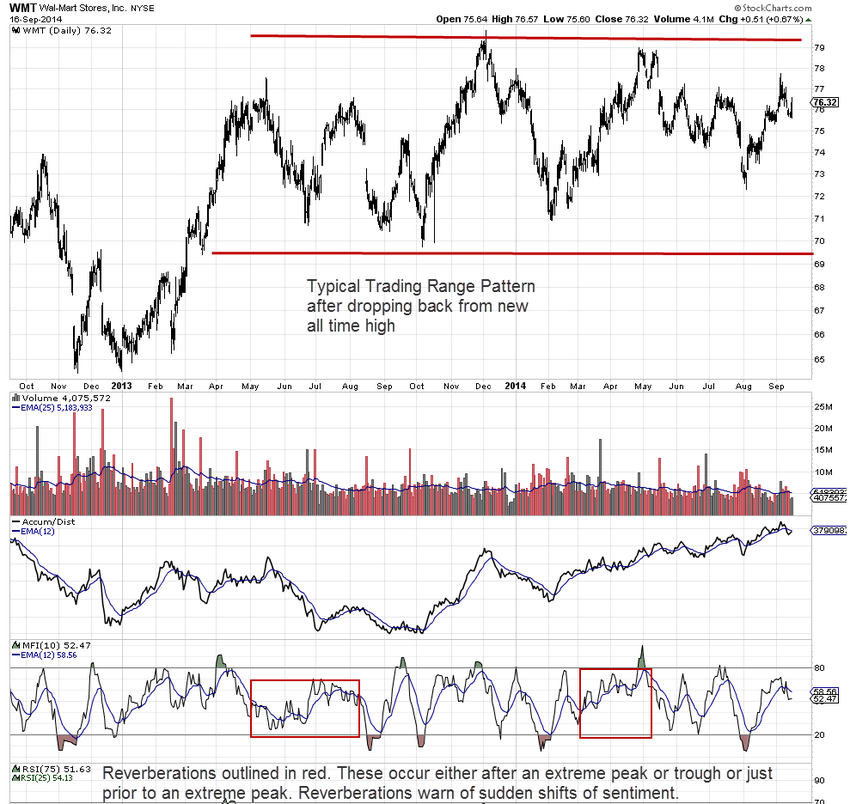
Trading Range Analysis of Stock Price Action in Wal-Mart Stores Inc. (NYSE: WMT) Many big blue chip stocks are stuck in intermediate or long term trading ranges, which are more difficult to see on a daily chart with a 6-9 month setting... Read More
Top Advisors Corner September 15, 2014 at 01:15 PM
Extreme caution - approaching the market seems advisable; not just for risks of rate shifts (and the reality of semi-deflation or stagflation conditions in much of the world continued to sustain the bond market as we thought it would throughout the overall year; while risk of tha... Read More
Top Advisors Corner September 12, 2014 at 01:00 PM
The following is a brief excerpt from our September Investor Sentiment Survey report... Read More
Top Advisors Corner September 12, 2014 at 01:00 PM
This week I answer your questions on comparing your holdings’ performance to the market, the S&P 500... Read More
Top Advisors Corner September 12, 2014 at 01:00 PM
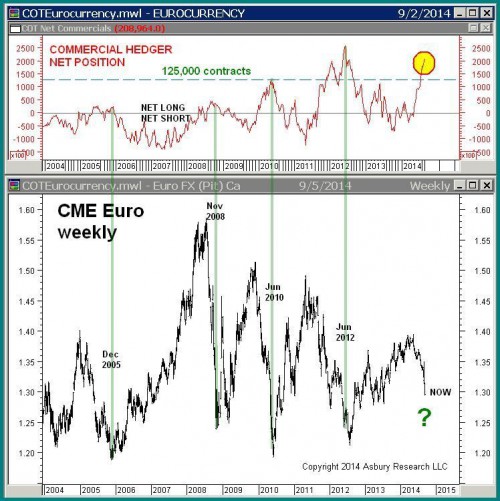
Gold is still in a downtrend, if you examine a chart of gold prices measured in dollars. But gold in euros looks much stronger, and that’s actually a bullish condition, eventually. People often ask at what dollar price is gold likely to find support or resistance... Read More
Top Advisors Corner September 11, 2014 at 01:45 PM
Monitoring purposes SPX: Sold long SPX on 8/14/14 at 1955.18 = gain 2.39%. Long SPY on 8/7/14 at 1909.57. Monitoring purposes GOLD: Gold ETF GLD long at 173... Read More
Top Advisors Corner September 11, 2014 at 01:35 PM
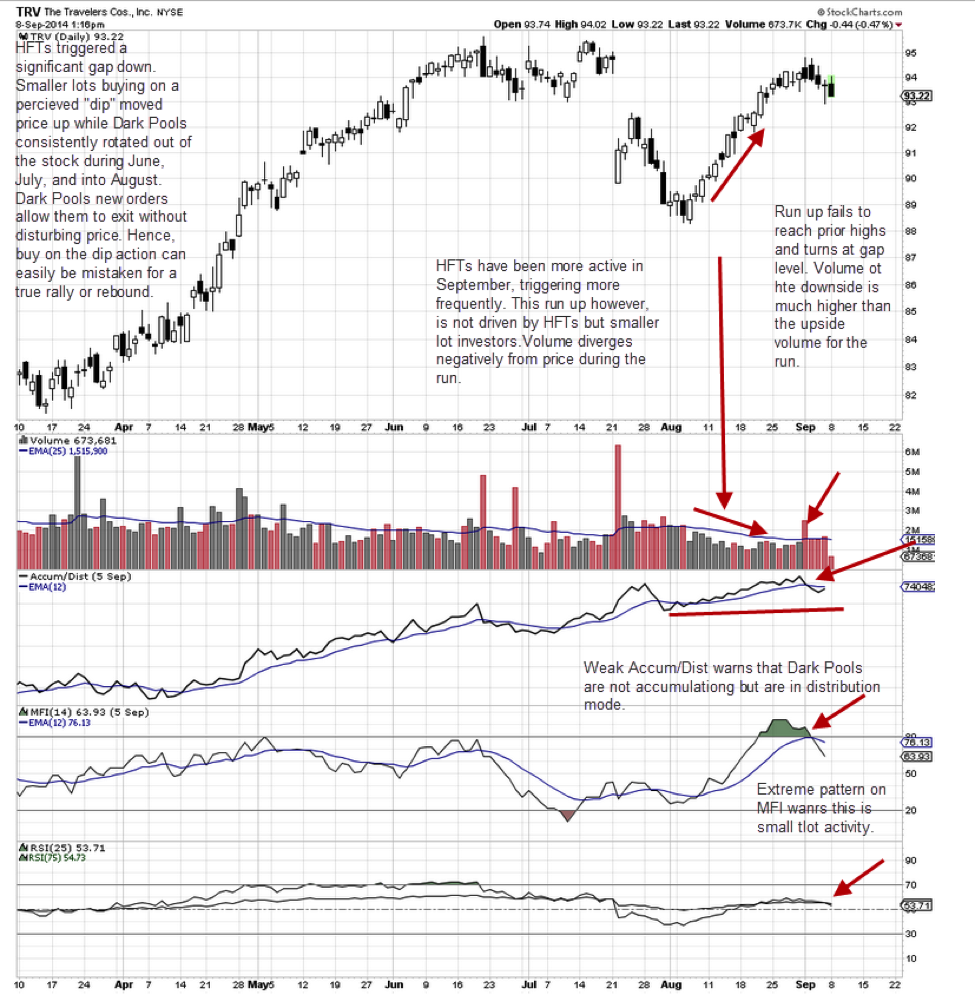
Small Lot Investors Are Often Unwittingly on the Wrong Side of the Trade Technical Traders need to learn to distinguish between Dark Pool rotation, the automated intraday millisecond trading of High Frequency Traders, small funds’ trading activity, and retail or small-lot trading... Read More
Top Advisors Corner September 11, 2014 at 01:30 PM
When the market sells off decently from the top intraday, it feels as if the big selling has finally taken hold and that the bears are finally making some progress. Yet, in the end, nothing seems to ever kick in for the bears. Monday was no exception... Read More
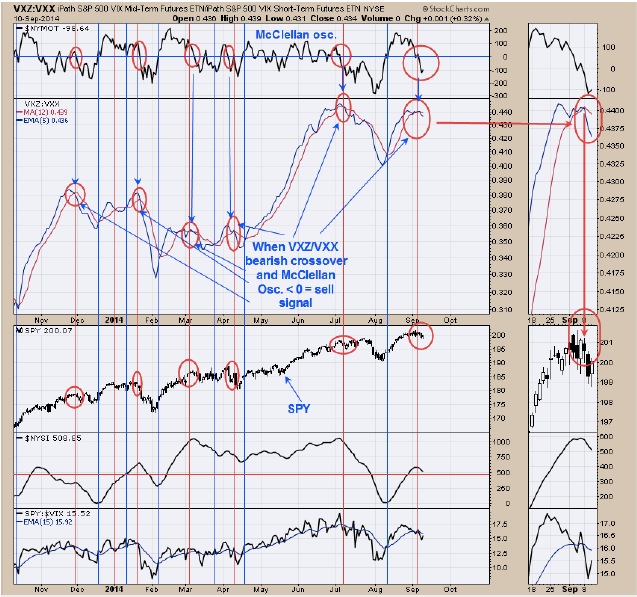
Top Advisors Corner September 05, 2014 at 12:15 PM
One interesting piece of analysis we have featured recently in both our Daily Edition and our twice monthly McClellan Market Report newsletter involves total open interest in T-Bond futures... Read More
Top Advisors Corner September 05, 2014 at 12:00 PM
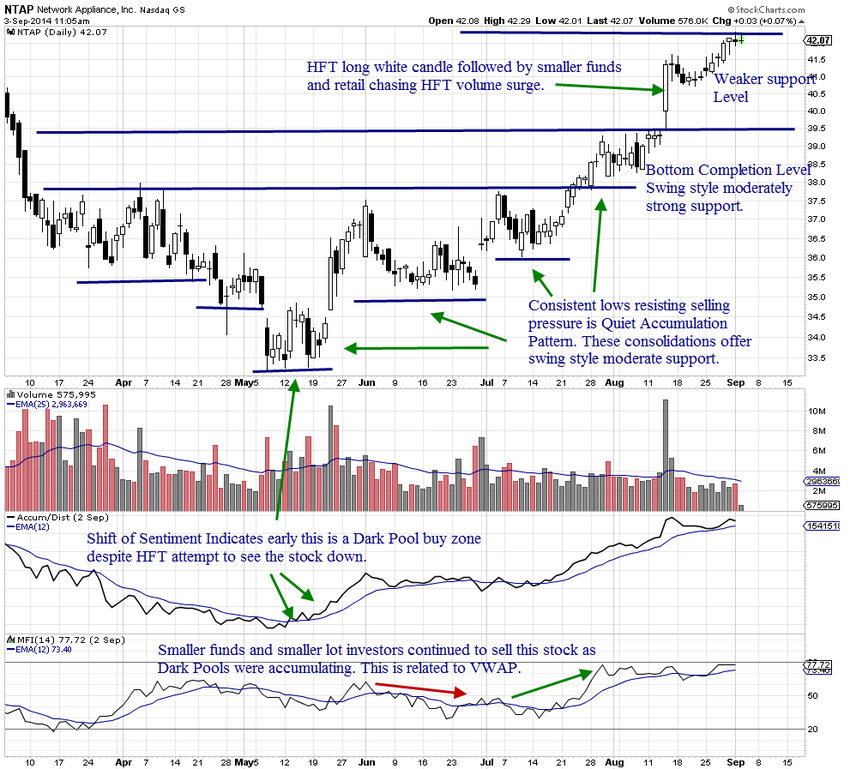
$NTAP Bottom Formation Setting Up for Swing Style Price Action Swing trading, whether used intraday or for daily runs, requires an understanding of the relationship between the trading conditions at that time and the price patterns developing on the chart being traded... Read More
Top Advisors Corner September 05, 2014 at 12:00 PM
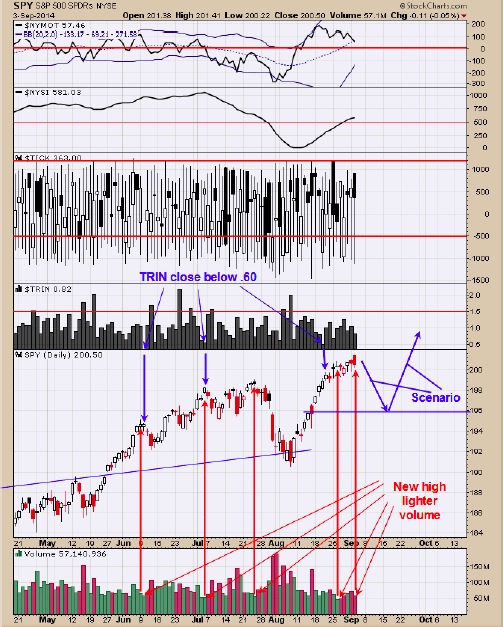
Monitoring purposes SPX: Sold long SPX on 8/14/14 at 1955.18 = gain 2.39%. Long SPY on 8/7/14 at 1909.57. Monitoring purposes GOLD: Gold ETF GLD long at 173.59 on 9/21/11 Long Term Trend monitor purposes: Flat Today the SPY hit a new high on lighter volume and than closed lower... Read More
Top Advisors Corner September 03, 2014 at 12:30 PM

It is time to go in a new direction and give my "best of breed" books that will make great gifts for young and old alike. My heart is in financial education, with the goal "to teach my students how to make better-educated financial decisions... Read More
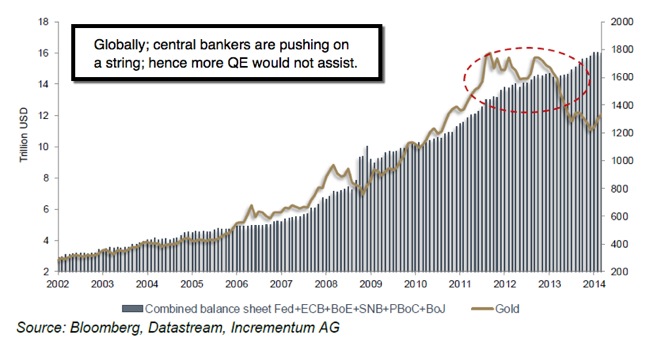
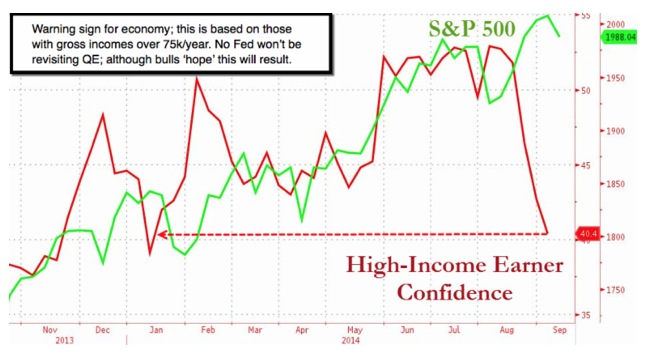
Top Advisors Corner September 02, 2014 at 01:00 PM
Trim Tab’s Charles Biderman made an exceptionally sage observation recently noting the ratio between wages and salaries and total stock market cap... Read More