Top Advisors Corner March 31, 2015 at 11:50 AM
Rationales & Targets It is generally acknowledged that bull markets thrive in a low volatility environment. The very worst type of action is an expansion in volatility, even when it takes place on the upside, since rapid movement equates to discomfort... Read More
Top Advisors Corner March 30, 2015 at 12:15 PM
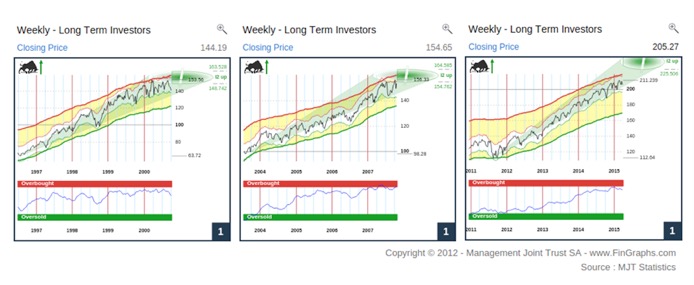
History may repeat itself, but never in the exact same way. Yet, considering the latest 6 years bull run, it is tempting to draw parallels with both the 2002- 2007 and 1995 -2000 Bull trends in US equity markets... Read More
Top Advisors Corner March 27, 2015 at 01:00 PM
Early Entry With Proper Confirmation Spatial Pattern Recognition Skills™ are a technique and skill that needs to be continually improved as technical traders gain experience, and can read charts to interpret candlesticks and indicators with more sophisticated abilities... Read More
Top Advisors Corner March 27, 2015 at 11:40 AM
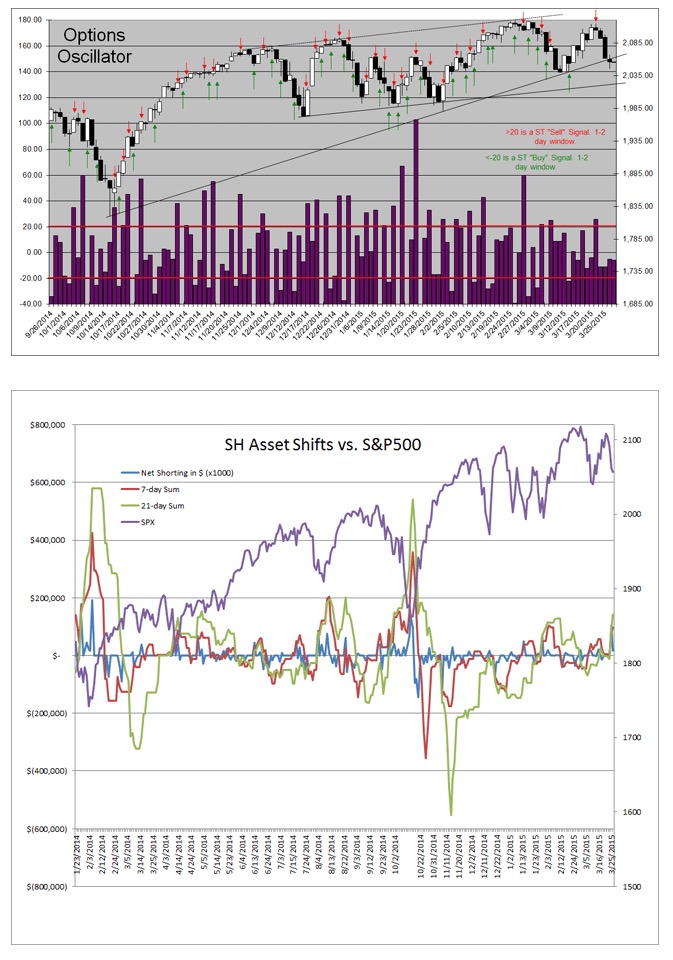
Short-Term Sentiment: Neutral. Overall Intermediate-Term Sentiment: Bearish for the market. Individual Investor Sentiment: ST Mildly Bearish for the market. IT Bearish for the market. Small Speculator Sentiment: ST Mixed for the market, and IT Bearish for the Market... Read More
Top Advisors Corner March 27, 2015 at 11:30 AM
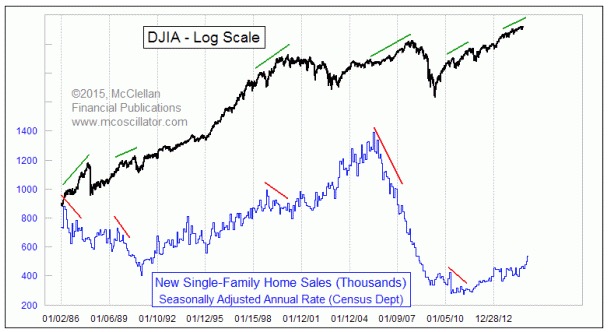
Before each of the really ugly bear markets of the past 30 years, there has been an important signal from housing data well ahead of time. We do not have such a signal now, and so that portends more upside in the months ahead for stock prices... Read More
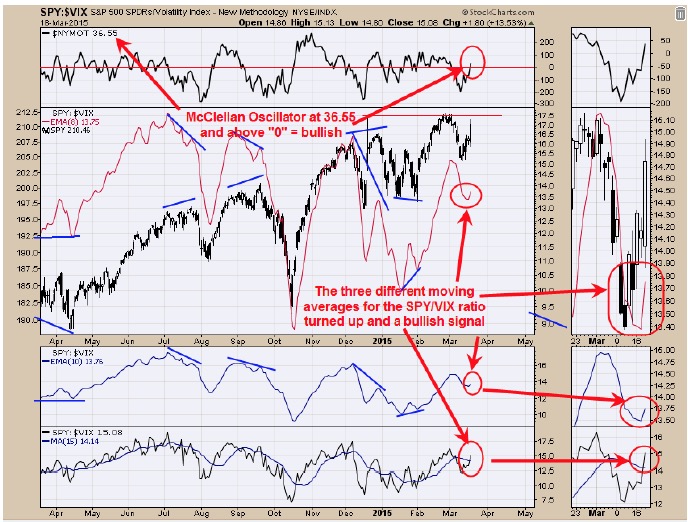
Top Advisors Corner March 27, 2015 at 11:17 AM
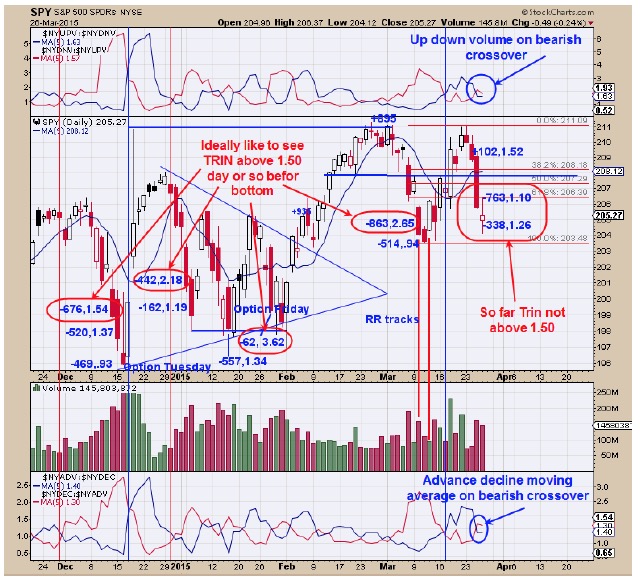
Monitoring purposes SPX; Flat. Monitoring purposes Gold: Gold ETF GLD long at 173.59 on 9/21/11. Long Term Trend monitor purposes: Flat The top window is the NYSE up volume/Down volume with 5 period MA and NYSE down volume/Up volume with 5 period MA... Read More
Top Advisors Corner March 23, 2015 at 02:00 PM
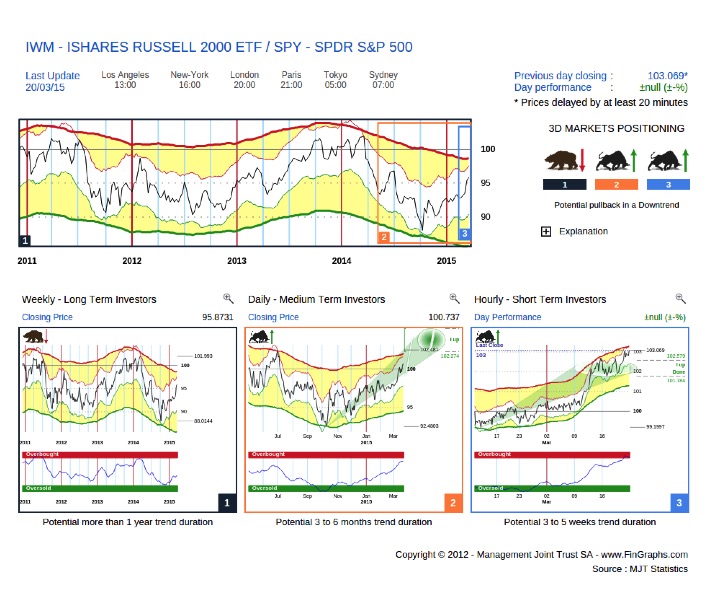
Earlier this month, in our March 2nd contribution, we set out to identify 16 ETFs for a winning strategy. Our investment horizon was the next few months, or until mid-year. During this exercise, we briefly considered SmallCaps, and especially IWM (the iShares Russell 2000 ETF)... Read More
Top Advisors Corner March 22, 2015 at 06:16 PM
Petrified Fed policy - finally entered the 'center ring' of the financial circus in the past week, as the broad audience was aghast, ecstatic, or confused, with varied interpretations one could superficially draw from the FOMC meeting... Read More
Top Advisors Corner March 20, 2015 at 03:15 PM
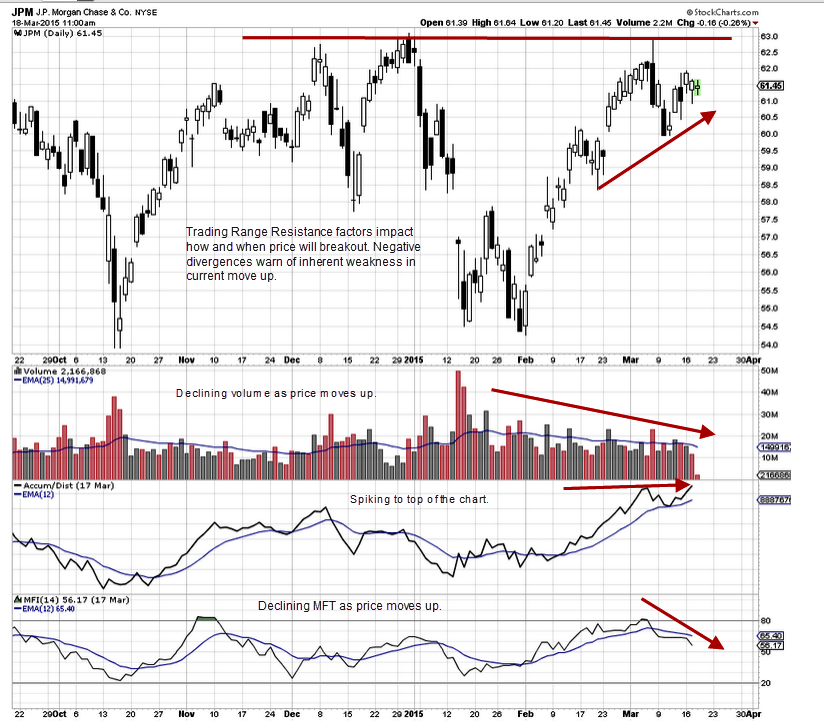
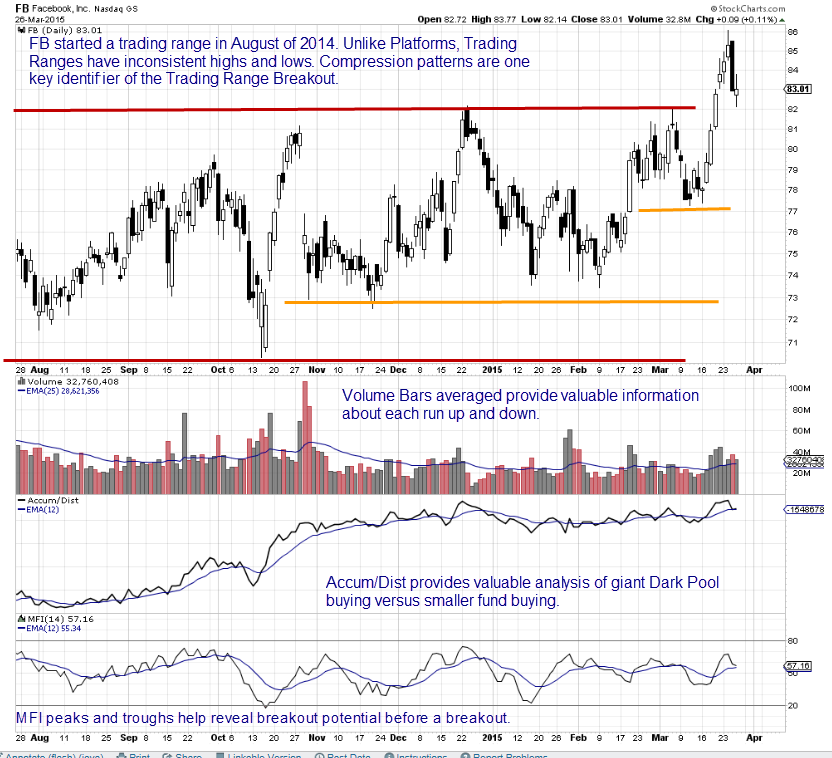
How Price And Volume Reflect Resistance Strength Support and Resistance are hugely important to retail and technical traders who are seeking to take advantage of the sudden velocity moves out of Trading Ranges and other sideways price action... Read More
Top Advisors Corner March 19, 2015 at 02:23 PM
While the debate rages over global warming, I find that the data on global average temperatures can be put to another use: forecasting interest rates. And the big message for us right now is that yields are due to hit a bottom this year, and head upward into 2017... Read More
Top Advisors Corner March 18, 2015 at 05:15 PM
Monitoring purposes SPX; Long SPX on 3/18/15 at 2099.42. Monitoring purposes GOLD: Gold ETF GLD long at 173... Read More
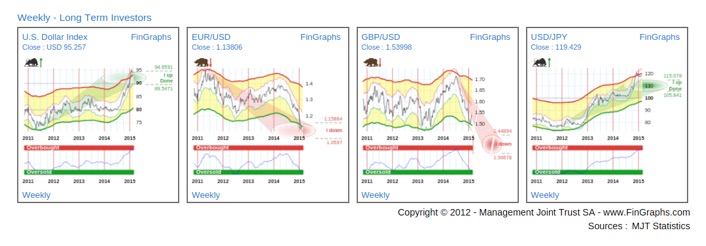
Top Advisors Corner March 16, 2015 at 01:00 PM
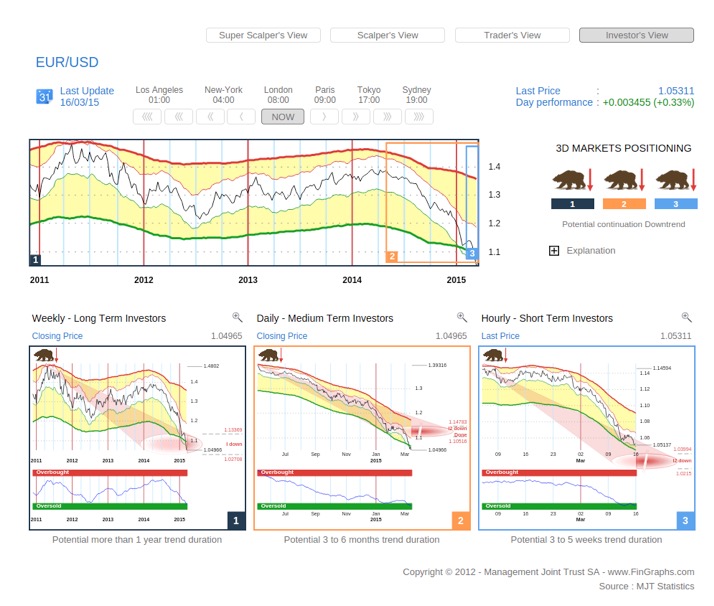
Since the end of its correction up, a year ago in March 2014, EUR/USD has lost circa 25%... Read More
Top Advisors Corner March 16, 2015 at 12:40 PM
Beware the Ides of March - indeed; as Friday proved my point of Thursday being just an increasingly-focused bearish bias shorts, able to be run-in, but with no particular follow-through on the upside... Read More
Top Advisors Corner March 16, 2015 at 12:32 PM
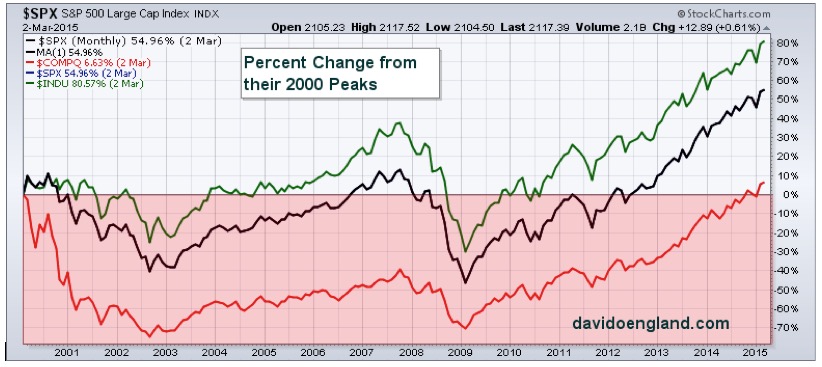
Hey Dave, “Were the new highs in March really new highs?” To answer this question, I will feature charts showing the real (inflation adjusted) value of the indexes in comparison to the actual value. Here are percent changes from their 2000 highs; DOW 80.57 percent, S&P 500 54... Read More
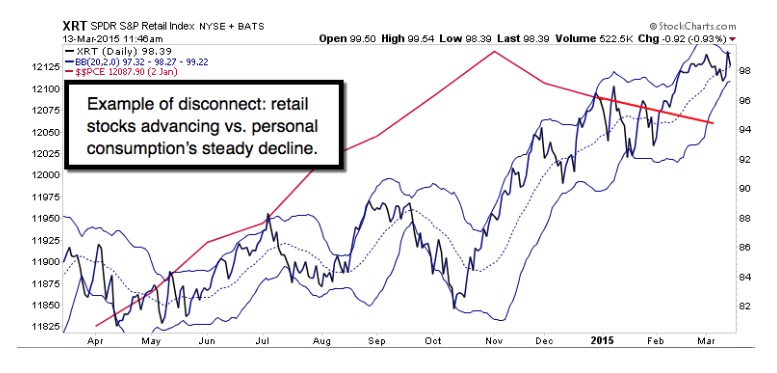
Top Advisors Corner March 13, 2015 at 04:22 PM
Downside Action In The Automated Stock Market Recently the news media for the retail side of the market stated that the correction the market was experiencing during that week was caused by “investors reaction to the dollar value rising and the risk of the Feds raising interest r... Read More
Top Advisors Corner March 12, 2015 at 01:12 PM
Monitoring purposes SPX; Sold SPX on 3/3/15 at 2107.78= gain 2.82%; Long SPX 2/3/15 at 2050.03. Monitoring purposes GOLD: Gold ETF GLD long at 173.59 on 9/21/11 Long Term Trend monitor purposes: Flat The blue numbers represent the tick closes and Trin closes... Read More
Top Advisors Corner March 11, 2015 at 11:48 AM
If you think that you know the one true relationship between the stock market and the value of the dollar, you are wrong. Or perhaps I should say more charitably that you are going to find yourself wrong about half of the time... Read More
Top Advisors Corner March 10, 2015 at 11:08 AM
The market came into Monday with the short-term, 60-min charts mostly oversold. Barely above 70 RSI on the Nasdaq and small-caps stocks, but in the mid-20's on the RSI's on the S&P 500 and Dow... Read More
Top Advisors Corner March 09, 2015 at 06:45 AM
Stocks got 'clocked' - while most of Wall Street remained mesmerized by an upcoming Apple Watch (and perhaps other devices) press briefing Monday... Read More
Top Advisors Corner March 07, 2015 at 10:00 AM
This week we revisit Europe’s equity markets. Indeed, following our contribution last week where we selected 16 ETFs for a dynamic global portfolio, some readers did highlight our limited European Equity exposure (1 single European Equity ETFs: EXS2 iShares TecDAX UCITS ETF)... Read More
Top Advisors Corner March 06, 2015 at 03:30 PM
Candlestick Price Action By Market Participants As a retail trader improves their Spatial Pattern Recognition Skills™ they are able to begin to not only recognize certain candlestick patterns as taught in the traditional Japanese Candlestick Books, but are also able to go far bey... Read More
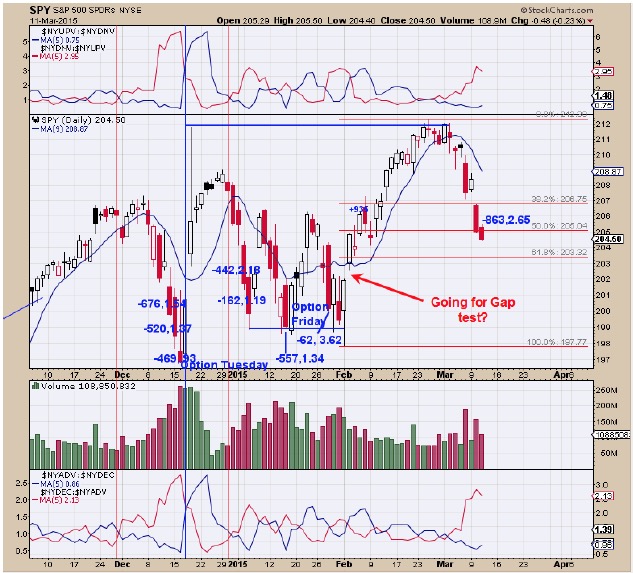
Top Advisors Corner March 04, 2015 at 02:14 PM
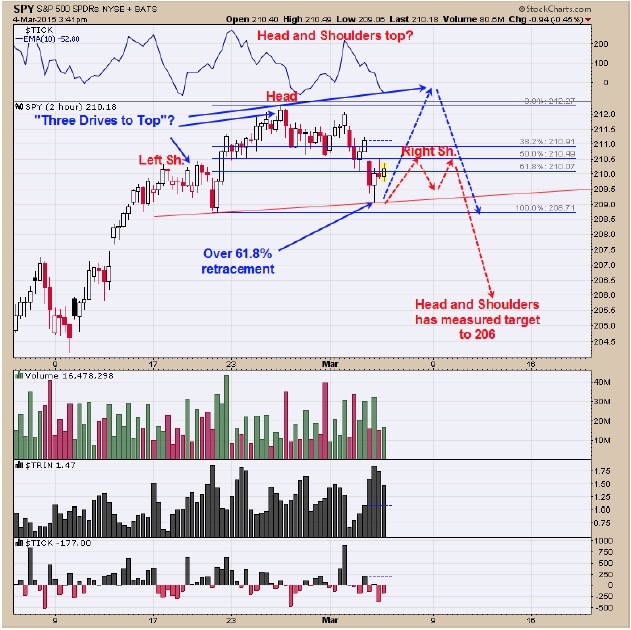
Monitoring purposes SPX; Sold SPX on 3/3/15 at 2107.78= gain 2.82%; Long SPX 2/3/15 at 2050.03. Monitoring purposes GOLD: Gold ETF GLD long at 173.59 on 9/21/11 Long Term Trend monitor purposes: Flat The chart above is the SPY on a two hour timeframe... Read More
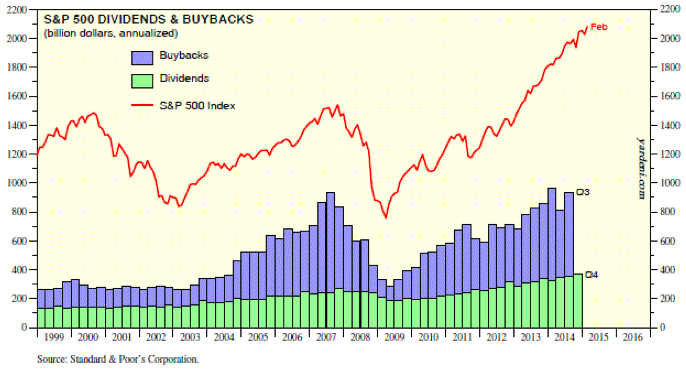
Top Advisors Corner March 03, 2015 at 11:26 AM
Rationales & Targets The extent of overvaluation now borders on the surreal. As Jesse Felder recently showed on his blog (see http://bit.ly/1FtTxjR), by several additional measures we have not previously mentioned, the U.S... Read More
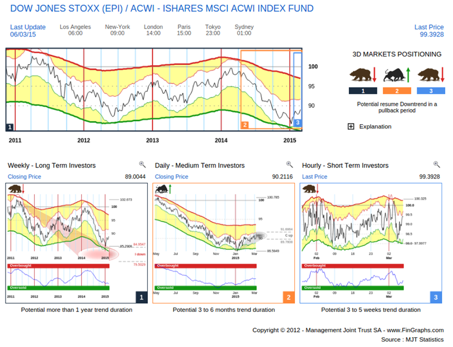
Top Advisors Corner March 02, 2015 at 02:02 PM
We set out today to create a global balanced portfolio using 16 ETFs picked from the circa 200 available on the FinGraphs.com platform. Our investment horizon is the next 3 to 6 months, or until mid 2015... Read More
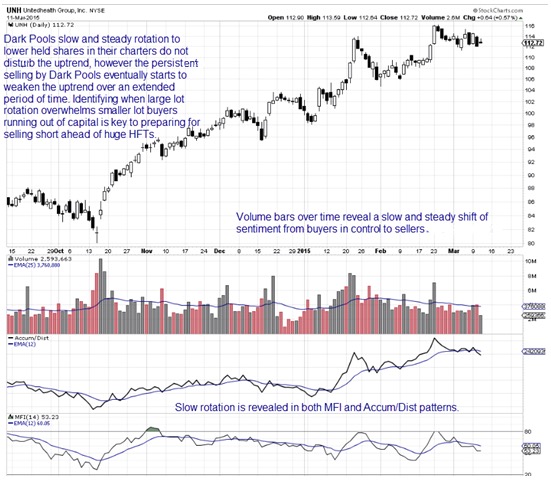
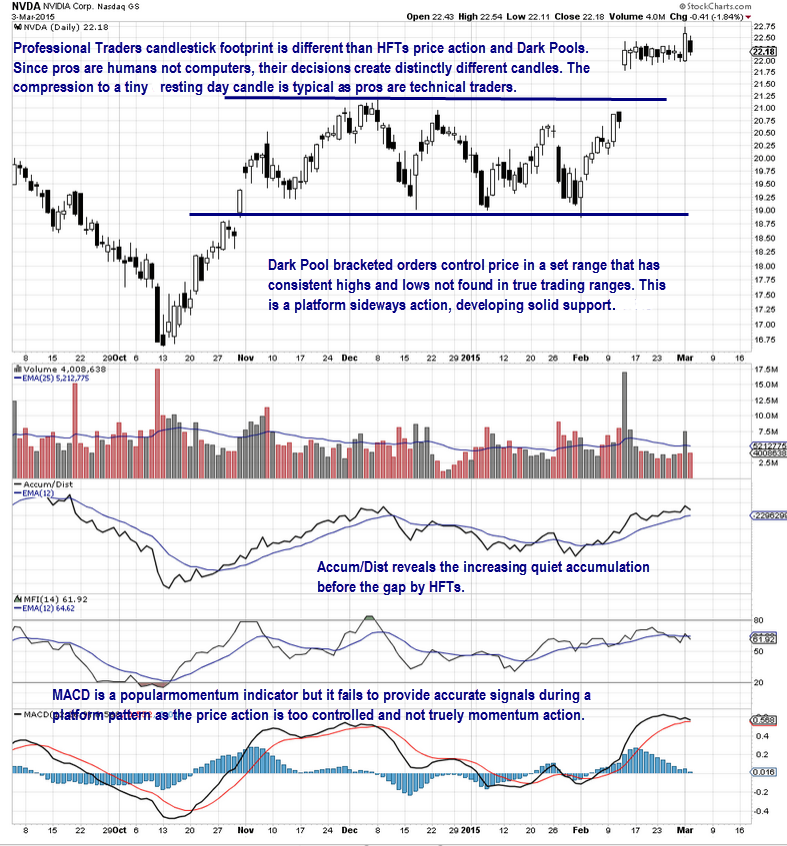
Top Advisors Corner March 01, 2015 at 10:00 PM
Market Participants And Price Action Before High Frequency Traders HFTs, Dark Pools, Twilight Pools, and an 80% automated marketplace price was the most important indicator... Read More