As US stocks have continued their relentless bull run, some of largest Asian equity markets have also continued to new highs. Equities in Japan, China and India have broken not just on a price basis, but on a relative basis as well.
Here is a chart of the S&P 500 SPDR ETF, along with the iShares MSCI ETFs for Japan, China and India.
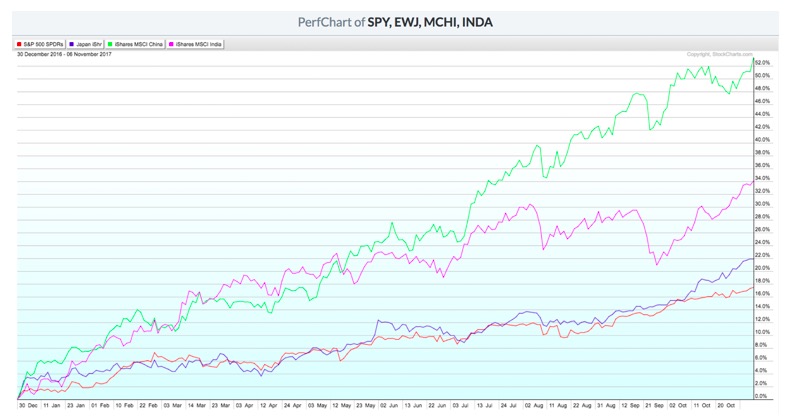
Notice that the S&P 500’s recent uptrend is at the bottom of the performance list, up just over 17% year-to-date. Japan and India follow with YTD returns of 22% and 34%, respectively. With its most recent break to new highs, the MSCI China ETF is up over 53% year-to-date.
By normalizing the chart to the SPY, you can more easily see the relative performance of these Asian markets versus the US.
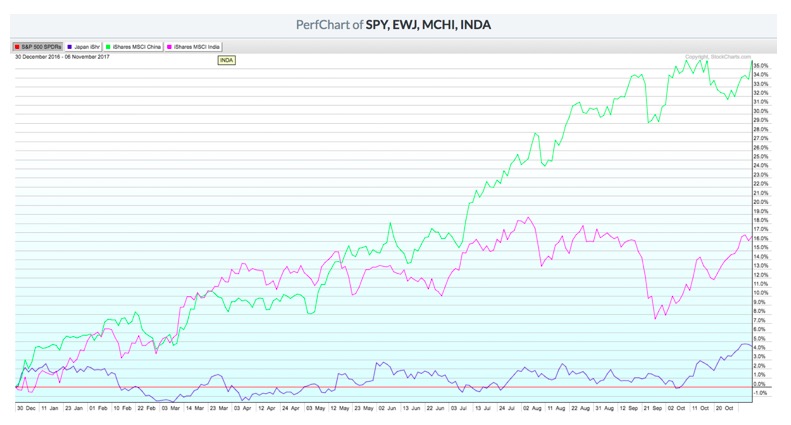
Here we can see that from the end of last year, Japan has outperformed by about 4%, India by 16%, and China by a whopping 35%. Let’s review each of these three markets from a technical perspective.
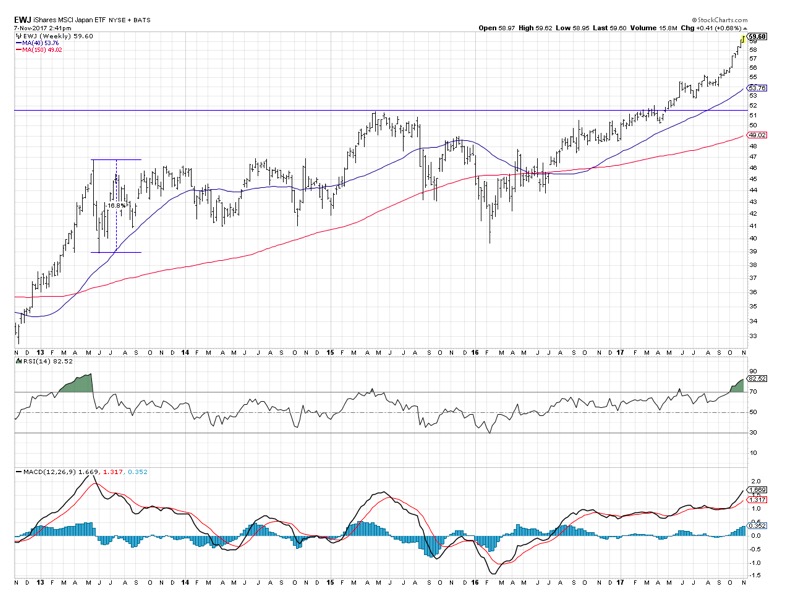
Japan broke out from a multi-year resistance level earlier this year when it eclipsed its 2015 high around 51.50. The EWJ has since continued much higher, recently reaching new closing highs for the tenth straight week.
One concern here is the weekly RSI, which has reached an extremely overbought level of 82. The last time the EWJ was this overbought was back in 2013 just before the ETF dropped over 16% in two weeks.
This is not to suggest we’ll see repeat of that price drop, but it does tell us that the EWJ is reaching the levels where you could expect a correction.
I last wrote about China in May, when I noticed the market had broken out through a key resistance level. Here was the chart we discussed:
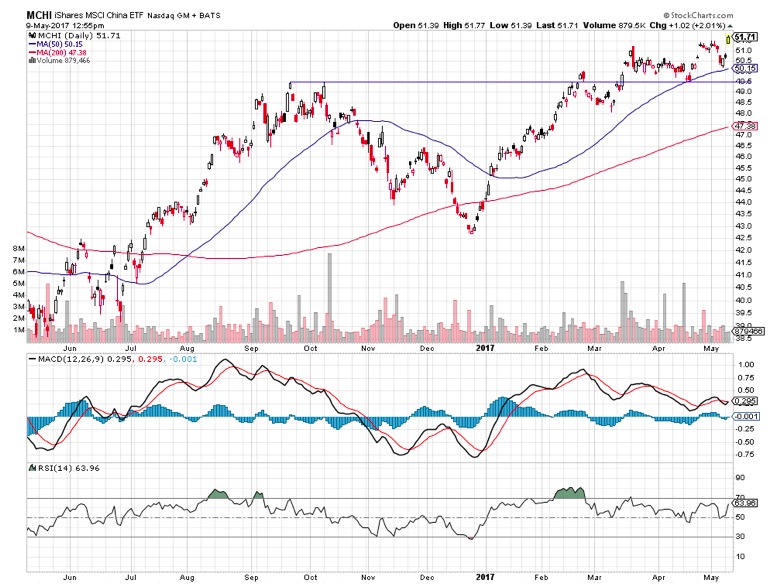 The last six months have seen MCHI rally an additional 30%, outperforming the S&P 500 by 19% since mid-May.
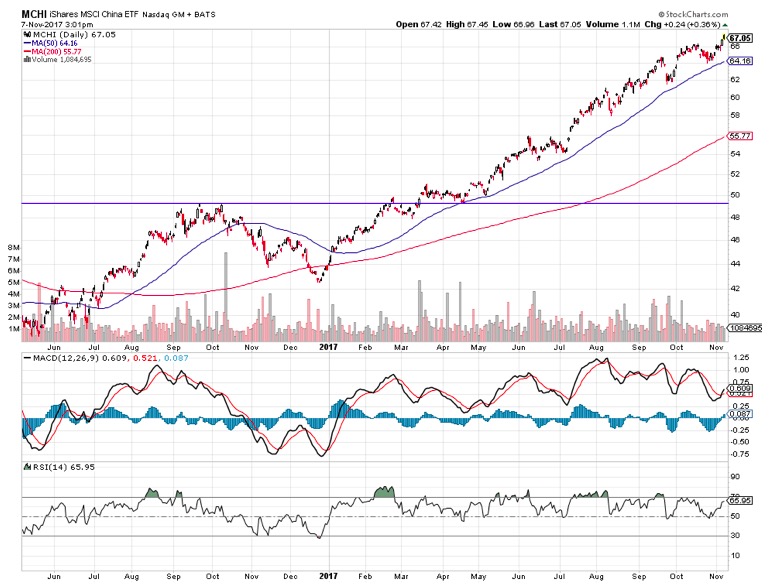
On the weekly chart, we can see the China ETF has remained overbought for the last four months. This is a great reminder that markets can stay overbought for quite a while during extended uptrends. When the RSI eventually exits the overbought condition, that will be a red flag to revisit this chart.
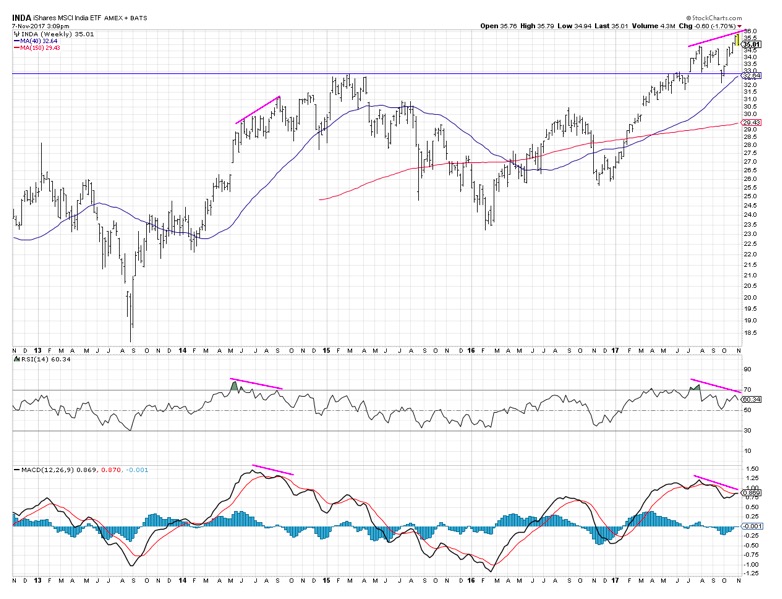
The chart of India is certainly the least extended of the three markets, with the ETF just recently eclipsing its 2015 high. Perhaps more concerning is the bearish divergence with price and the RSI and MACD indicators.
The last time we saw this divergence was in 2014. However, the India ETF continued to new highs into 2015 before the eventual top was in place. For now, until we see a lower high then a lower low in price, the trend remains positive.
Why do extended trends like this occur? One possible explanation is herding, which is a behavioral phenomenon where investors tend to pile into similar positions. As a trend continues, the fear of missing out on the next move compels people to jump in, which creates a feedback loop of higher prices.
All of these charts should serve as a gentle reminder to make yourself aware of movements in global markets. You never know where the next breakout may come from!
David Keller, CMT
President
Sierra Alpha Research LLC