SPX Monitoring purposes; Sold long SPX 9/7/18 at 2871.68=loss 1.03%: long 2901.52 on
8/31/18.
Monitoring purposes GOLD: Long GDX at 18.72 on 8/17/18
Long Term Trend SPX monitor purposes; Sold long term SPX 7/16/18 at 2798.43= gain 2.95%; Long 6/29/18 at 2718.37.
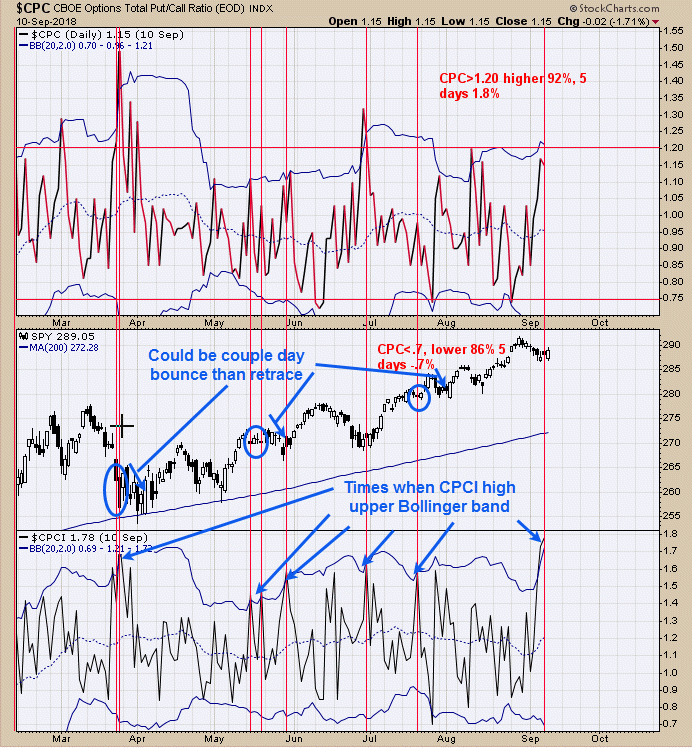
 The bottom window is the Index Put/Call ratio (CPCI). When this ratio hits the upper Bollinger band the market at least bounces. There are three times the market bounced after CPCI hit the upper Bollinger band then retraced back down and those times are March, May and July. Market can bounce here but probably will not go far and most likely will at least test the recent lows again. Could end up with a sell signal if market does bounce.
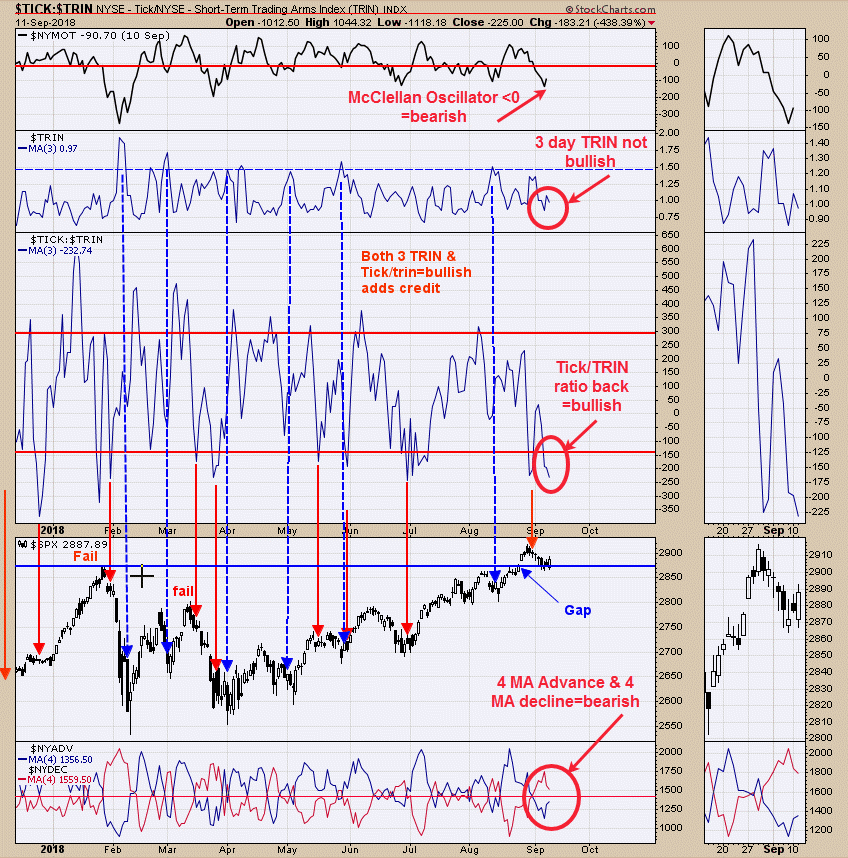
 The top window is the McClellan oscillator and readings <0 are bearish; today’s close -83. Next window down is the 3 day average of the TRIN. Market bottoms form on panic and the TRIN helps to identify those times with readings above 1.50. When the 3 MA of the TRIN reaches 1.50 and higher the market is usually near a short term low; today’s reading came in at .97 and not showing panic. Next window down is the 3 day average of the Tick/TRIN ratio. Readings below -150 on this indicator can be a bullish sign and today’s reading came in at minus 232.74. Best bullish signals are generated when the 3 MA Trin >1.50 and the 3 MA of the Tick/TRIN ratio <-150 and we don’t have that here. The bottom window is the 4 MA of the Advancing (blue line) and 4 MA of the Declining (red line). When blue line is above red line a bullish condition is present; when red is above blue then that is a bearish sign. Also the market has been down 6 days in a row going into Friday and the market has been lower 10 of 12 times on average of 3% over the next 30 days. Therefore it would make sense if market does bounce to look for a short position.
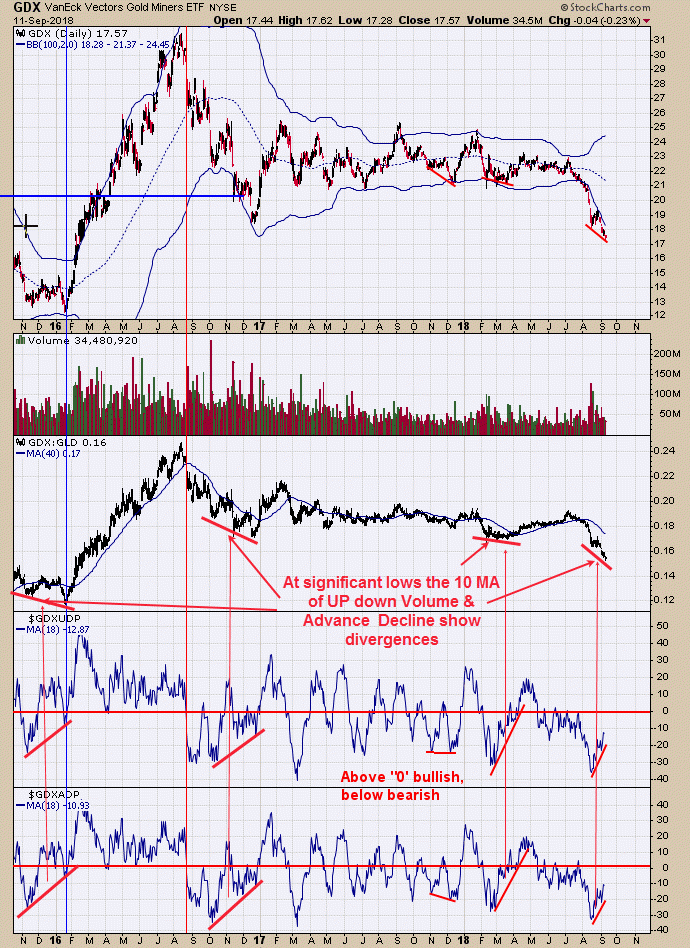
 We updated this chart from yesterday. The bottom window is the 18 MA of the Advance/Decline and above that the 18 MA of the Up Down Volume and both indicators broke to new recent highs and made higher lows as GDX was making lower lows. We went back to all major lows in GDX going back to the January 2016 low and found that they all showed major bullish divergences like we are having now. I might point out that a more ideal signal for a long position is when the Advance/Decline and Up Down volume indicators both close above “0” and that has not happened here, at least not yet. The COT commercial report for Gold, published last Friday, showed that Gold Commercials are not now net long 6525 contracts; the last time the commercials were net long came back at the 2001 gold bottom. Long GDX at 18.72 on 8/17/18.
Tim Ord,
Editor
www.ord-oracle.com New Book release "The Secret Science of Price and Volume" by Timothy Ord, buy www.Amazon.com
