SPX Monitoring purposes; Long SPX on 10/22/18 at 2755.88.
Monitoring purposes GOLD: Long GDX at 18.72 on 8/17/18
Long Term Trend SPX monitor purposes; Long SPX on 10-19-18 at 2767.78
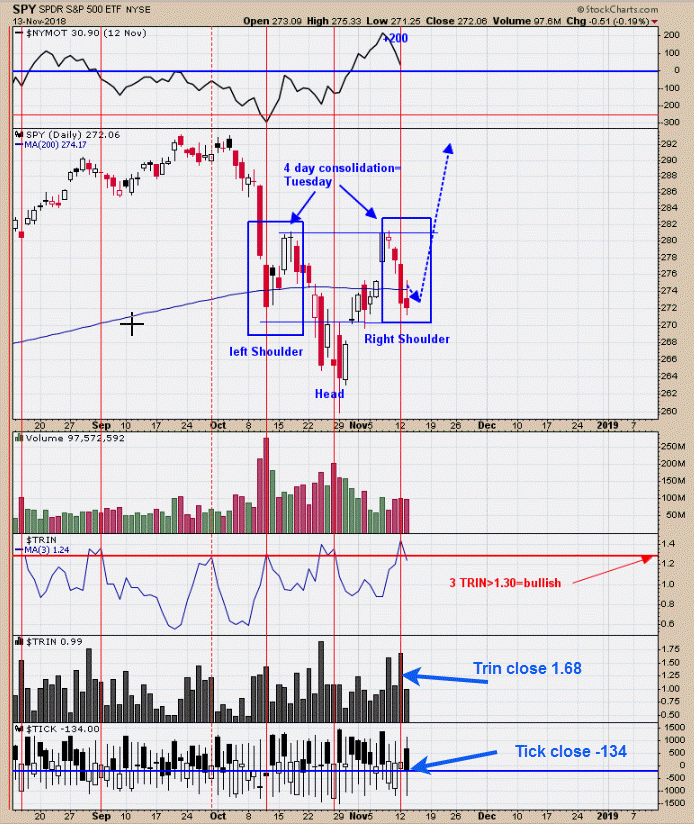
 The SPX is down four days in a row; in the last five years, 17 of 18 (94%) closed higher by 1.4% within 5 days (Ukarlewitz). The McClellan Oscillator hit a new short term high last week of +212, suggesting an initiation of an intermediate up move. For very short term, the SPY may be drawing a Head and Shoulders bottom where a “Right Shoulder” is forming now. There is symmetry both in time and price. The Left Shoulder took four days to complete and therefore the Right Shoulder could complete in that timeframe; today will mark the fourth day. This potential Head and Shoulders bottom has a measured target to the old high. The third window up from the bottom is the “three day average of the TRIN,” and readings near 1.30 and higher have marked recent lows; the reading came in yesterday at 1.41. To add to the potential bullish setup, the TRIN closed yesterday at 1.68 and the ticks closed at -134, which is a bullish combination and suggests a low may form as early as today to as late as two days later, which would be Thursday.
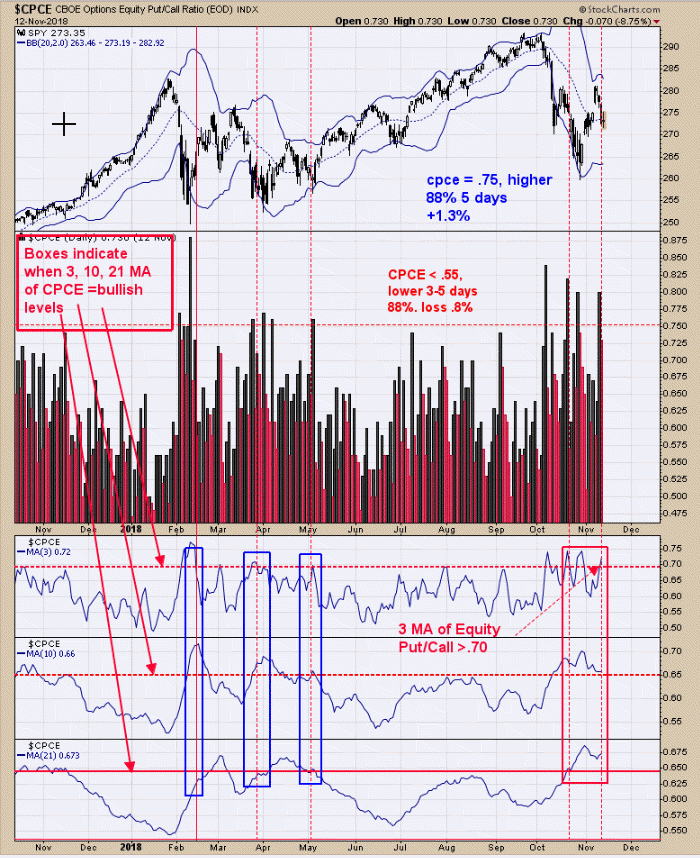
 From yesterday: “Since 1950 the change from October low through year-end average=10.7% gain (with no losses) during mid term elections years (@theonedave)….. This pull back, is expected to be short lived as the McClellan Oscillator reached over +200 last Friday, showing imitation of an up move.” Above are the equity put/call ratios for the 3, 10 and 21 period moving averages. At the lows in October, all three equity moving averages for the put/call ratios reached sentiment extremes suggesting an intermediate term rally is near. Yesterday’s 3 day average of the Equity Put/Call closed at .72 and back in bullish levels. The 10 and 21 moving period averages for the equity Put/Call ratio have remained in bullish levels thus far and so all three time periods are back at bullish levels. These sentiment indicators bode well for the market both short- and intermediate-term.
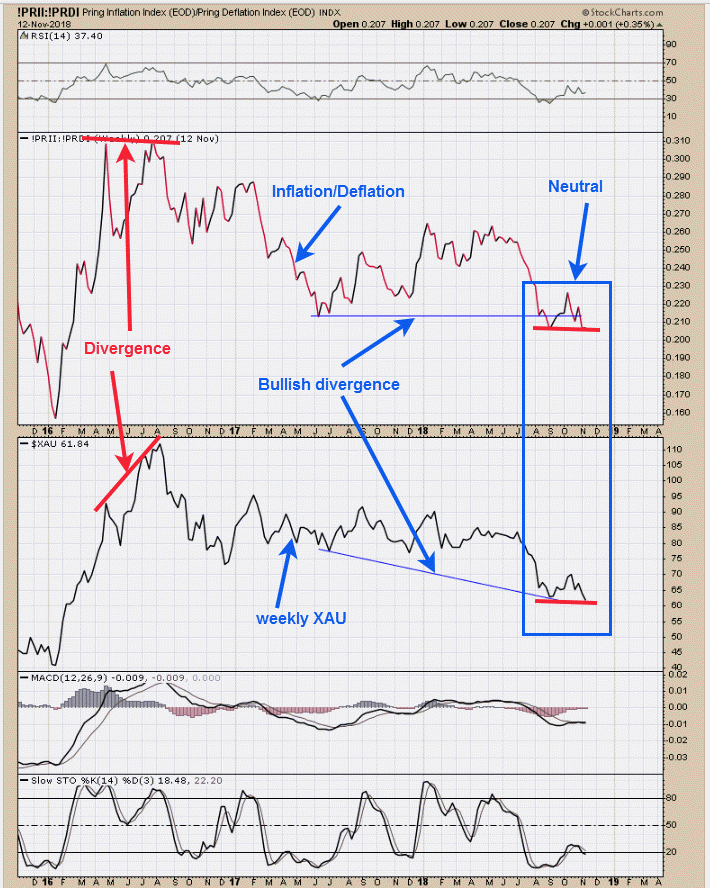
 We are looking for signs that a rally that began back in September may continue, as a longer term weekly divergence is present between the Inflation/Deflation ratio and XAU. The XAU is testing its September low now and the Inflation/Deflation ratio is also; so far there is no positive or negative divergence and not giving a clue what may come nest. We are looking for a low shortly in the SPX, and if the XAU (GDX) bottoms along with the SPX and both rally together, it will be a bullish sign for the XAU (GDX). However, if the XAU (GDX) fails to rally with the SPX, it will be a bearish sign and we may sell our long GDX position. Long GDX at 18.72 on 8/17/18.
Tim Ord,
Editor
www.ord-oracle.com. New Book release "The Secret Science of Price and Volume" by Timothy Ord, buy at www.Amazon.com.
