Market Recap for Tuesday, March 7, 2017
Next Tuesday, another FOMC meeting begins with their policy decision announced next Wednesday. Expectations are that we'll see another quarter point rate hike. It's not a slam dunk and there are some who believe we should wait to see more economic strength before raising rates again. I expect that the Fed will want to remain ahead of the curve so I'm looking for that next hike. The treasury market agrees with me. After consolidating its last rise, the 10 year treasury yield ($TNX) is again on the move higher. Here's a long-term chart:
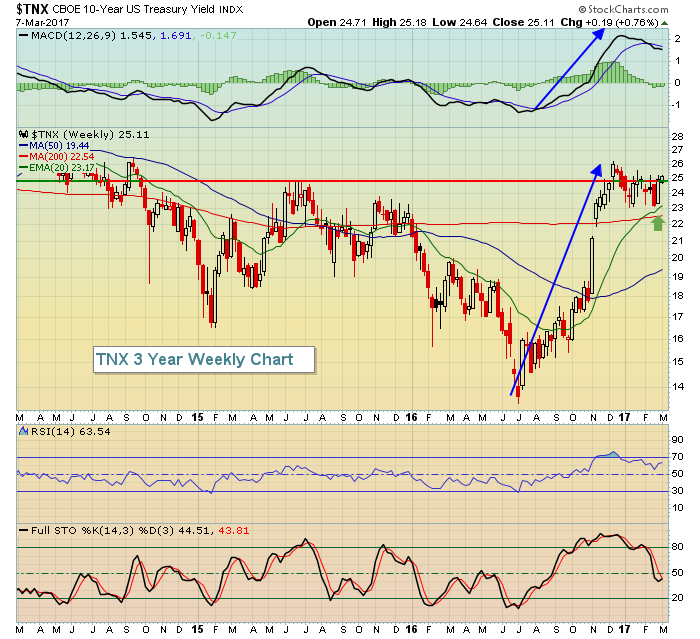 Beginning in November, treasury yields surged higher in anticipation of a series of potential rate hikes. After consolidating and moving back to rising 20 day EMA support, the TNX is on the rise again. By next Tuesday, I'm looking for the TNX to push 2.60% again. A breakout would suggest a rate hike's a certainty.
We saw additional profit taking on Tuesday as technology (XLK, +0.00%) was the only sector to avoid losses on the session. Energy (XLE, -0.89%) and healthcare (XLV, -0.70%) were the worst performers as coal ($DJUSCL) again led energy lower. Coal has fallen 30% in the past three months as price/volume trends seem to be suggesting that the longer-term downtrend has resumed. It's an ugly chart:
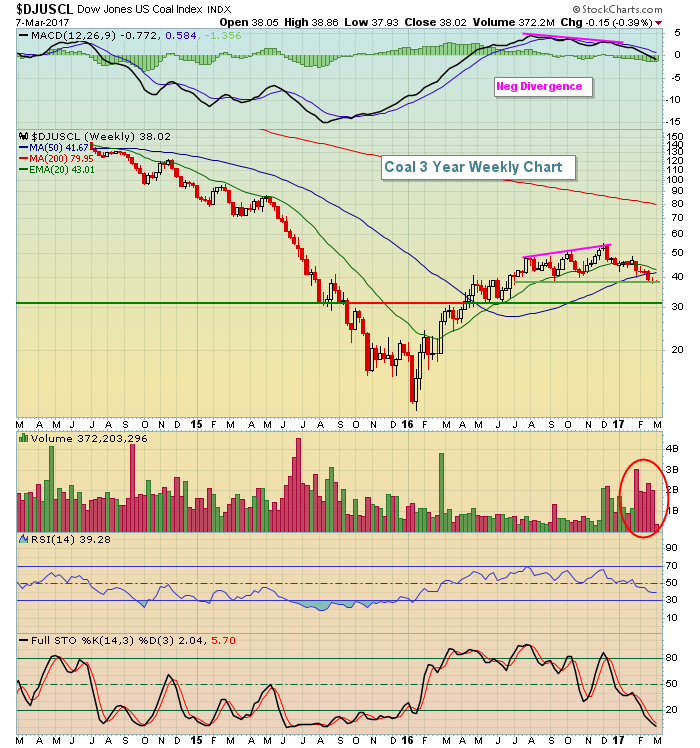 2016 was the year of the bounce for coal, but 2017 has returned to the ugliness that we experienced prior to the bounce. I've highlighted a couple levels of price support to watch on further weakness. But given the overall bullishness of the U.S. equity markets, it's difficult to suggest owning any stocks in this space.
Pre-Market Action
The 10 year treasury yield is up another 4 basis points this morning to 2.55%, its highest level since January 26th.
Asian markets were mostly lower overnight and Europe is showing fractional losses this morning as well. That's led to some earlier weakness this morning in the U.S. Dow Jones futures, however, have recovered and are now higher by 14 points.
Current Outlook
Banks ($DJUSBK) and life insurance companies ($DJUSIL) tend to perform extremely well in a rising interest rate environment so as the FOMC meeting draws near, I'd look for money to rotate once again into these two industry groups. Both recently broke out, but have been consolidating and moving down slightly to approach their rising 20 day EMAs. Here's the current view/technical conditions of both:
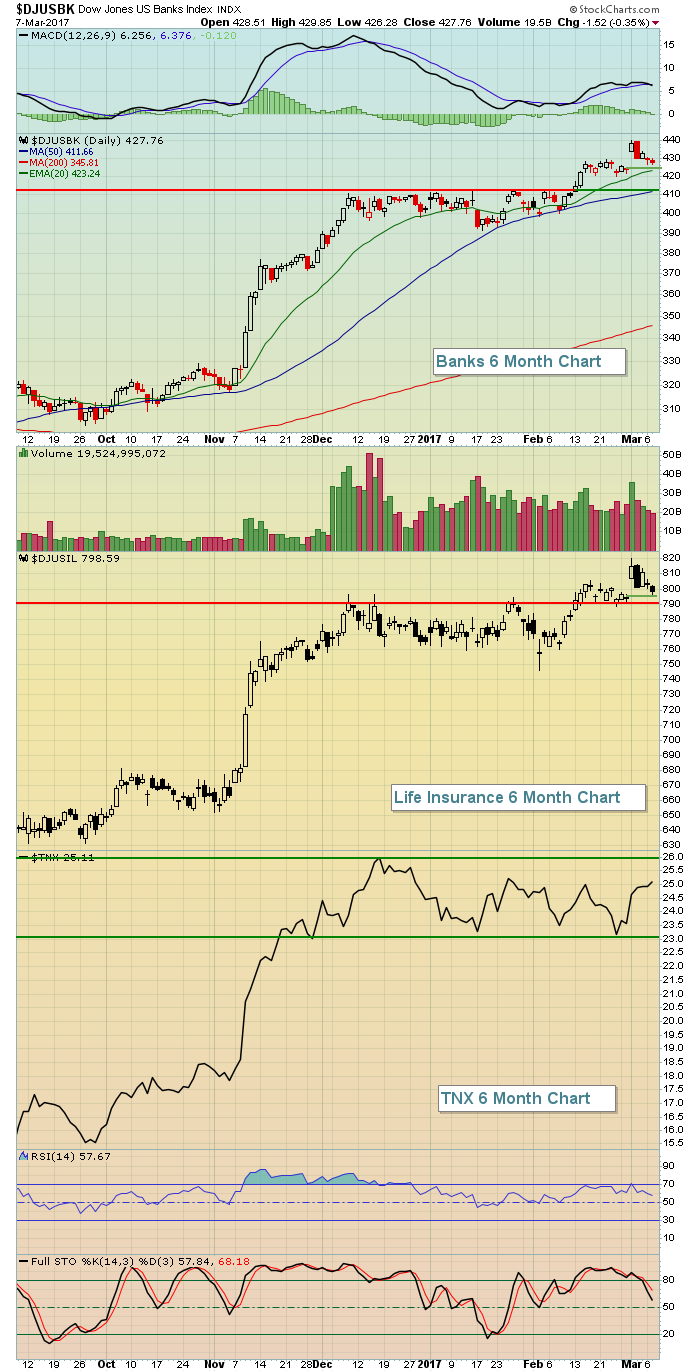 The DJUSBK and DJUSIL both broke out in anticipation of another rate hike. The TNX remains in its 2.30%-2.60% yield range, but the current consolidation is a bullish continuation pattern (flag). Expect a push through 2.60% with 3.00% a more significant yield resistance level on an intermediate-term basis. Longer-term trendline resistance is closer to 3.50%. I expect the TNX to move into that 3.00%-3.50% range later in 2017 and still remain in a long-term downtrend that dates back to the early 1980s.
Sector/Industry Watch
The Dow Jones U.S. Specialty Retailers Index ($DJUSRS) has been under selling pressure but is approaching very significant price and gap support. Check it out:
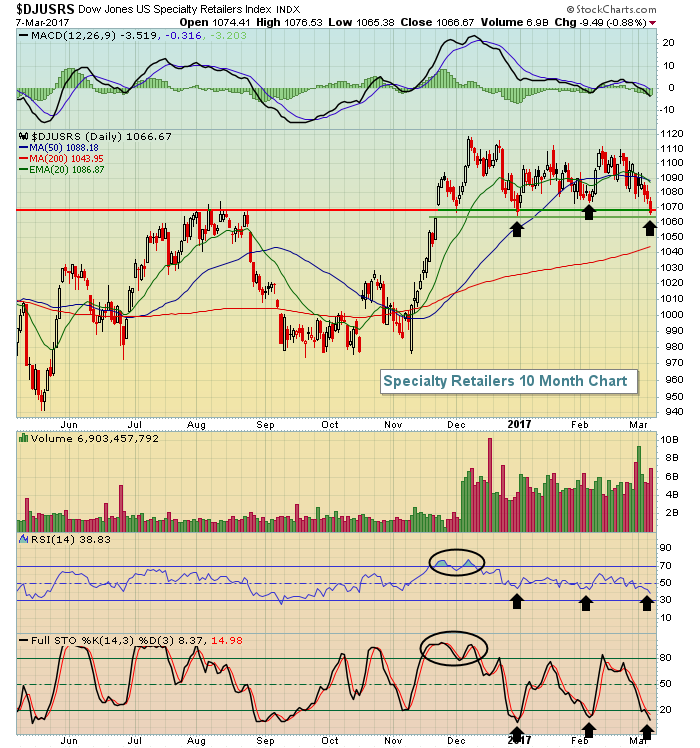 Note also that the DJUSRS was very overbought in November and December after a steep rise and needed time to consolidate. During this consolidation phase, each time the RSI and stochastic have hit the 40s and 10-20 range, respectively, a price bottom has been hit. So there's history seeing a turn back to the upside right here. And like most retail areas, the DJUSRS performs well historically in March.
Historical Tendencies
Most calendar months tend to perform much better in the first half than the second half. March is no different. Check out the historical performance of the S&P 500 (since 1950) during these two periods in March:
Annualized Returns:
March 1-18: +27.74%
March 19-31: -3.40%
The 7th to the 10th tend to be weak calendar days during most calendar months and March is also fairly consistent with this tendency as the 6th to the 9th carries a -10.32% annualized return. The March 1-18 period would reflect much more historical bullishness if we ignore the 6th to 9th weakness.
Key Earnings Reports
(actual vs. estimate):
CIEN: .18 vs .20
PLCE: 1.88 vs 1.59
TECD: 2.45 vs 2.18
Key Economic Reports
February ADP employment report released at 8:15am EST: 298,000 (actual) vs. 183,000 (estimate)
Q4 productivity released at 8:30am EST: +1.3% (actual) vs. +1.4% (estimate)
Happy trading!
Tom
