Market Recap for Friday, July 7, 2017
Dow Jones component McDonalds Corp (MCD) jumped more than 2% on Friday, extending an already strong 2017 with another all-time high closing breakout. It helped to lead a strong restaurants & bars ($DJUSRU) industry, which rose 1.26%. That, in turn, helped the consumer discretionary sector (XLY, +0.89%) post nice Friday returns after a dismal 4-5 week stretch. Here's how all three look after the close last week:
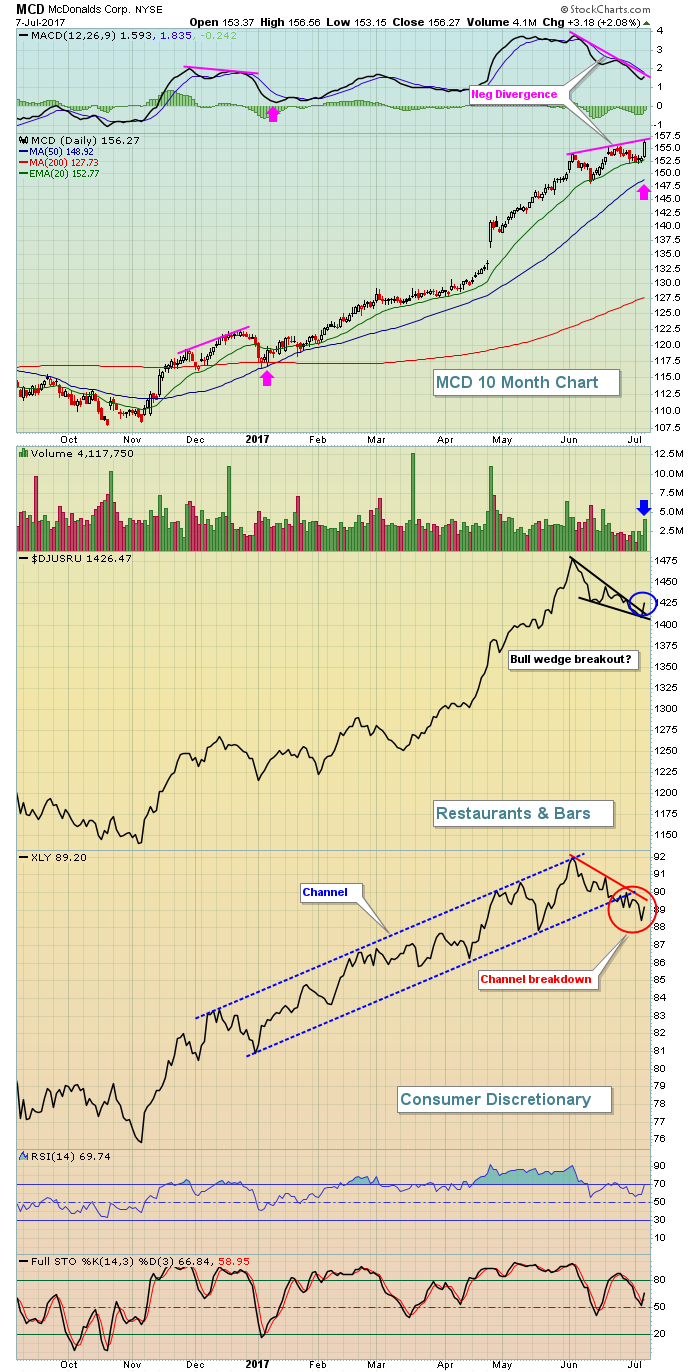 MCD easily broke out to a fresh closing high, but notice there's a lower MACD - that's a signal of slowing price momentum. Just remember that one limitation of the MACD is that it ignores volume. In my opinion, determining momentum without considering volume is a big, big mistake. The increase in volume makes the whole slowing momentum argument a bit suspicious. I'm not ignoring the negative divergence, but unless MCD closes back beneath its rising 20 day EMA, I'm not going to consider the negative divergence as a current sell signal.
Restaurants & bars turned higher after consolidating in a bull wedge for the past five weeks. It looks to have broken out of a brief bullish wedge pattern so I wouldn't be at all surprised to see further strength in this industry as we approach earnings season.
While consumer discretionary was strong on Friday, you can see that it recently broke down from an intermediate-term up channel. That's likely to lead to further consolidation with the rising 20 week EMA (not pictured) providing excellent support. It's currently at 88.27 and rising.
Technology (XLK, +1.16%) was actually the best performing sector as the bulls and bears continue to battle over the short-term direction of this influential sector. Semiconductors ($DJUSSC) and internet ($DJUSNS) were both very strong to help lead technology. Energy (XLE, -0.16%) was the weakest sector, but did manage to provide bullish clues as we head into a new trading week. See the Sector/Industry Watch section below for more information.
Pre-Market Action
Gold ($GOLD) is attempting to recover from closing at a near four month low on Friday, but the attempt is a fractional one thus far. Crude oil ($WTIC) is down slightly as the energy group will try to recover from last week's selling with headwinds from lower oil prices.
In overnight trading, the Tokyo Nikkei ($NIKK) rallied back above 20000 after testing its 50 day SMA last week. That test was important as the NIKK had printed a negative divergence on its most recent price high. Selling/consolidation down to its 50 day SMA helped to reset this momentum indicator. The Hang Seng Index ($HSI) also managed to recover from recent selling to finish last night back above its 50 day SMA.
In Europe, the German DAX ($DAX) is up 48 points at last check as this key index tries to hang onto gap and price support at 12296 and 12368, respectively. The German DAX is very positively correlated with our benchmark S&P 500, so we don't want to see the DAX lose key support levels.
Dow Jones futures are down slightly this morning, but the NASDAQ appears poised to continue the tech rally from late last week.
Current Outlook
It's always a great sign to see a strong home construction group ($DJUSHB) and this group was one of the best performing industries on Friday. DR Horton (DHI), Toll Brothers (TOL), TriPointe Homes (TPH) and Meritage Homes (MTH) all broke out to fresh new highs on solid volume to lead the DJUSHB to a 2.89% rise. Here's a look at the group, followed by the above four breakouts:
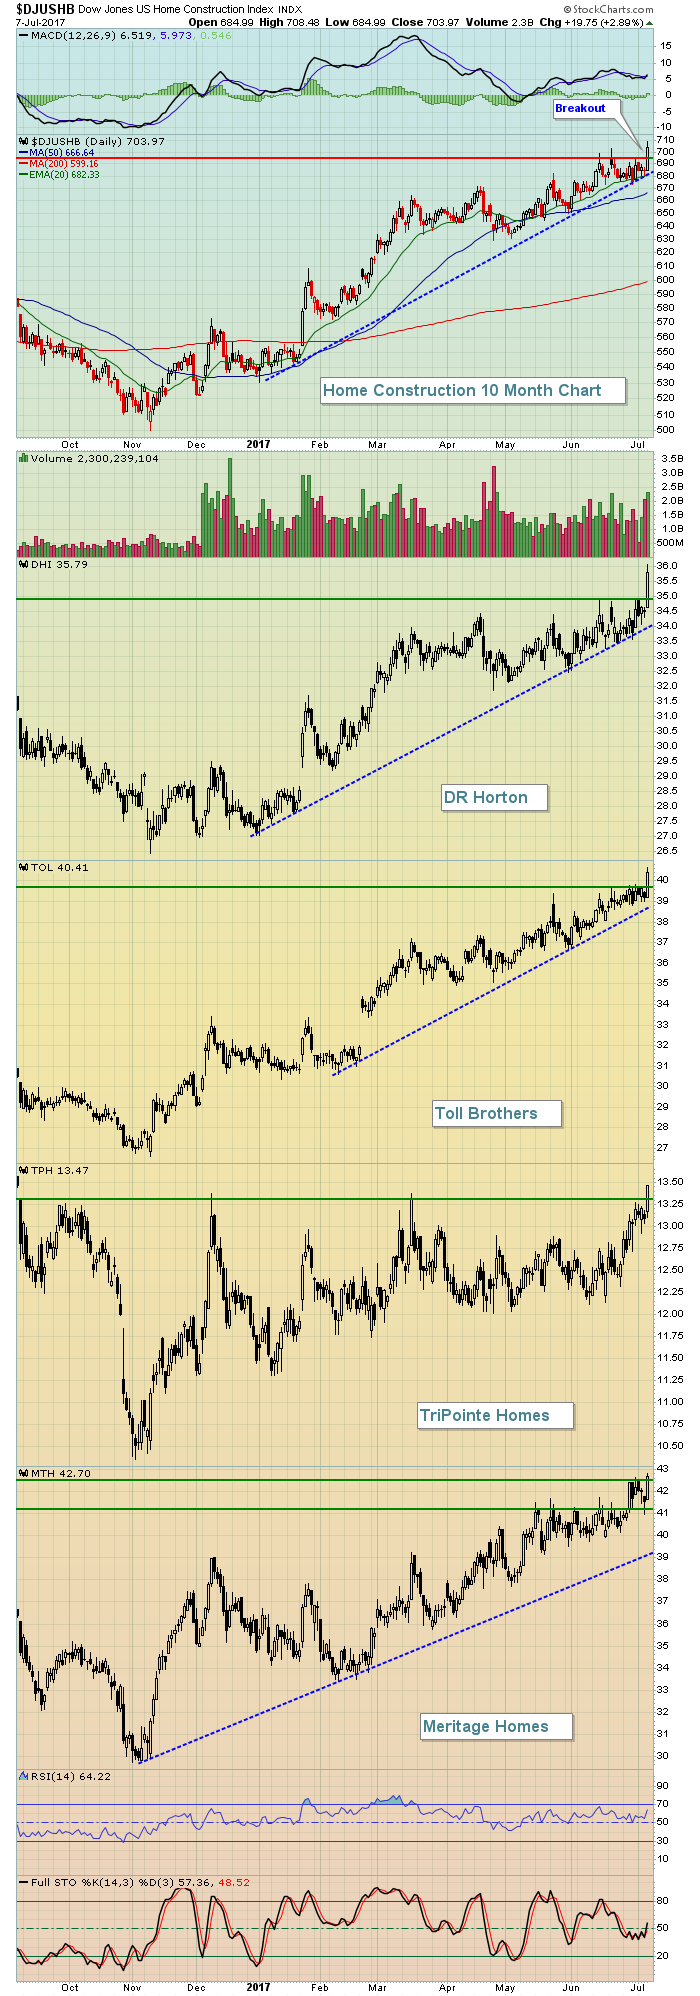 The impressive part of Friday's rally was that the DJUSHB and DHI both had negative divergences on their weekly charts. But after last week's strong push higher, those negative divergences have virtually been eliminated. Expect further strength ahead from home construction stocks.
Sector/Industry Watch
Energy (XLE) printed a bullish hammer at price support on Friday, providing increasing probability that a short-term bottom is in with the low from Friday being the key short-term support. Here's the chart:
 First, and most importantly, the 2017 downtrend remains perfectly intact so there's no intermediate-term buy signal here. However, any time I see prior price support violated intraday, only to see a recovery and price support hold by day's end, I turn more bullish in the very near-term. Friday's hammer suggests we'll likely see short-term strength in energy. An intraday low beneath 63.29 would negate this short-term buy signal and should be considered as a short-term intraday stop.
Monday Setups
iRobot Corp (IRBT) reported excellent quarterly results nearly three months ago on April 25th and the stock responded quite bullishly by surging more than 15% on the news. IRBT continued pushing higher, rising another 30% before topping on June 14th at 104.61. It then saw a rather severe bout of profit taking along with the overall tech sector, finding a low of 79.40 on Thursday. Friday's reversal was significant as it came on the heels of a 60 minute positive divergence. Check this out:
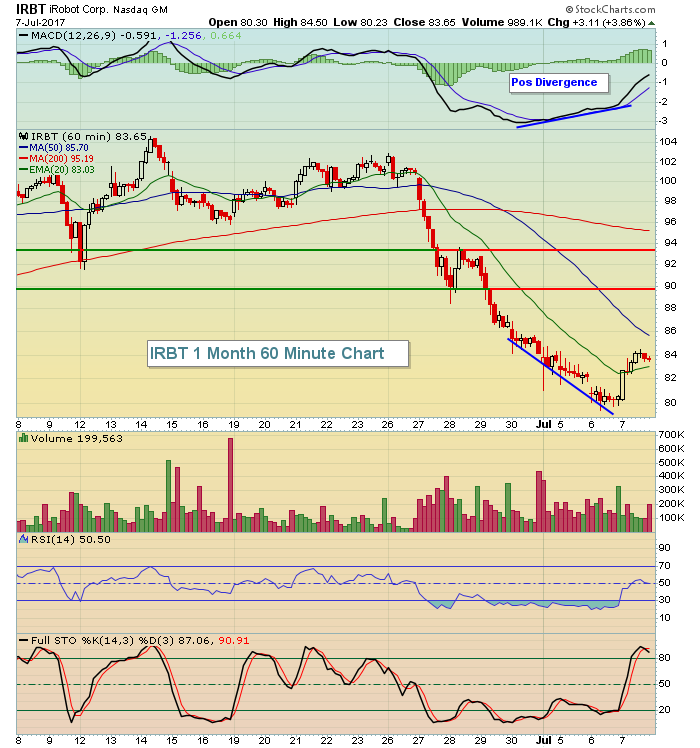 IRBT is roughly two weeks away from its next earnings report and seems poised for further gains in anticipation of another strong report. The solid reversal on Friday might be the beginning of such an earnings-related move. On the daily chart (not pictured above), the declining 20 day EMA is at 90.65, falling in the middle of the 90-93 price resistance range noted above. A move into that zone and to test that 20 day EMA should be considered a short-term target with a close beneath 80 as a stop. The reward to risk on this trade improves if IRBT falls back into the lower 80s.
Historical Tendencies
Most of us have heard the Wall Street adage, "Go away in May". I'm not a believer in that at all and my historical numbers back me up. Don't get me wrong, I'm not trying to convince you that the summer months are strong because they're not. But to just blindly get out of the market on April 30 and return on November 1st is financially irresponsible in my opinion. For instance, the NASDAQ (since 1971) has produced annualized returns in May, June and October of 10.64%, 8.83% and 9.74%, respectively. Those are solid returns and shouldn't be avoided. Instead of just blindly throwing these months into the dumpster, how about we consider the true dismal period during the summer? The July 17th close to the September 26th close has proven to be the worst time to be in U.S. equities. Over the past 46 years on the NASDAQ, this period has produced the following less than stellar annualized results:
-6.92%
This covers more than 2300 trading days, or the equivalent of nine years worth of trading data. I believe it's representative and my conclusion is that if you want to "go away", then do so next week and enjoy a 2+ month trip away from stocks (of course I won't be doing that, but it would be a much better strategy than what the talking heads would have you believe).
Key Earnings Reports
(reports after close, estimate provided):
TV: .14
Key Economic Reports
None
Happy trading!
Tom
