Market Recap for Tuesday, August 29, 2017
At Tuesday's open, North Korea and its missile test were the talk of Wall Street. By the close, traders ignored the rising tensions and instead focused on the recent better-than-expected quarterly earnings and the low interest rate environment. U.S. equities rose on Tuesday with the S&P 500 closing higher for the third consecutive session. Before you go rushing to your internet broker to push the buy button, however, realize the gains have been 4 points, 1 point, and 2 points, respectively, over the past three trading days. The S&P 500 remains beneath its 20 day EMA and the weekly negative divergences are still there. But it's still a subtle victory for the bulls, especially after the news of North Korea firing a test missile over Japan had global equities reeling in early trade.
Leaders of the reversal included industrials (XLI, +0.73%) and technology (XLK, +0.43%). Aerospace ($DJUSAS) and defense ($DJUSDN) stayed very hot with gains of 1.76% and 1.56%, respectively. Despite the strength in industrial stocks, airlines ($DJUSAR) remained under pressure with that transportation group down 20% in just the past seven weeks. It all began with a below volume breakout followed by a reversal and accompanied by a weekly negative divergence. That's the reason why the current negative divergences are so bothersome across our major indices. They don't mean we're guaranteed to see a big selloff, but further consolidation is the most probable result.
Within financials (XLF, -0.32%), real estate services ($DJUSES) continued their recent weakness and inability to climb back above its declining 20 day EMA:
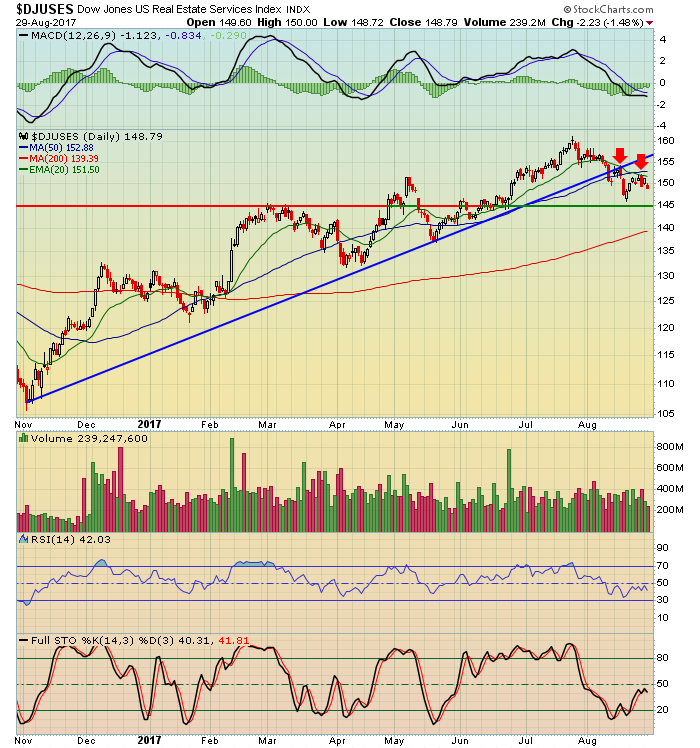 Action here suggests another test of recent price lows and prior price support in the 145-146 area.
Pre-Market Action
The market is being bolstered by rebounds in the dollar and global equity markets, as well as two solid economic reports. In Asia overnight, the Hang Seng Index ($HSI) climbed more than 300 points and back above 28000, while Europe is also gaining after a rough day on Tuesday. The German DAX ($DAX) is currently trading back above 12000.
Meanwhile, the greenback is up against virtually every other currency and we haven't seen much of that lately. The U.S. Dollar Index ($USD) printed a solid reversal on Tuesday after its intraday low hit 91.55, its lowest reading since the first week of 2015. As expected, gold ($GOLD) is retreating this morning, but remains well above key price support near 1300 and its rising 20 week EMA, currently at 1267. Those are the two key levels to watch on gold after its major breakout earlier this week.
Both the ADP employment report and the second estimate of Q2 GDP came in well above expectations. That's caused a selloff in treasuries this morning, with a spike in corresponding treasury yields, which in turn is creating the bid for the U.S. dollar.
With 30 minutes left to the opening bell, Dow Jones futures are down by 13 points, although action in pre-market had been mostly bullish until the last 20-30 minutes or so.
Current Outlook
Are we consolidating? Are we simply pulling back before the next leg higher? How do we tell if the market is trending or if it's trendless? Well, the weekly negative divergences suggest to me that we are more likely going to remain in a trading range for awhile. So that's how I approach equities right now - with little expectation of breaking out. I tend to trade quicker and, if I have profits in a trade, I'll exit first and ask questions later. One of my key goals during pullbacks or trendless periods is to preserve capital. That's accomplished by trading fewer positions, entering positions at multiple locations, trading primarily in the healthiest sectors and industries, maintaining stops and taking smaller profits. My profit expectations are reduced and my stops are tight.
Right now, action appears to be trendless. Many times during trendless markets, we'll see the RSI dip back into the 30s, as opposed to holding in the 40-50 range where we typically see uptrending stocks reverse during bouts of profit taking. Also, the 20 period moving average fails as support/resistance more often than not, rendering that technical tool useless. Let's take a look at the Russell 2000 as an example of how extended sideways consolidation can frustrate traders:
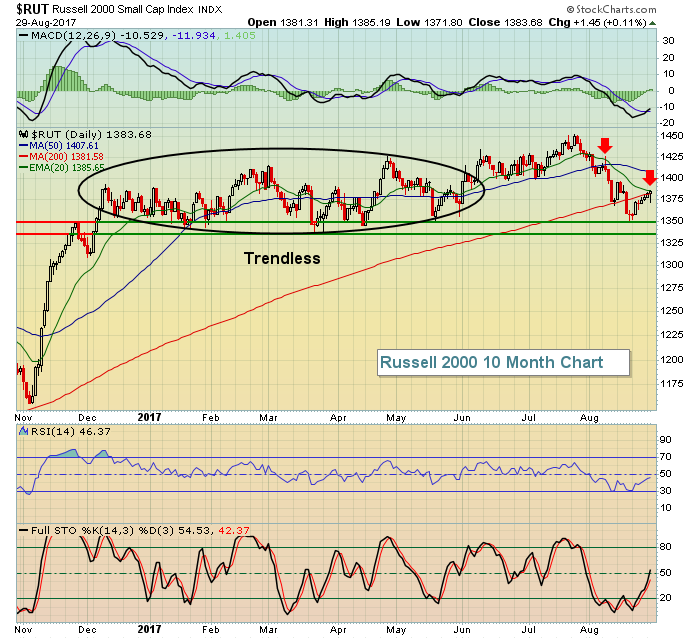 The Russell 2000 has been downtrending over the past month and there are failed tests of the declining 20 day EMA to prove it. But a break above that 20 day EMA could suggest a reversal of the downtrend OR a resumption of the trendless market that the Russell 2000 experienced during much of the first half of 2017 (black ellipse above). The number of crosses above and below the 20 day EMA was quite high. When the 20 day EMA no longer acts as support nor resistance, you're in a trendless market. So one question today will be whether small caps can negotiate that declining 20 day EMA. Failure to do so would likely lead to another support test between 1335-1350.
Sector/Industry Watch
Transportation services ($DJUSTS) is an industry group that's turning much more bullish in my view. From its low to its high in 2016, the DJUSTS advanced roughly 75%. For the past ten months or so, it's consolidated and a prior weekly negative divergence has been resolved as a result of the price consolidation. I look for a test of the double top highs in 2014 and 2015 just above the 270 later this year. Check it out:
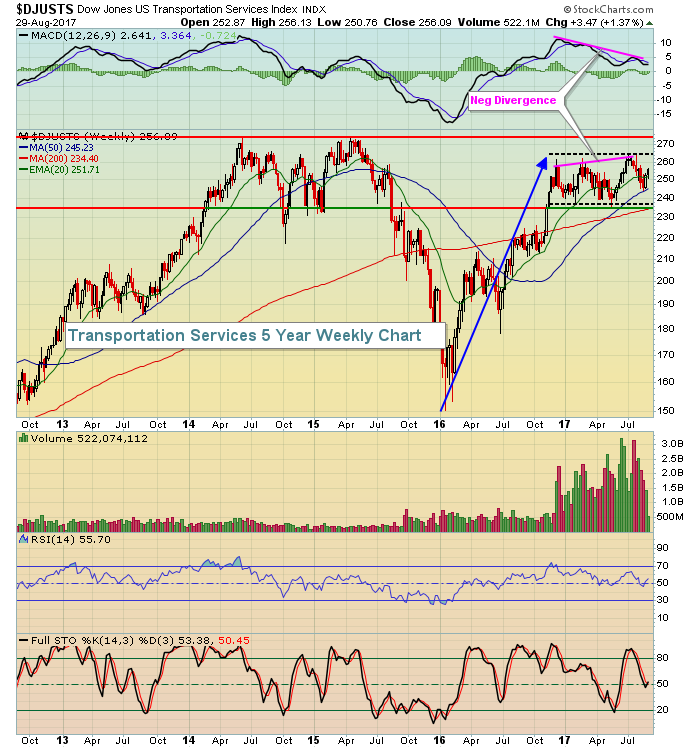 Stocks within the DJUSTS that show relative strength are solid trading candidates, although I'd be careful if the highs above 270 are tested. Make sure the group is able to successfully negotiate multi-year price resistance before taking additional risks.
Historical Tendencies
We're in the sweet spot for calendar month performance from the 28th of one month through the 6th of the following month. That period doesn't perform as well from August 28th to September 6th, but I never question advances during this period as money flows and the anticipation of money flows tends to drive prices higher this time of the month.
Key Earnings Reports
(actual vs. estimate):
ADI: 1.26 vs 1.15
(reports after close, estimate provided):
CTRP: .00
WDAY: (.39)
Key Economic Reports
August ADP employment report released at 8:15am EST: 237,000 (actual) vs. 185,000 (estimate)
Q2 GDP second estimate: +3.0% (actual) vs. +2.8% (estimate)
Happy trading!
Tom
