Market Recap for Tuesday, August 22, 2017
All nine sectors advanced on Tuesday to lead a broad-based advance on Wall Street. The NASDAQ and Russell 2000 were the top performing indices, but the S&P 500 also saw a gain of nearly 1% and the Dow Jones bounced nearly 200 points after successfully testing 21650 price support. But let me caution that we are now range bound and the S&P 500 has seen 5 crosses of its 20 day EMA in the month of August. Technology (XLK, +1.49%) has been the leader in 2017 and was the leader once again on Tuesday. This bounce could be setting up a topping head & shoulders pattern. First, let's look at a three month daily chart of the XLK:
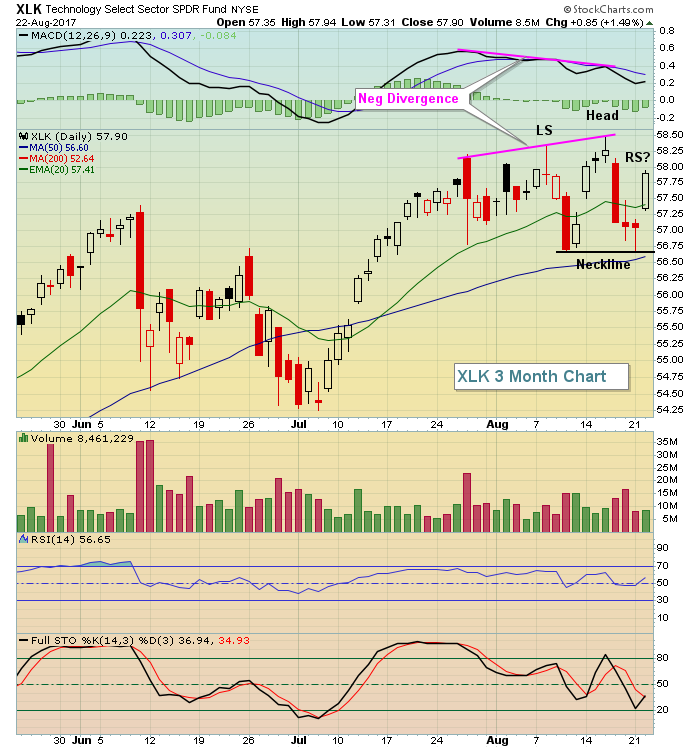 There's a chance that the current bounce is doing nothing more than establishing a right shoulder. The key will be whether the recent double bottom holds near 56.70. If it doesn't, the measurement would be down to roughly 54.75, not far from the price support established in early July at 54.25.
Defensive stocks mostly lagged yesterday, but biotechnology ($DJUSBT) did rebound to lead the healthcare sector (XLV, +1.21%) to nice gains.
Pre-Market Action
The 10 year treasury yield ($TNX) has once again dipped beneath 2.20% and gold ($GOLD) is up 4 bucks to $1295 as it again approaches major price and trendline resistance at $1300.
Crude oil ($WTIC) is down slightly as are most global indices.
New home sales will be out at 10:00am EST and the market is anticipating the number to be 610,000. Our indices could use another lift from home construction ($DJUSHB) stocks. We'll see. With 30 minutes left to the beginning of a new trading day, Dow Jones futures are lower by 66 points.
Current Outlook
With so much recent back and forth action on the daily chart, I sometimes will look to the hourly chart to help define the highest likelihood for short-term price direction. It's still somewhat confusing, but here's a 2 month hourly chart of the S&P 500:
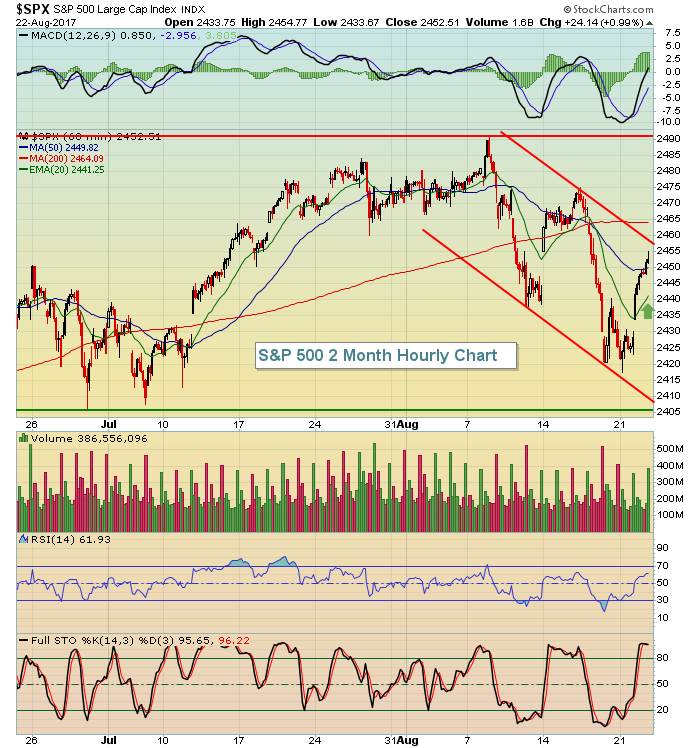 There is a semblance of a down channel in play and this morning's weak futures play right into that pattern. Clearly, the two big levels are price support at 2405 and price resistance at 2491. Expected volatility ($VIX) tumbled 14% on Tuesday to finish at 11.35 and that level of expected volatility historically favors the bulls. But we have to keep in mind that the bigger picture includes weekly negative divergences that potentially favors the bears for the next 4-6 weeks.
In the very near-term, I'd watch for two things. First, to the downside, does the rising 20 hour EMA (green arrow) hold as support on this morning's weakness? Second, does the upper channel line hold back the bulls during short-term rally attempts. Whichever of those two occurs first, that's the more likely short-term direction until one of those more significant support/resistance levels are tested.
Sector/Industry Watch
Aluminum ($DJUSAL) rose more than 3% on Tuesday and is nearing a major breakout. Here's the chart:
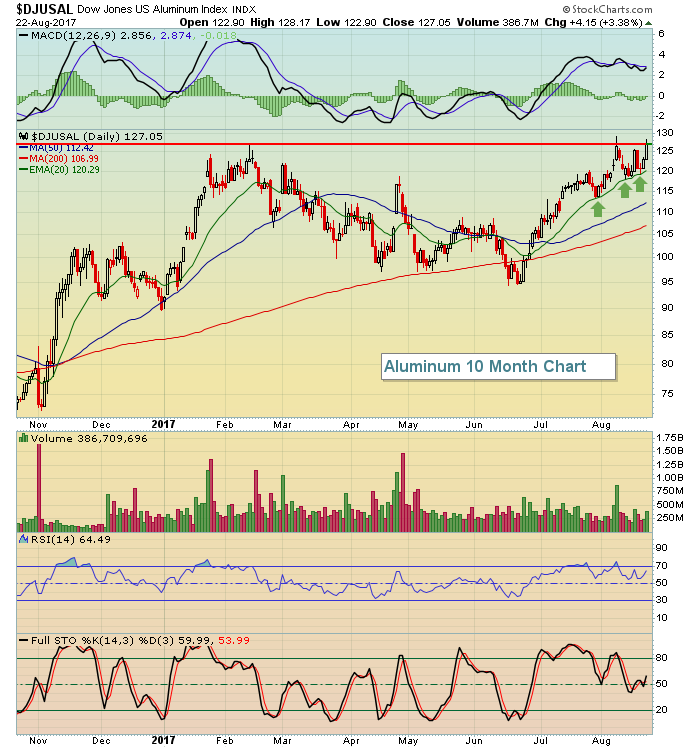 The action leading up to this test of price resistance at 127 has been quite bullish, as each pullback has successfully tested the rising 20 day EMA. If there's one reason for trepidation, it's the negative divergence that's emerged on this most recent price high. Should the DJUSAL continue pushing higher, it's quite possible that we'll see a higher MACD eliminate that divergence issue.
Historical Tendencies
Ulta Beauty, Inc. (ULTA) is a stock to consider as we approach the month of September. First, check out the seasonal tendencies for the stock over the past 11 years:
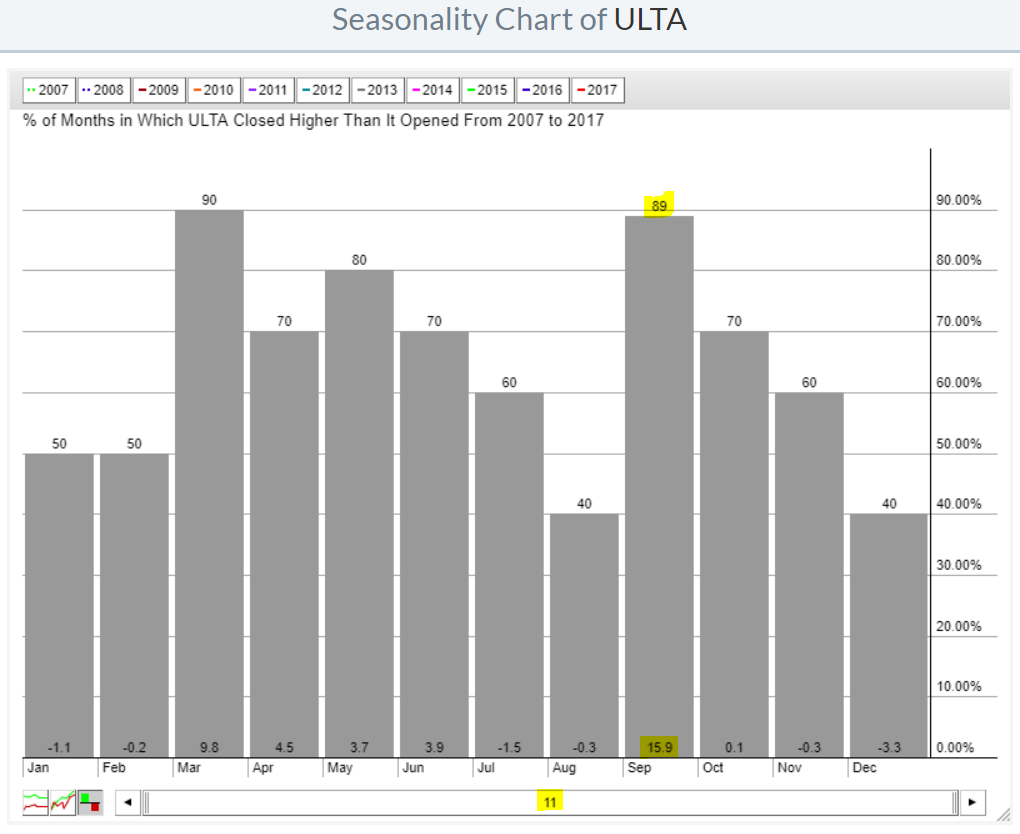 Perhaps it's due to back to school? Whatever the reason, ULTA loves September and September loves ULTA. While ULTA has been mired in a very long slump technically, falling more than 25% in less than three months, it's showing signs of slowing selling momentum and nearing a key price support level to boot:
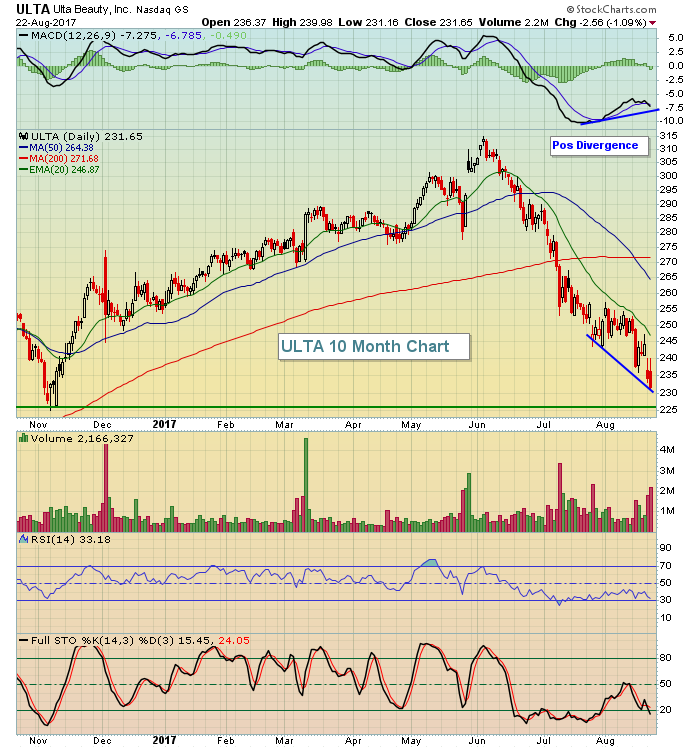 It seems it could be worth taking a chance on ULTA, especially if it prints a reversing candle near key price support at 225-227. ULTA is the best performing stock in the NASDAQ 100 historically during the month of September so using the summer weakness to set up a long trade in September makes sense not only from a seasonal perspective, but also from a reward to risk perspective.
Key Earnings Reports
(actual vs. estimate):
LOW: 1.57 vs 1.62
RY: 1.41 vs 1.36
(reports after close, estimate provided):
HPQ: .42
PVH: 1.65
Key Economic Reports
August PMI composite flash to be released at 9:45am EST: 54.3 (estimate)
July new home sales to be released at 10:00am EST: 610,000 (estimate)
Happy trading!
Tom
