Market Recap for Friday, August 25, 2017
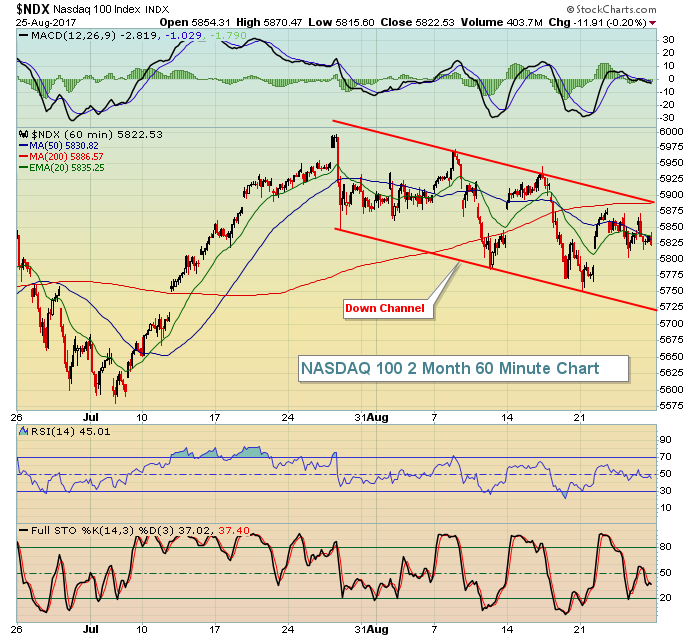
Selling in the final hour on Friday contributed to bifurcated action where the NASDAQ tumbled into negative territory while the Dow Jones, S&P 500 and Russell 2000 all managed to hang onto meager gains. Our major indices remain in a downtrend as can be seen on the NASDAQ 100 here:
 The late selling on Friday simply adds to the short-term bearishness in the market. Technology (XLK, -0.02%) was the only sector to finish with a loss on Friday and the late day selling in semiconductors ($DJUSSC) and internet ($DJUSNS) was the primary reason. The latter has been mired in a downtrend for weeks and it's likely to continue. Here's the latest hourly chart on the DJUSNS:
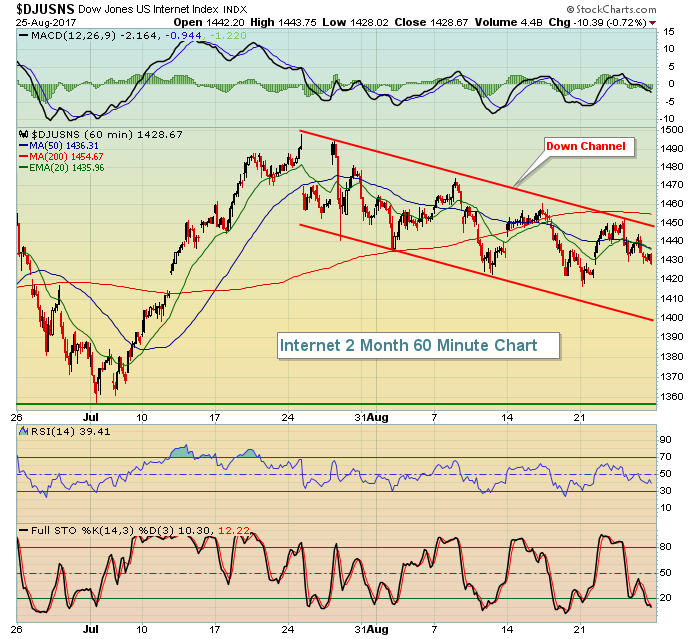 The rising 20 week EMA on the DJUSNS is at 1398 so another test of that lower downchannel line would also be testing major moving average support on the longer-term weekly chart. A bounce from there should be expected, even if just temporarily.
Industrials (XLI, +0.48%) were the best performing industry group on Friday as the bounce in transports aided the XLI. Despite the Friday gain, the XLI remains below its 20 day EMA, which in turn is below its 50 day SMA. The short-term environment in industrials is weak so look for continued selling at that falling 20 day EMA as reflected below:
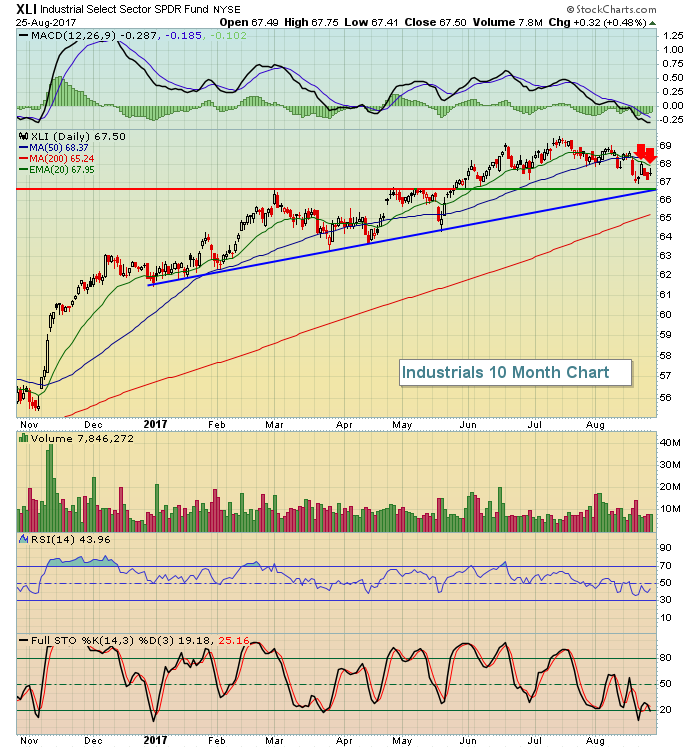 Key trendline and price support intersect near 66.50. Should the XLI violate this level of support, it's likely because the short-term selling has turned into intermediate-term selling - a clear sign to grow much more bearish during the month of September.
Pre-Market Action
The 10 year treasury yield ($TNX) is flat this morning, while gold ($GOLD) is once again testing price and long-term trendline resistance near $1300. Hurricane Harvey delivered a major blow to the Texas coast over the weekend with crude oil ($WTIC) currently down nearly 1% in reaction. Asian and European markets are mixed and U.S. futures are fractionally higher to begin the week. Dow Jones futures are up 31 points with a little more than 30 minutes left to the opening bell.
Current Outlook
Down channels and bifurcation are the bulls biggest enemies right now. There are long-term weekly negative divergences just about everywhere and while the overall selling hasn't been intense, we have seen enough bouts of selling to establish channels that are threatening bull market progress. All of our major indices have been printing lower highs and lower lows over the past month or so and that can easily be seen visually. Have a look at the benchmark S&P 500:
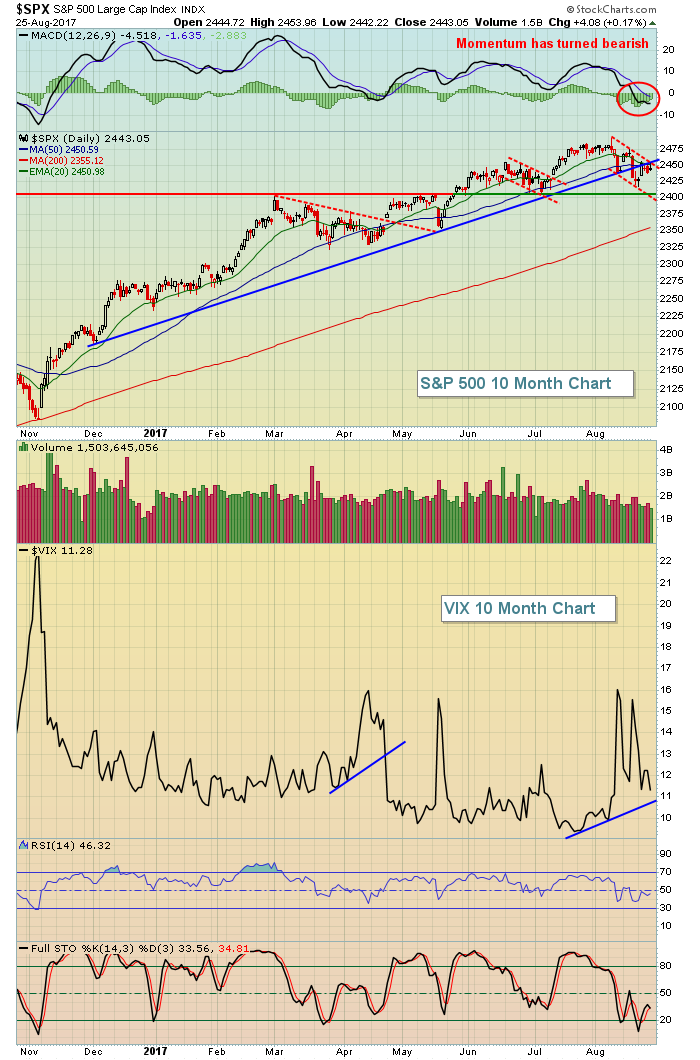 The lows on the VIX are rising, suggesting that there's growing fear and skepticism in the market. That type of environment can lead to swift bouts of selling so the bulls are looking for two indications to resume the bull market. First, they're looking to break the current down channel - just as they did the downtrend in April and the down channel in July. Second, they're looking to change the environment from growing skepticism (rising VIX lows) to more complacency (break the VIX uptrend line as was done in April with the price downtrend break).
It would seem as if the bears really have a chance here. The daily MACD is showing the most bearish momentum in 2017. The VIX is in an uptrend. The 2017 uptrend line on the S&P 500 has been broken. Transports ($TRAN) hit their lowest level in three months on Thursday, before an oversold bounce on Friday. There are negative divergences nearly everywhere on the weekly charts. And we're in the midst of the two most bearish months historically - August and September - of the year. If the bears cannot seize control now.....then when?
Continue to be cautious in the near-term (next 3-5 weeks), or at least until the bulls can negotiate key levels of channel resistance.
Sector/Industry Watch
Transports ($TRAN) are always an interesting group to watch. If the stock market is truly anticipating a strong or improving economy in the weeks and months ahead, transports should perform well as delivery of more goods should translate into higher stock prices. Currently, the TRAN is consolidating. I don't find it particularly bullish or bearish, more neutral than anything. There was a negative divergence in play on the weekly charts and I believe that's at least partly contributed to recent relative underperformance in this area of the market. Take a look at the current technical picture:
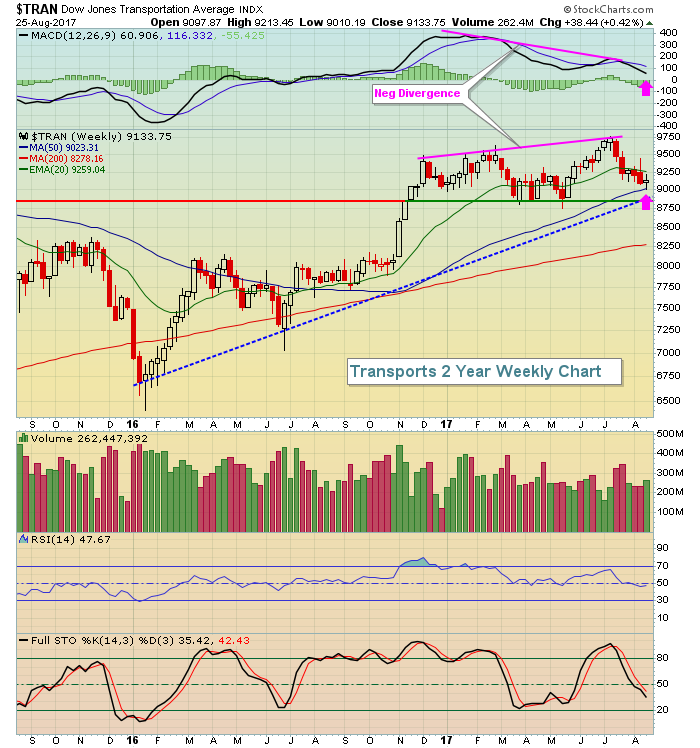 The underperformance isn't a big deal to me because the negative divergence suggested short-term selling or consolidation. The pink arrows above mark the MACD centerline "reset" and 50 week SMA that I generally look for after a negative divergence emerges. Instead of focusing on the recent weakness, I'd be much more concerned about where transports go from here. I believe the 8750-8800 level is very important in the longer-term. Price and trendline support reside at or very near that level. Another 3.0%-3.5% drop is possible and that would likely set up an awesome reward to risk entry in transportation stocks, particularly railroads ($DJUSRR) as that group also is working off a weekly negative divergence and soon will be poised for a possible run higher into year end.
Monday Setups
I'm expecting Acuity Brands (AYI) to move higher from current levels, keeping a very tight stop in play in the event it pushes to fresh new lows. Check out the chart:
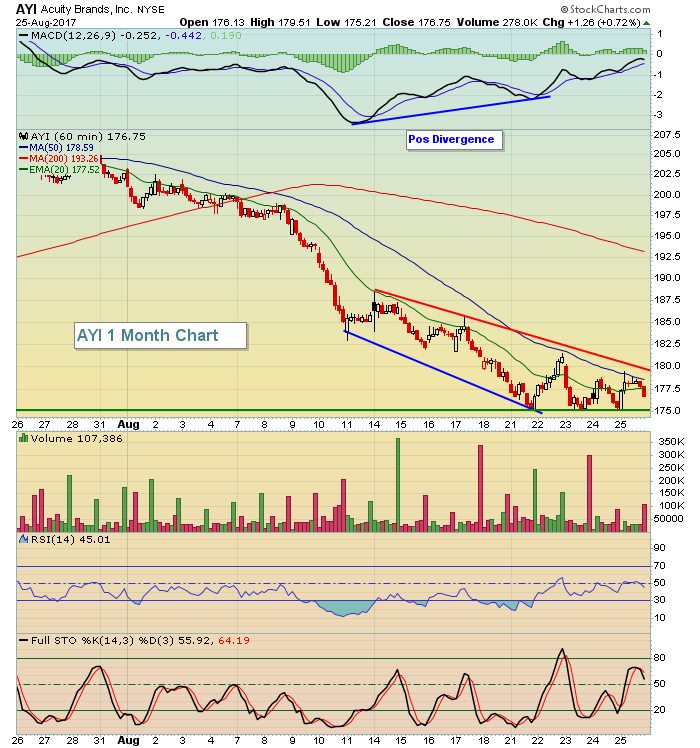 AYI posted excellent quarterly results recently and has worked its way back just beneath gap support. The selling seems to be slowing, however, as a positive divergence is in play on its hourly chart. Keep a closing stop in play beneath 175, but a break above 180 could lead to another 10% higher in AYI so I like the reward to risk here.
Historical Tendencies
October is widely viewed as a poor month for U.S. equities as it's been connected with some of the worst drops in stock market history. The crashes in 1929 and 1987 immediately come to mind. But that perception is not reality. Since 1950, the S&P 500 has produced annualized gains of 10.85% during October, ranking it as the 7th best calendar month of the year. Interestingly, however, October has been the best performing calendar month over the past two decades. Here are the numbers:
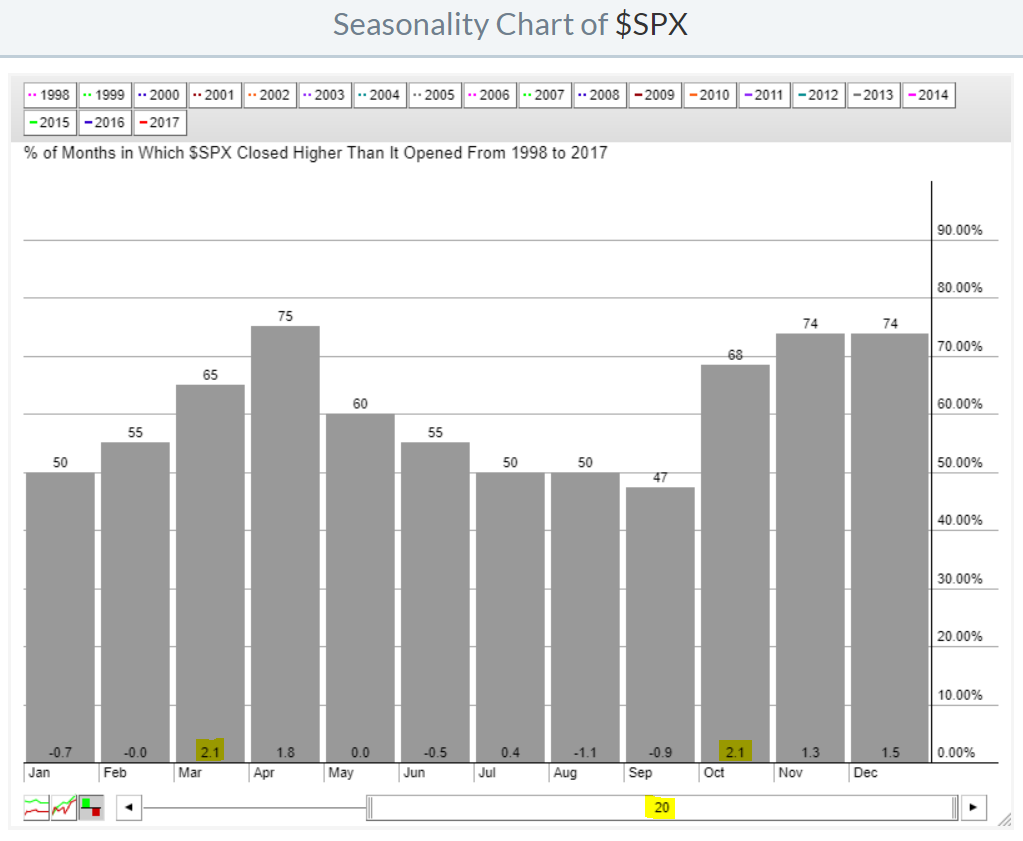 October and March have both averaged gaining 2.1% over the past twenty years and the fourth quarter has retained its advantage over the other three calendar quarters. But the biggest misconception is that October typically produces awful results in the stock market. That's simply not true.
Key Earnings Reports
None
Key Economic Reports
None
Happy trading!
Tom
